
SYNEMA: VISUAL MONITORING OF NETWORK AND SYSTEM
SECURITY SENSORS
Aline Bousquet, Patrice Clemente and Jean-François Lalande
Centre-Val de Loire Université, ENSI de Bourges, LIFO, 88 Bd Lahitolle, 18020 Bourges, France
Keywords:
Security visualization, System security, Network security, Security sensors, Security monitoring.
Abstract:
This paper presents a new monitoring tool called SYNEMA that helps to visualize different types of alerts from
well-known security sensors. The architecture of the proposed tool is distributed and enables centralizing the
collected information into a lightweight visualizer. The front-end proposes many display modes in order to
give the ability to clearly see malicious activities and to be able to visually monitor information collected at
system, network and user level in the hosts. The paper concludes with development perspectives about an
auto-configurable plugin for visual correlation of attacks.
1 INTRODUCTION
Modern computer systems are getting more and more
targeted by attackers trying to gather data or take con-
trol of remote hosts. Network and system administra-
tors need tools able to alarm them of intrusions and
attack attempts, providing aggregated views of col-
lected data. Such complex tools, combining multi-
ple security tools and intrusion detection systems are
called SIEM (Security Information and Event Man-
agement).
Administratorsof modern and large companies of-
ten use such software suites and architectures. They
need ways to analyze such data and suspected attacks.
They need to confront results and analysis from mul-
tiple and heterogeneous sources, sometimes rejecting
automatically generated rough alarms and even corre-
lated ones.
This paper presents a new open source tool, called
SYNEMA
1
(SYstem and NEtwork security tool Mon-
itoring Application), that stands for visually monitor
and analyze network and system activity on a set of
hosts.
There are multiple arguments for the visualization
of system events. Of course, in the field of Host In-
trusion Detection and Analysis, it is obvious that such
an approach can help to react on local hosts. Nowa-
days, in many cases, attacks can pass through network
protection systems, sometimes even without being de-
tected (e.g. using encrypted network packets).
1
https://traclifo.univ-orleans.fr/SYNEMA
The aim of this paper is to propose an approach
for the visualization and the visual detection of both
network and operating system sensors logs, especially
in the field of real-time attack detection, analysis and
tracking. SYNEMA conforms to the main required
characteristics to allow an efficient visualization of in-
formation and the visual correlation of log data (cf.
the visual information-seeking mantra (Shneiderman,
2002)).
The next section describes the existing related
tools and gives the key elements that motivated the
creation of SYNEMA. Section 3 presents the architec-
ture and basic functionalities of SYNEMA. Section 4
gives an overview of the expected perspectives for the
correlation algorithms that enable to visualize the dif-
ferent steps of an attack.
2 STATE OF THE ART
In (Marty, 2008), the author largely explains how to
deal with information security visualization, but the
attention is focused on network information. Even
when talking about system events, it is focused on ex-
ploiting them to gain IP addresses of the attackers. In
(Kolano, 2007; McPherson et al., 2004), the authors
provide approaches and research prototypes in order
to deal with large amounts of network data but do not
give any consideration to system logs and data. In
(Shabtai et al., 2006; Ball et al., 2004), the authors
go a step further into network data analysis regarding
375
Bousquet A., Clemente P. and Lalande J..
SYNEMA: VISUAL MONITORING OF NETWORK AND SYSTEM SECURITY SENSORS.
DOI: 10.5220/0003516203750378
In Proceedings of the International Conference on Security and Cryptography (SECRYPT-2011), pages 375-378
ISBN: 978-989-8425-71-3
Copyright
c
2011 SCITEPRESS (Science and Technology Publications, Lda.)
their temporal relationships or using live incoming
data. Nevertheless, they do not offer a real replay ca-
pability in order to confirm or infirm hypotheses of at-
tacks which is also an important feature implemented
in SYNEMA. Many papers deal with very specific but
deeply studied ways of visualizing network logs and
data, such as (Ma, 2006; Ball et al., 2004). In (Tamas-
sia et al., 2009), the author surveys more than twenty
papers about security visualization and most of them
are focused on network aspects. Only few are related
to operating systems: they deal with RBAC security
policies visualization but do not provide any ways to
track RBAC violation attempts, for example. Few ap-
proachesdeal with system events, such as (Francia III,
2008) that only provides standalone gadgets or wid-
gets, and neither any centralizing or correlation ap-
proach.
2.1 Network SIEM
In parallel to research approaches, that often focus on
visualizing very specific aspects, one can find global
monitoring platforms, i.e. SIEM either being open
source, such as OSSIM, Prelude, iVIEW, Snare or
closed source (e.g. NEXThink, Exaprotect, ArcSight
SIEM, TriGeo SIEM). Most of them (excepted Pre-
lude, iVIEW and NEXThink) are only dealing with
network security management, using NIDS and net-
work monitors. Moreover, they already provide real-
time monitoring, allowing administrators to instantly
react. Some of them, such as TriGeo Network Secu-
rity SIEM, and the next version of Prelude also pro-
vide automated network defense. But most of them
provide very limitative predefined network analysis.
NEXThink for example only allows to track success-
ful or failed connections, traffic and bitrate for hosts.
2.2 System SIEM
However, some tools do provide features for monitor-
ing the security of operating systems. For instance,
OSSIM has plugins for Host IDS, (e.g. Osiris HIDS,
OSSEC/Syslog), but they represent a very tiny part
of its 2,395 available plugins, the remaining dealing
with network data. Besides, developing a new plu-
gin is not that easy. iVIEW provides some host and
system information, but focuses more on resource us-
age than on events that occur, commands or historical
ordering of system sessions content. NEXThink sim-
ply provides a list of (new) binaries names running on
hosts.
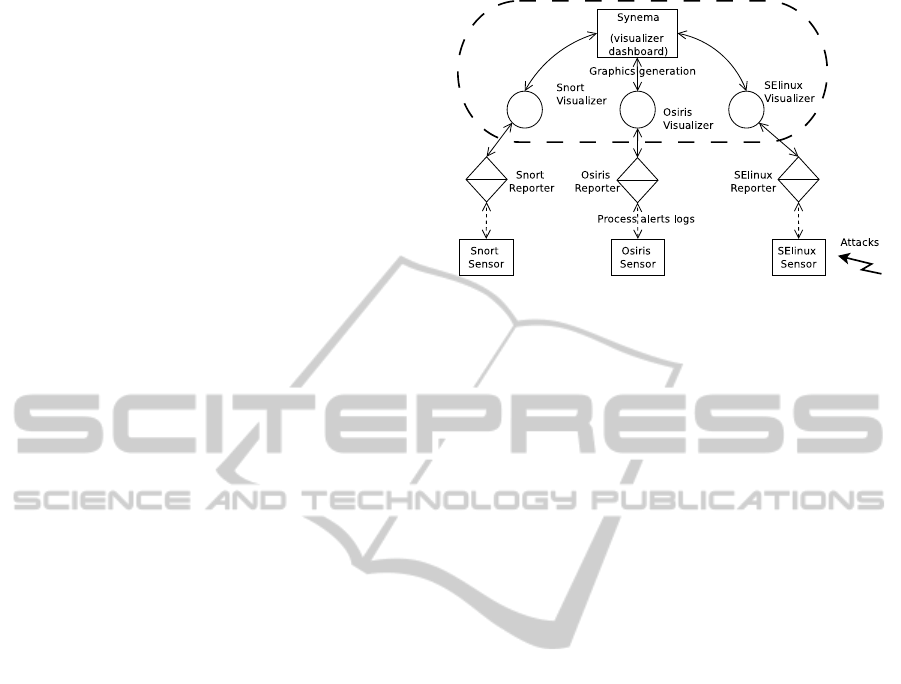
Figure 1: Main application architecture.
3 ARCHITECTURE
SYNEMA offers a distributed architecture and tries to
be adaptable to new sensors, as shown in Figure 1. It
is made of a main application, the visualizer, and two
sets of plugins: visualizer plugins and reporter plug-
ins, that are related to network and system sensors.
SYNEMA actually integrates a large panel of well
known security sensors. Two families of sensors are
considered. There are network sensors (e.g. Snort,
ModSecurity, P0f) and system sensors (e.g. SElinux,
Osiris, Syslog, Bash History).
3.1 Reporter Plugins
The reporter plugins are distant programs that mon-
itor the sensors installed on a host. In order to be
able to deal with new logs as they are being written
by the sensor, reporter plugins need to be run as dae-
mons. These plugins are used to determine which in-
formation has to be collected to generate the reports.
First, they parse the sensor’s logs, selecting the re-
quired fields. Then, they produce uniform logs so that
graphics can be drawn by the visualizer plugins, us-
ing these reports. Once text reports are created by the
daemons, they are sent to the visualizer plugins.
3.2 Visualizer Plugins
The visualizer plugins are integrated in the main ap-
plication, the visualizer (or dashboard), to graphically
display the different reports collected from the differ-
ent monitored hosts. Graphics are generated using
Ploticus, and displayed using the Cairo API. GTK+
is used to display the main interface, and the wid-
gets containing the plots. SYNEMA is thus a multi-
platform tool.
SECRYPT 2011 - International Conference on Security and Cryptography
376
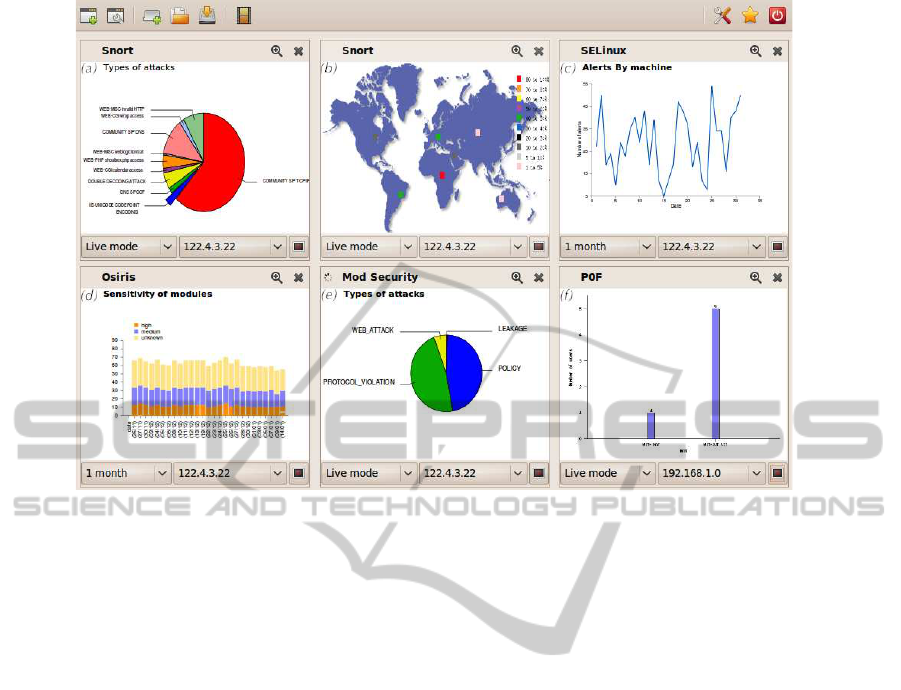
Figure 2: Overview of the main application.
The dashboard allows the user to get a general view
of the alerts for all hosts or for a particular one. In
most cases, the computed graphs may be viewed as
bars, stacks, lines or even pies, according to what the
plugin provides. Fig. 2 gives an overview of the dash-
board. This section describes the main visual results
that have been implemented for each type of sensor.
Each visualizer conforms to the visual information-
seeking mantra described above.
3.2.1 Network Visualizers
Snort reports are used to generate a world map and a
map per continent. These maps show the geographic
localization of attackers based on their IP address. For
example, Fig. 2 (b) displays the localization of attacks
sources on a machine and Fig. 2 (a) shows the seman-
tic repartition of those attacks on the same machine.
The P0f plugin is able to compute data into graphs
according to the type of link (Ethernet, modem...) and
the kernel’s version of the distant host (cf. Fig. 2 (f)).
The analysis based on syslog logs allows to filter
the events linked to SSH. The visualizer can show the
number of successful and failed login attempts and
also computes the curve that displays the number of
connected users per hour. A more complete graph
represents the distribution of successful and failed
connections per hour.
3.2.2 System Visualizers
SElinux reports allow producing graphs that show the
distribution of alerts by type (AVC, SYSCALL ...),
user, tclass, tcontext and scontext (policy elements).
A comparison curve for the audited host allows de-
termining which host is the most attacked and when
(cf. Fig. 2 (c)). Moreover, a text mode view where
the user can scroll down and look for logs in a given
period of time is available.
The Osiris visualizer is able to draw graphs of
modules sensitivity and their types (Kernel, ports,
users, groups), as shown in Fig. 2 (d). In addition,
for each modification of the file system, it measures
the location’s criticality (bin, sbin, var, lib), and of
the kind of change (modification of the file, deletion,
addition).
The Bash history visualizer can draw detailed
graphs on almost any set of commands. These com-
mands are grouped into families (e.g. file manipula-
tion (cp, scp, touch, rm etc...), file edition (vi, emacs,
tr...), file download) (wget, scp...).
Finally, the ModSecurity’s plugin can compute a
pie graph of attack types, cf. Fig. 2 (e).
4 TOWARDS CORRELATION
As SYNEMA collects heterogeneous data from differ-
ent sensors, SYNEMA becomes a good candidate to
implement correlation algorithms. These algorithms
SYNEMA: VISUAL MONITORING OF NETWORK AND SYSTEM SECURITY SENSORS
377
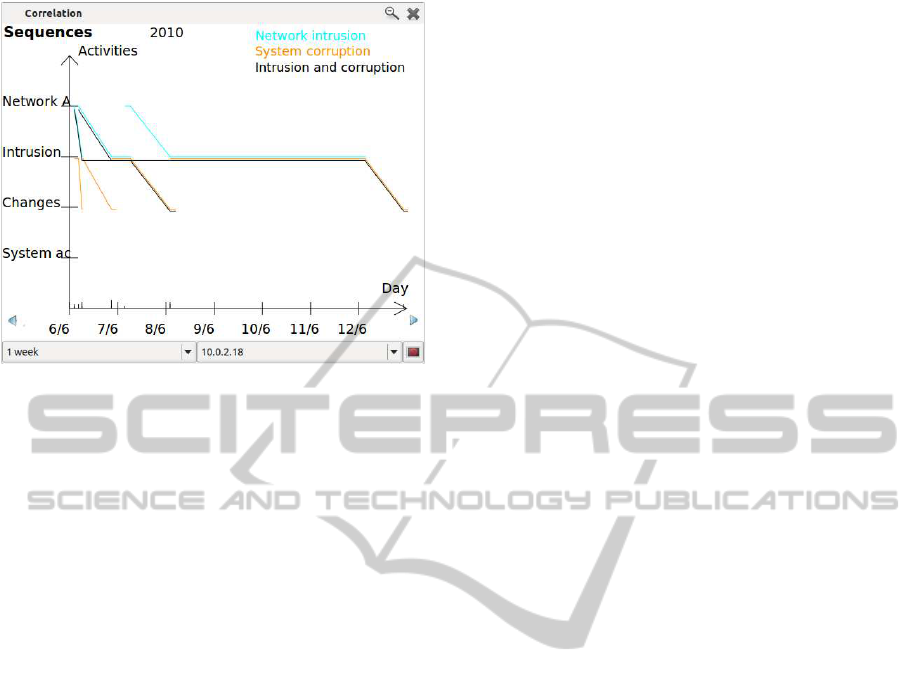
Figure 3: Correlated sequences of activities.
should be efficient in order to keep a lightweight soft-
ware. Thus, we implemented mechanisms that allow
to aggregate the captured events and to help to visual-
ize the possible correlations.
First, the events of the same nature are temporar-
ily grouped into activities. Then, SYNEMA searches
for combinations of activities (from sensors of differ-
ent natures) that reveal complete sequences of attack.
For example, Figure 3 shows sequences of attacks that
combine a network activity (revealed by Snort or p0f),
an intrusion attempt (revealed by Snort or ssh), and fi-
nally a change on the filesystem (revealed by Osiris).
Remaining difficulties have to be addressed. First,
the rules for grouping events and activities need a lot
of human expertise. Second, it is a difficult challenge
to distinguish false positive correlations and to quan-
tify the accuracy of the proposed methodology. Third,
the experimental data are based on logs of honeypots
that are quite different from a real server. Current
work address the first two points, with the develop-
ment of a partially supervised learning module, that
helps to build the correlation rules and exclude the
rules that generate false positives.
5 CONCLUDING REMARKS
In this paper is presented a new tool, SYNEMA, that
allows to visually monitor the network and the ma-
chines of this network. SYNEMA aggregates multiple
sensors visualization in one single visualization dash-
board, for both network and operating system con-
cerns. The paper explains how SYNEMA can help the
security expert to visualize the logs. Current work fo-
cus on a correlation plugin suite for SYNEMA.
ACKNOWLEDGEMENTS
The initial development of SYNEMA has been the
pedagogical support of the algorithm and program-
ming lecture of ENSI de Bourges in 2009. We
would like to thank the engineering students of the
Security and Computer Science Master degree, who
participated to the development of some plugins of
SYNEMA. Our special thanks go to Zaina Afoulki,
Steve Dodier, and Timothée Ravier for their efforts
on the core of SYNEMA.
REFERENCES
Ball, R., Fink, G., and North, C. (2004). Home-centric vi-
sualization of network traffic for security administra-
tion. In The 2004 ACM Workshop on Visualization
and Data Mining for Computer Security, pages 55–
64. ACM.
Francia III, G. (2008). Visual security monitoring gadgets.
In The 5th Annual Conference on Information Security
Curriculum Development, pages 40–43. ACM.
Kolano, P. (2007). A scalable aural-visual environment for
security event monitoring, analysis, and response. Ad-
vances in Visual Computing, pages 564–575.
Ma, K.-L. (2006). Cyber security through visualization. In
The 2006 Asia-Pacific Symposium on Information Vi-
sualisation, APVis ’06, pages 3–7, Darlinghurst, Aus-
tralia. Australian Computer Society, Inc.
Marty, R. (2008). Applied Security Visualization. Addison-
Wesley Professional.
McPherson, J., Ma, K.-L., Krystosk, P., Bartoletti, T., and
Christensen, M. (2004). PortVis: a tool for port-
based detection of security events. In VizSEC/DM-
SEC’04: the 2004 ACM workshop on Visualization
and data mining for computer security, pages 73–81,
New York, NY, USA. ACM.
Shabtai, A., Klimov, D., Shahar, Y., and Elovici, Y. (2006).
An intelligent, interactive tool for exploration and vi-
sualization of time-oriented security data. In The
3rd International Workshop on Visualization for Com-
puter Security, page 22. ACM.
Shneiderman, B. (2002). The eyes have it: a task by
data type taxonomy for information visualizations. In
IEEE Symposium on Visual Languages, pages 336–
343. IEEE.
Tamassia, R., Palazzi, B., and Papamanthou, C. (2009).
Graph Drawing for Security Visualization. In Graph
Drawing, pages 2–13. Springer Berlin/Heidelberg.
SECRYPT 2011 - International Conference on Security and Cryptography
378
