
SENSES - WHAT U SEE?
Vision Screening System Dedicated for iOS Based Devices
Development and Screening Results
Robert Kosikowski, Łukasz Kosikowski, Piotr Odya and Andrzej Czyzewski
Multimedia Systems Department, Gdansk University of Techonlogy, G. Narutowicza Street, Gdańsk, Poland
Keywords: Vision screening test, Eyesight, Mobile devices, iOS, iPhone, iPad, iPod.
Abstract: This paper describes a design and implementation of the vision screening system dedicated for iOS
(iPhone/iPad/iPod Operating System) based devices. The aim of the system is to promote and popularize the
vision tests, especially among children and youth. The examination consists of color vision and contrast
differentiation tests. After the examination the system automatically evaluates users’ answers and generates
the results. Test data are anonymously sent to the server allowing for a detailed analysis. The paper contains
analysis of the results on the population of about 3800 people. Presented data show that vision problems
concern about half of users. The analysis was divided into two age groups (pre-school children and older)
and two types of eye disorders - vision acuity and perceptions of colors including Dalton testing. Test for
the first age group has been adapted to examine people with special educational needs.
1 INTRODUCTION
The visual system in humans allows individuals for
assimilating information from the environment. The
vision loss may rob a person of the possibility of
being for example a dentist, driver or a pilot and
may dramatically decrease quality of life.
Frequently occurring defects of vision is color
blindness. There are many types of color blindness.
The most common are red–green hereditary
photoreceptor disorders. Most clinical color tests are
designed to be fast, simple, and effective at
identifying broad categories of color blindness. In
the application the Ishihara color test was
implemented. This test contains not only numerals
but also the color paths extend it.
The second very important parameter describing
the eyesight defects is the visual acuity that is a
measure of the spatial resolving power of the visual
system. This parameter indicates the angular size of
the smallest detail that can be resolved. Visual acuity
has traditionally been used as the primary indicator
of the magnitude of functional impairment due to
vision loss.
2 SYSTEM DESCRIPTION
The aim of the work was to design and to develop a
system for vision screening. The main advantages of
the application are its simplicity, friendly user
interface and the ability to perform a screening test
without any assistance of an ophthalmologist. Thus
the system objectives, such as promoting access to
health services and equal opportunities for children
with vision impairments, are met. This system is
widely available for all users of the iPhone, iPod and
iPad devices around the world. Currently, the test
may be conducted in two languages: English and
Polish.
Testing method and evaluation algorithms have
been selected on the basis of studies conducted in
Poland on a large group of several hundred
thousands of patients. The study has been carried out
since 2000.
The choice of the iOS platform was dictated by
its increasing popularity and the fact that there are a
few devices using this operating system and having
similar and reproducible parameters. The
implementation of the system described on other
mobile platforms, that use operating systems, such
as Android or Symbian would be more difficult. A
variety of devices using these operating systems are
173
Kosikowski R., Kosikowski L., Odya P. and Czyzewski A..
SENSES - WHAT U SEE? - Vision Screening System Dedicated for iOS Based Devices Development and Screening Results.
DOI: 10.5220/0003513901730180
In Proceedings of the International Conference on Signal Processing and Multimedia Applications (SIGMAP-2011), pages 173-180
ISBN: 978-989-8425-72-0
Copyright
c
2011 SCITEPRESS (Science and Technology Publications, Lda.)
very large and this would force an external calibrator
usage.
2.1 Target Platform Capabilities
iPhone and iPod devices are equipped with 3.5-inch
(diagonal) screen, while the iPad device is equipped
with 9.7 inches screen. Displays of those devices
have very good quality.
The examined group of hardware was
characterized by similar parameters, which allowed
for significantly reducing the problem of preparing
the test data to the particular device screen
characteristic. Quality and repeatability of the
devices enabled to prepare application that ensures a
sufficient level of test result reproducibility,
especially sufficient for vision screening. This
application does not require external calibrators,
which would discriminate so wide application usage.
The use of this platform guarantees also access to
good application distribution channel (the Apple
App Store), and ensures narrow collection of target
devices. These factors have allowed the
development of a universal and effective application,
useful for the end user.
2.1.1 Calibration Procedure
More than twelve devices were tested using the
color calibrator, which enables to specify the
conditions under which the person should take the
test.
Based on the results of each device the entire
graphics, which is presented to users during the
testing was adjusted.
A wavelength characteristic in orthogonal
direction with OceanOtics USB2000+ spectrometer
was measured. Brightness of the screen must be set
for each device above the average value. This
accuracy is sufficient to perform the screening test
and obtain reliable results, even for the contrast
discrimination test.
2.2 Application Design
There are two types of test available for the users.
Either test for school children or test for youth and
adults. Furthermore, the first type of test may serve
as a tool for the diagnosis of vision problems for
people with special educational needs.
Two different versions of the application have
been developed (version for iPad devices and
version for iPhone/iPod devices) to enable taking
advantage of different features of those devices.
2.2.1 Color Vision Test
The test for adults bases on the Ishihara plates and
allows also for detection of color blindness.
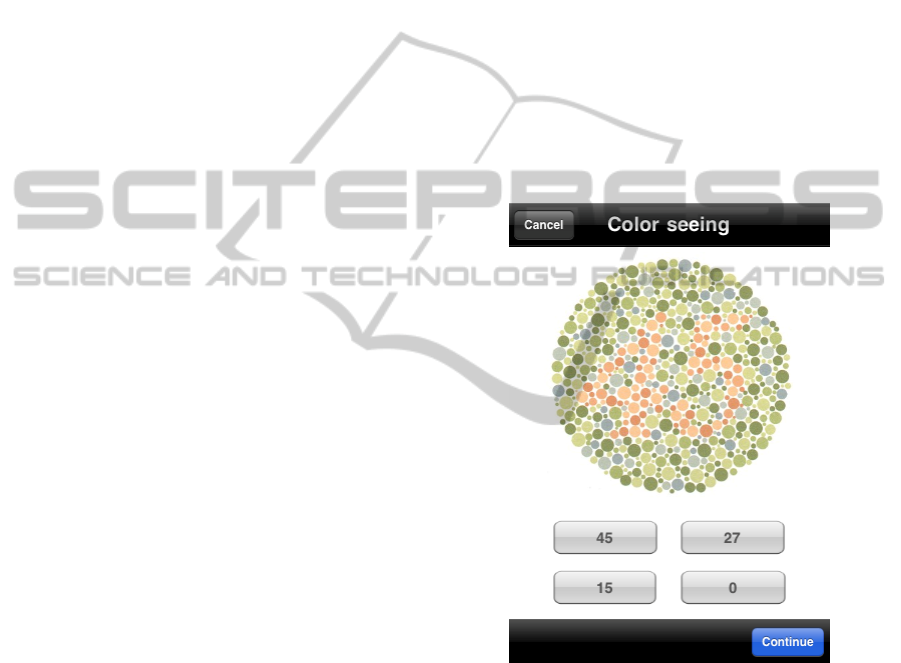
The user’s task during the test is to recognize and to
choose the correct number presented in an image or
to select the ‘continue’ option if he/she is not able to
recognize the number.
Individuals with normal color vision perceive
one number. Those with red/green color deficiency
see a different number (Durant and Zanker, 2009),
(Linhares and Nascimento, 2010), (Miyahara and
Hwang, 2006), (Nolan et al., 2008). Figure 1 shows
an example test board used in the color
discrimination test. In this case the user should select
the number 45. If the user selects the number 15, the
system will classify the answer to the red-green type
daltonism group.
Figure 1: Color discrimination test – adults’ version.
Application screenshot.
In the test for children and people with special
educational needs the person examined has to
indicate the correct path between two points on the
displayed board – maze. Because the destination
devices are equipped with high quality touch
screens, application can automatically assess
whether the correct path was pointed out.
Location and shape of the path drawn on the
screen (Figure 2) by the user are automatically
compared with the reference path parameters
assigned to the particular test case. As a criterion for
assessing the correctness of paths, the following
SIGMAP 2011 - International Conference on Signal Processing and Multimedia Applications
174
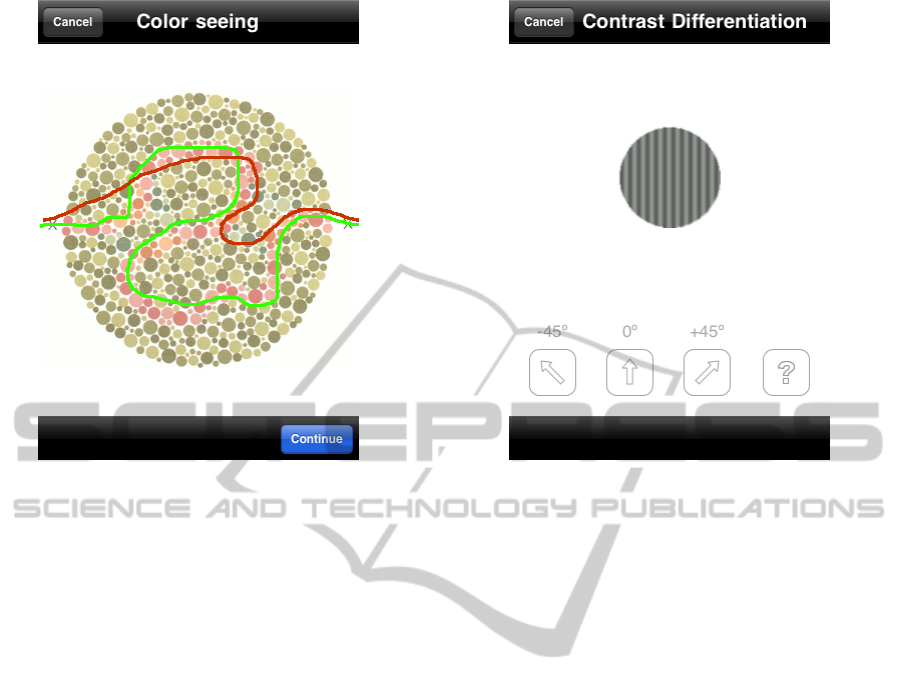
Figure 2: Color discrimination test – children version, with
additionally drawn two examples paths. Correct path has
been marked in green, while the incorrect path was
marked in red.
parameters are taken into account: its length and the
distance of points. In addition, margins of error were
determined depending on the size of the screen and
the size of the presented pattern.
2.2.2 Contrast Discrimination Test
The contrast patterns were prepared by using Gabor
2D function theorem. The Gabor functions are often
used in vision abnormalities detection and
stimulation, because these patterns can be
manipulated in spatial frequency and spatial
domains independently (Foley et al., 2005), (Graham
et al., 2010), (Hardy and Valois, 2002). The size
perception of the Gabor pattern depends on contrast.
The aim of the contrast discrimination test is to
determine the direction of slope of the line in a
presented picture by pressing the appropriate button
(Figure 3). The user performs the test for each eye
separately covering the second eye with a hand.
Depending on the correctness of answers images
with different contrast are presented, and the
contrast threshold for the user examined is
determined.
The results of the contrast differentiation test can
be presented graphically in the form of visogram,
which corresponds to audiogram for hearing tests.
An example of visogram has been presented and
discussed in Section containing the results for the
two examined age groups.
Figure 3: Contrast differentiation test. Application
screenshot.
2.3 Examination Results
After completion of the test, the application
generates the result in form of one of the following
sentences:
- you probably have vision problems;
- probably you do not have vision problems.
In the case of the negative test result, the user is
informed about the necessity of result verification
with a specialist. In such a situation, additionally
partial results are displayed, to inform the user,
which test was failed - whether she or he has
problems with color seeing, contrast
dedifferentiation, or may be both. In case of failing
result of the contrast differentiation test, detailed
result for separate eyes are displayed.
After completing the examination, system sends
detailed results of tests and additional data to the
server to enable to perform an accurate analysis. In
addition to the test outcome, information about
testing device and language, the user can agree to
share its localization data from GPS chip.
3 SCREENING RESULTS
The following Section contains a detailed analysis of
the data that have been sent from the users’ devices
at the end of the examination and stored in the local
database. In four weeks after publication of the
application in the Apple AppStore (the application
SENSES - WHAT U SEE? - Vision Screening System Dedicated for iOS Based Devices Development and Screening
Results
175
engineered is available as a free dwonload), the
complete vision test has been performed 3781 times.
The analysis of the tests results including additional
information transmitted from the user's devices has
been presented.
3.1 General Discussion
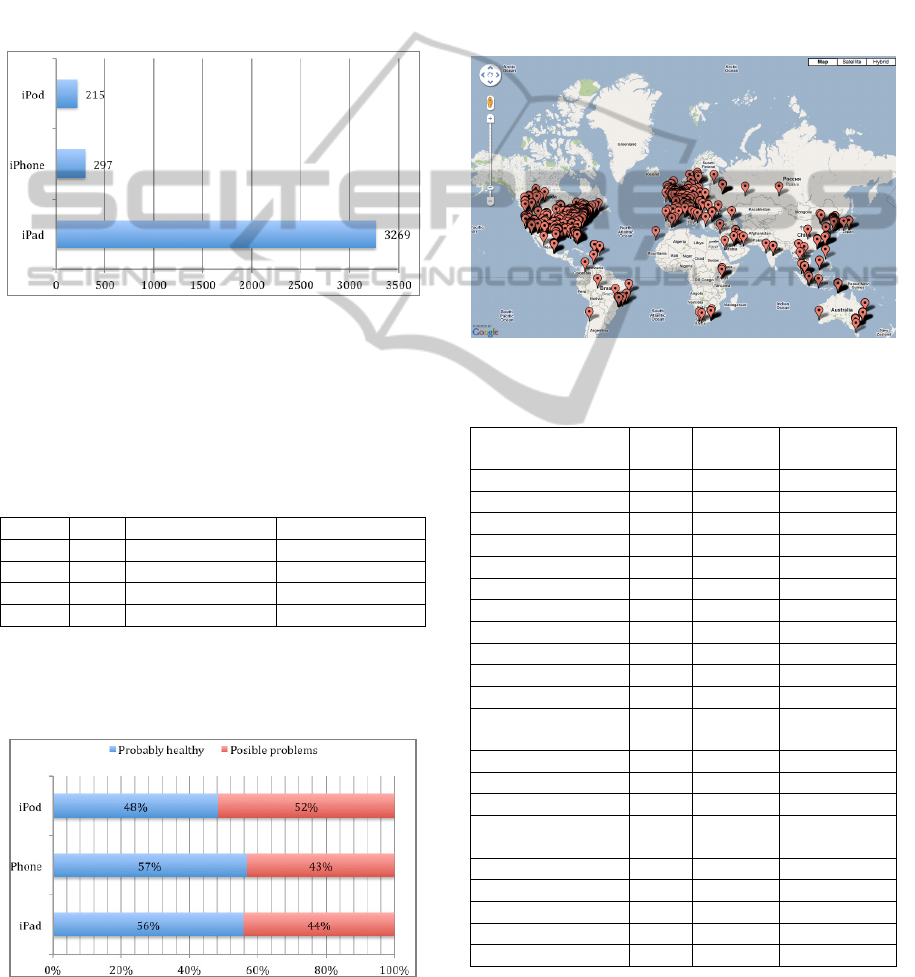
In Figure 4 the total number of tests grouped by the
device type is presented. Vision tests have been
performed 215 times on iPod device, 297 times on
iPhone and 3269 times on iPad device, respectively.
Figure 4: Total number of tests, grouped by the device
type.
Probably the largest number of test was
performed on iPads, because the App Store contains
the lowest number of medical applications dedicated
especially for those devices.
Table 1: Total test results, grouped by device.
All Probably healthy Possible problems
iPad 3269 1828 1441
iPhone 297 169 128
iPod 215 104 111
3781 2101 1680
According to Table 1, 55.92% iPad users passed
the requirements for a positive screening test result.
Combining all types of devices the test was passed
in 55.57% of cases.
Figure 5: Percentage of positive and negative results,
grouped by the device type.
The mean percentage value of positive tests results
for particular groups of devices is around 53.73%.
The percentage values grouped by the device type
are presented in Figure 5.
Some additional parameters together with the
tests results that allow for a more complete analysis
of the collected data are stored on the server. One of
the important parameters is the geographic position.
63% of users have agreed to reveal their
geographic localization at the time of the test. Figure
6 shows on the map where all those tests were
performed.
Figure 6: Places of testing in the world.
Table 2: Total test results, grouped by the country.
All
Probably
healthy
Possible
problems
United States 1669 947 722
United Kingdom 391 227 164
Italy 136 75 61
Germany 134 69 65
Republic of Korea 125 57 68
Netherlands 122 68 54
Canada 117 66 51
Australia 105 57 48
France 101 58 43
Brazil 95 51 44
Spain 85 52 33
Russian
Federation
73 42 31
Mexico 50 28 22
Poland 47 24 23
China 37 20 17
Taiwan (Province
of China)
31 12 19
Norway 28 10 18
India 25 10 15
Singapore 23 10 13
Sweden 20 11 9
3414 1894 1520
Reading language and the region code by the
application is possible for all devices on which the
SIGMAP 2011 - International Conference on Signal Processing and Multimedia Applications
176
test is performed. The region code is stored in a
format defined by ISO 3166-1 alpha-2 standard, so it
allowes for assigning users to particular countries. It
was assumed that the user maintains the same region
code even if he/she is temporarily in a different
place with another region code (this means that the
default region settings are not changed due to the
temporary change of the residence). The results for
20 countries in the function of the number of test
performed are presented in Table 2. The results in
Table 2 represent 90% of the total results. 10% of
the results spread across 58 other countries.
Results presented in Table 2 are ordered by the
decreasing number of test conducted in various
countries. The first two entries in the table are the
USA and GB, due to the fact that the application is
available in English language, which is the official
language in those countries.
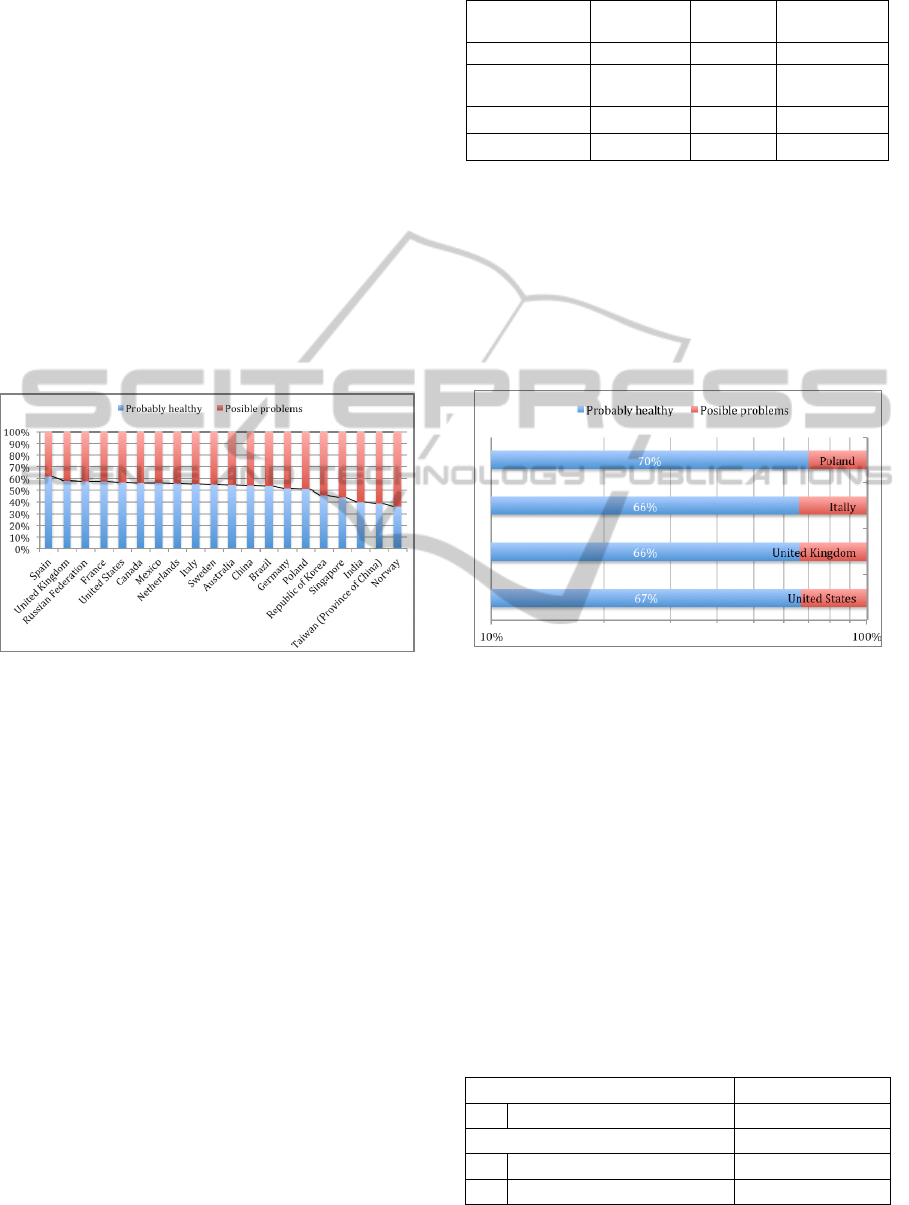
Figure 7: Percentage of positive and negative results,
grouped by the country, ordered by descending positive
results.
Figure 7 shows the percentage distribution of
results in 20 countries listed by the decreasing
number of correct results of test conducted. The
average of the properly performed tests in these
countries equals 51.87%. The biggest percentage of
properly performed tests was recorded in Spain and
the least number of properly performed tests in
Norway - in both countries tests were performed in
English language.
3.2 Adults
The largest trial group were youth and who
performed 3096 tests.
For the additional analysis three countries with
the largest number of test results and also Poland
were chosen. This is equal to 1885 test cases.
Table 3 shows the overall results of tests for
selected countries. Further individual test results are
analyzed. From the 1398 analyzed results in the
Table 3: Total test results, for selected countries.
All
Probably
healthy
Possible
problems
United States 1398 934 464
United
Kingdom
340 224 116
Italy 114 75 39
Poland 33 23 10
USA, 67% were correct, and 33% were negative and
required further vision examination and verification
of a specialist. Similarly, in the UK for the 340 tests,
66% cases obtained a positive result and 34%
negative.
Figure 8 shows the percentage distribution of
positive and negative test results. Ordered by highest
percentage of positive results in Poland to the lowest
percentage of positive results in the USA.
Figure 8: Percentage of positive and negative results, for
four selected countries.
Among 1013 negative results of test for adults,
729 people have not passed color differentiation test
(Table 4) and in 209 cases at least one answer
indicating color discrimination problems has been
given (in 89 cases at least two such answers have
been given, and the evaluation algorithm classified
those answers as characteristic for color blindness).
The contrast test was not passed in 439 cases. 334
people did not pass contrast differentiation test for
the left eye, and 255 for the right eye. It means that
150 people at the same time have provided incorrect
answers for the left and the right eye.
Table 4: Negative results of color discrimination test and
contrast differentiation test for adults.
Color discrimination test (total) 729
Daltonism 209
Contrast differentiation test (total) 439
Left Eye 334
Right Eye 255
SENSES - WHAT U SEE? - Vision Screening System Dedicated for iOS Based Devices Development and Screening
Results
177
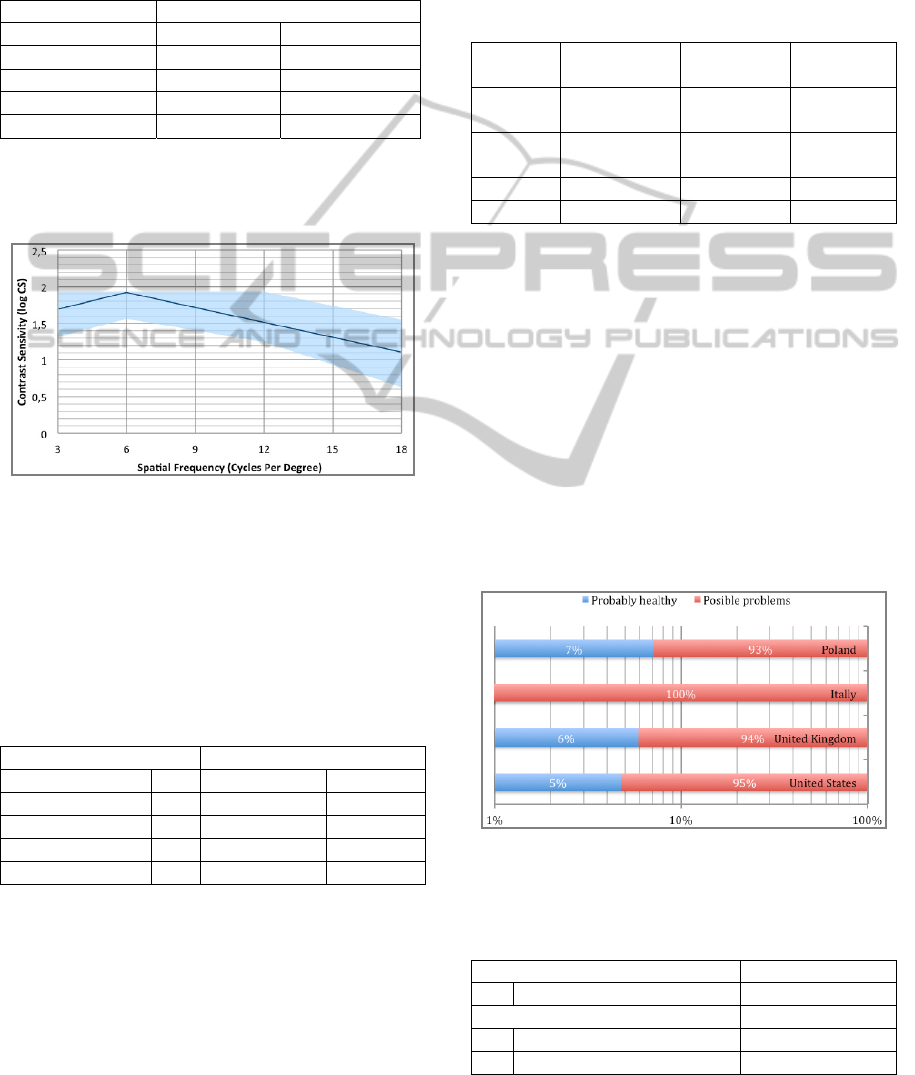
Table 5 shows the negative results of the color
test in selected countries. For each number of
negative results, the number of Dalton diagnoses has
been given.
Table 5: Negative results of color discrimination test for
adults in selected countries.
Color discrimination test
All Daltonism
United States 313 90
United Kingdom 81 21
Italy 32 8
Poland 7 2
It shows that red-green blindness appears in
average of 27% of people with vision problems
(from 25% in Italy to 29% in the USA).
Figure 9: The result indicates lack of problems with
contrast differentiation (adult).
The results from the contrast differentiation test
for one eye are presented in Figure 9. If the results
represented as a dark blue line are contained in the
threshold range marked with light blue color, the test
result is counted as passed.
Table 6: Negative results of contrast differentiation test for
adults in selected countries.
Contrast discrimination test
All Left Eye Right Eye
United States 222 169 119
United Kingdom 58 48 32
Italy 10 5 5
Poland 3 2 3
Table 6 presents the results of contrast
differentiation test for the left and the right eye
separately. It may be noted that in the case of a test
for adults, problem for both eyes simultaneously had
30% of people from the USA, 38% of respondents
from the UK and 67% of people from Poland.
People from Italy did not provide erroneous answers
for both eyes simultaneously.
3.3 School Children
Sight tests for children have been completed 712
times. These results have been subjected to similar
analysis as test results for adults. The consideration
to the same four have been considered.
Table 7: Total children examination results, in four
selected country regions.
All
Probably
healthy
Possible
problems
United
States
271 13 258
United
Kingdom
51 3 48
Italy 22 0 22
Poland 14 1 13
According to Table 7, in the United States 271
tests for children were conducted. 13 of them were
positive and 258 negative. For 51 results in the UK
48 were negative, and 3 positive.
So large number of failed tests may indicate that
the tests were performed with an inadequate
attention, or the instruction was misunderstood.
Problems with touch screen usage are also possible
for the inexperienced users.
In Figure 10 the percentage distribution of
positive and negative test results were presented.
The largest percentage value of negative test results
was obtained in Italy (100%), while the lowest
percentage value of negative test results was
obtained in the USA (95%).
Figure 10: Percentage distribution of positive and negative
test results for selected countries.
Table 8: Negative results of color discrimination tests and
contrast differentiation tests for children.
Color discrimination test (total) 660
Daltonism
--
Contrast differentiation test (total) 211
Left Eye
140
Right Eye
163
SIGMAP 2011 - International Conference on Signal Processing and Multimedia Applications
178
660 persons engaged in a test designed for children
obtained a negative color vision test result (Table 8).
In the case of children's examination, the daltonism
test is not executed.
The contrast test was not passed by 211 people
of which 140 people failed a contrast test for the left
eye and 163 for the right eye. Hence the conclusion
that 92 people got incorrect answers for the left eye
and right at the same time.
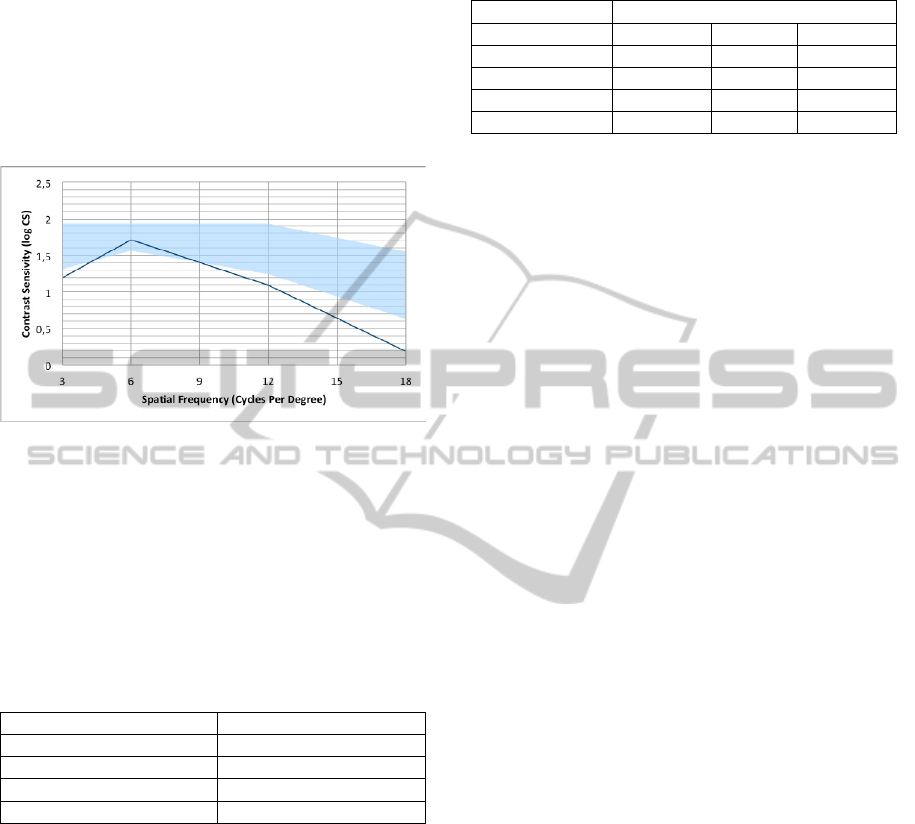
Figure 11: An example of a visogram for children. The
result indicates problems with contrast differentiation
(children)
The results of the contrast differentiation test for
one eye are presented in Figure 11. Because the
results represented as dark blue line are not
contained in the threshold range marked with light
blue color, the test is not evaluated as passed.
Table 9: Negative results of color discrimination test for
children in selected countries.
Color vision test
United States 254
United Kingdom 47
Italy 22
Poland 13
Table 9 shows the negative results of the color
seeing test in selected countries. According to Table
7 and Table 9, 98% of all negative results in USA
were caused at least by the problem with color
vision. Similar conclusions can be derived for other
countries, where percentage values are equal to or
greater than 98%.
Table 10 presents the contrast differentiation test
results for children. The data are presented for the
left and right eye separately.
It may be noted that in the case of a test for children,
problem for both eyes simultaneously had 49% of
people from the USA, 44% of respondents from the
UK and 40% of people from Italy. People from
Poland did not provide erroneous answers for both
eyes simultaneously.
Table 10: Negative results of contrast differentiation test
for children.
Contrast differentiation test results
All Left Eye Right Eye
United States 92 73 64
United Kingdom 16 13 10
Italy 5 3 4
Poland 3 2 1
4 CONCLUSIONS
Performed analysis was made according to results
from the group of unique users. Additionally 893
persons performed the test at least 2 times and
maximum 12 times.
There may be doubts whether a particular test
was made just for trying, or to obtain a conclusive
result. Since the results of examination are sent to
the data storage at the end of the test, this may lead
to the conclusion that the users’ intention was to
finish the test and to obtain reliable results. It should
be noted that the test results strongly depend on how
precisely the person performing the test respects the
instructions displayed on the device’s screen
(lighting conditions, recommended distance of eyes
from the screen).
The latest versions of iOS based devices allow
for the preparation of a system capable of producing
more reliable results. Built in cameras would allow
not only control the lighting conditions during the
test, but also to check the distance from the device
screen. Considering the great popularity of the
application it will be made supported by other
languages, which should increase the number of
conducted examinations and eliminate errors caused
by the language barrier.
Results of color differentiation test for children
suggest that there is a need to add the feature
indicating the path in a multi-step manner through
repeatative taking the finger off the device screen.
The results presented in the paper confirm the need
to perform vision screening tests. It should be noted
that the examination sessions were not conducted in
the laboratory, and during the test the user was able
to manipulate the distance of the device from the
eyes, which facilitated the correct answer
identification.
Procedures of the detection of vision defects
have been chosen on the basis of research carried out
by using computer vision test system. The internet
version of the system is available at the address:
www.telewelfare.com.
SENSES - WHAT U SEE? - Vision Screening System Dedicated for iOS Based Devices Development and Screening
Results
179

ACKNOWLEDGEMENTS
Research funded within the project No.
POIG.01.03.01-22-017/08, entitled "Elaboration of a
series of multimodal interfaces and their
implementation to educational, medical, security and
industrial applications". The project is subsidized by
the European regional development fund and by the
Polish State budget".
REFERENCES
Durant, Sz. and Zanker, J. M. (2009). Characterizing
motion contour detection mechanisms and equivalent
mechanisms in the luminance domain. Journal of
Vision, 9(1). doi:10.1167/9.1.36
Foley, J. M., Varadharajan, S. L., Koh, C. C. and Farias,
M. C. Q. (2005). Spatial Vision I Detection of gabor
patterns. Journal of Vision, 5(8). doi:10.1167/5.8.181
Graham, N., Wolfson, S., Kwok, I. and Grinshpun, B.
(2010). Buffy contrast adaptation with a single Gabor
patch. Journal of Vision, 10(7). doi:
10.1167/10.7.1386
Hardy, J. L. and Valois, K. K. (2002). Hue-selective
elevation in luminance contrast detection threshold
following adaptation to luminance-varying gabor
patches, 2(7). doi:10.1167/2.7.209
Linhares, J. and Nascimento, S. (2010). Color and light:
Mechanisms Testing models of color deficiencies
using normal observers with Ishihara plates simulated
for color deficient observers. Journal of Vision, 10(7).
doi:10.1167/10.7.431
Miyahara, E. and Hwang, P. C. (2006). Color Misreading
patterns of Ishihara plates by normal trichromats.
Journal of Vision, 6(6). doi:10.1167/6.6.235
Nolan, J., Riley, S. and Loveall, S. (2008). Color
Perception Color naming based on clinical visual
condition: A surprising interaction. Journal of Vision,
8(6). doi:10.1167/8.6.579
SIGMAP 2011 - International Conference on Signal Processing and Multimedia Applications
180
