
EXPERIMENTAL VALIDATION FOR TR-UWB SYSTEMS
By Time Delayed Sampling & Correlation (TDSC)
Jorge A. Pardiñas-Mir, Muriel Muller, Roger Lamberti and Claude Gimenes
Institut Telecom, Telecom SudParis, 9, rue Charles Fourier, 91011, Evry, France
Keywords: Transmitted reference (TR-UWB), Ultra wide band (UWB), CMOS circuit, Impulse radio (IR).
Abstract: Detection results of transmitted reference ultra-wideband signals (TR-UWB) are presented. The signals are
received through the implementation in CMOS technology of the ‘Time Delayed Sampling and Correlation’
(TDSC) detection method, which allows the test of its performance and validates the first stage of the
synchronization process. This method has been proposed to achieve a UWB system with low cost, low
complexity and low power consumption for medium to low data rate applications such as ranging or
localization. Detection of such signals has been done successfully in both a direct cable connection as well
in a wireless system with a real channel. In both cases they were used in the sub GHz band (group1) and
also in the low band UWB signals.
1 INTRODUCTION
Since the new regulations adopted by the U.S.
Federal Communications Commission (F.C.C.,
2002) related to the use of the ultra-wideband
(UWB) signals, research and industrial work in this
area has increased in the last years, leading to the
definition of many standards (IEEE, 2007), (ECMA,
2008) and encouraged new applications (Gezici,
2008), (Jofre et al., 2009).
One objective to achieve at the low-data rate
communication applications is that of developing an
UWB device that has a low complexity, that is low
power consuming and that has a low cost. The ‘Time
Delayed Sampling and Correlation’ (TDSC)
detection method has been proposed to conceive a
receiver that meets such an objective (Muller et al.,
2008).
The TDSC detection method is a pseudo-
coherent receiver based on the correlation between
two waveforms captured from a transmitted
reference UWB (TR-UWB). The theoretical study of
the design parameters for a CMOS implementation
of the method using 0.35 m technology, the
prototype design and simulation, the characterization
and first tests of the prototype were presented in
(Hirata-Flores et al., 2008), (Hirata-Flores, 2008)
and (Saber et al, 2008).
Work is done for developing a ranging and
positioning strategy based on the TDSC detection
method considering that UWB signals are well
suited for this application because of its time
resolution (Gezici et al., 2005).
This paper propose to go ahead with the test
platform based on the first validation step and to
validate the detection method as the base of the
synchronization procedure proposed in (Saber et al,
2008) using the TR-UWB signals acquired thanks to
the platform. The TDSC detection method and the
integrated circuit that implements it are described
briefly in section II. The synchronization process
proposed for a receiver that uses the TDSC detection
is explained in section III. Section IV presents the
platform that has been developed for testing the
circuit and the synchronization method along with
the results of the detection tests.
2 TIME DELAYED SAMPLING
AND CORRELATION
DETECTION
2.1 The TDSC Detection Method
The TDSC method is based on the use of a UWB
signal with a transmitted reference which is called a
TR-UWB signal. In its simplest way this signal uses
a pair of pulses, called doublet d(t), conforming to
the FCC spectrum mask for each symbol transmitted
87
A. Pardiñas-Mir J., Muller M., Lamberti R. and Gimenes C..
EXPERIMENTAL VALIDATION FOR TR-UWB SYSTEMS - By Time Delayed Sampling & Correlation (TDSC).
DOI: 10.5220/0003509000870094
In Proceedings of the International Conference on Wireless Information Networks and Systems (WINSYS-2011), pages 87-94
ISBN: 978-989-8425-73-7
Copyright
c
2011 SCITEPRESS (Science and Technology Publications, Lda.)
with a period of T
S
seconds: a reference pulse g
1
(t)
and an information pulse g
2
(t) delayed by T
D
seconds from the reference and modulated by the
information bits b
k
.
)()()(
21
tgtgtd
(1)
1
() ()gt pt
)()(
2 Dk
Ttpbtg
(2)
In the case of synchronization or ranging related
symbols, g
2
(t) is not modulated, b
k
=1, carrying the
same pulse shape as that of g
1
(t) but delayed by T
D
seconds.
)()(
1
tptg
)()(
2
D
Ttptg
(3)
() () ( )
D
dt pt pt T
(4)
Figure 1 shows the structure of a TR-UWB symbol
for the case where a BPSK modulation is used.
b)
reference
pulse
information
pulse
doublet
T
S
T
D
reference
pulse
information
pulse
t
one symbol
Figure 1: Symbol structure of a TR-UWB signal.
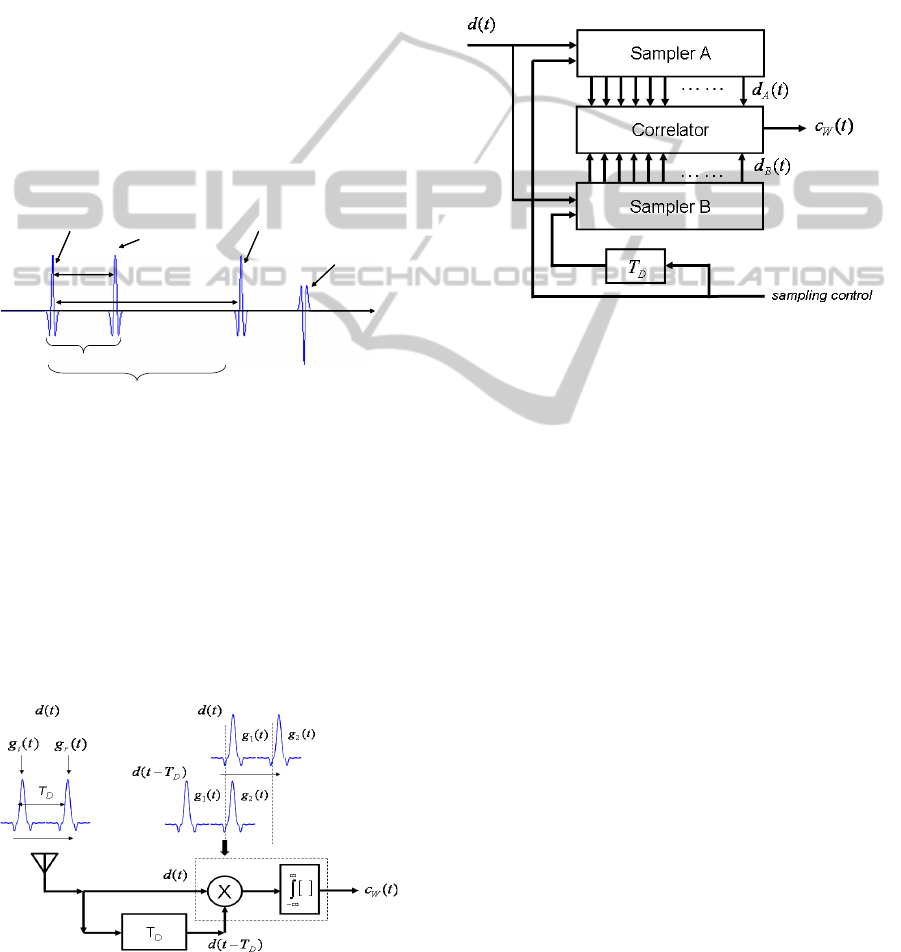
The detection of the TR-UWB signal is made
through a correlation receiver which correlates the
information pulse with the transmitted reference that
has been delayed in time. The delay line must have a
wide frequency response, highly linear phase, very
good impedance matching and highly stable delay,
which is difficult to integrate. The block diagram of
such a receiver is shown in figure 2 where the
effects of channel and noise have been omitted for
ease of illustration.
Figure 2: Block diagram of the TR-UWB receiver.
The TDSC detection method proposes the
substitution of the wide band analog delay line by a
pair of samplers controlled by a digital delay
(corresponding to T
D
). In this way both pulses g
1
(t)
and g
2
(t) can be sampled and be available at the
same time inside the sampling windows. The
waveform correlation can be made either using an
analog multiplier or by a digital processor. Figure 3
shows the blocks that make the function of time
delaying and correlation.
Figure 3: Samplers that substitute the analog delay line.
The value obtained at the output of the correlator
is evaluated to determine the value carried by the
information pulse. In the example shown, a positive
value would mean an information pulse in phase,
while a negative value would mean an information
pulse with a 180° phase.
The method was validated according to the IEEE
UWB channel model (Molisch et al., 2006) and
implemented (Hirata-Flores, 2008) using a 0.35 m
CMOS technology. The most important details of
this prototype are explained in the next section.
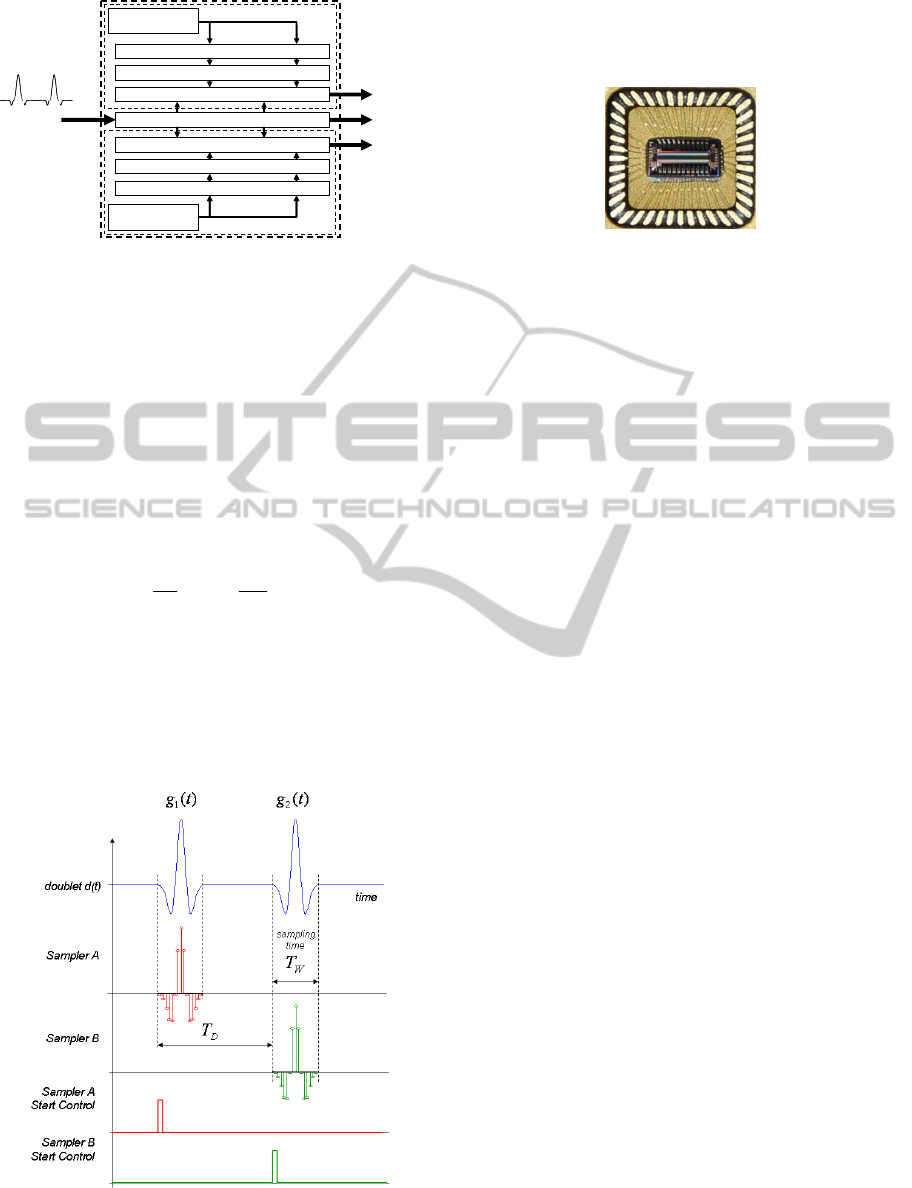
2.2 CMOS Implementation
The block diagram of the prototype circuit that
implements the TDSC detection method is shown in
figure 4. It includes the two samplers described in
the previous section, designed using nMOS
transmission gates (TG), each one including a
register with a length of 128 cells. The high speed
sample clock generation circuit uses as its basis an
analogically-adjustable edge triggered asynchronous
delay line which allows multi-gigahertz sampling
frequencies as high as 7.5 GHz. A coplanar wave
guide (CPW) is used for guiding the RF signal.
WINSYS 2011 - International Conference on Wireless Information Networks and Systems
88
Shift Register Read Clock Generation
Delay Line Write Clock Generation
Transmission Line
Shift Register Read Clock Generation
Delay Line Write Clock Generation
Non-overlapping
Clock Generation
Non-overlapping
Clock Generation
128 Samplers Bank
128 Samplers Bank
TR-UWB
Signal
TR-UWB
Signal
Sampled
Output A
Sampled
Output B
SAMPLER A
SAMPLER B
Figure 4: Block diagram of the TDSC prototype circuit.
Assuming that the receiver is synchronized, the
contents of this registers, d
A0
and d
B0
, can be
expressed as:
)1(
)()(
0
00
0
eW
e
A
TNtr
nTtrtr
d
(5)
)1(
)()(
0
00
0
DeW
DeD
B
TTNtr
TnTtrTtr
d
(6)
s
e
f
T
1
e
W
W
T
T
N
(7)
Figure 5 shows the relation between the sampling
control pulses and the sampling and recording of
each TR-UWB pulse into each of the registers of the
TDSC chip, where T
W
is the length of the register,
and time instant t
0
is the start control for the sampler
A.
Figure 5: Sampling and recording of each TR-UWB pulse
according to control pulses for each separate register.
In figure 6 it is shown the packaged circuit of the
TDSC receiver circuit, whose chip dimensions are
L=3.5 mm and W=1.7 mm.
Figure 6: Picture of the TDSC circuit chip.
For the circuit to be able to correctly detect the
incoming pulses, a previous synchronization process
must be carried out. The next section briefly
describes this process.
3 SYNCHRONIZATION
PROCESS
The goal of the synchronization process is to find a
time reference into the symbol for sampling the
pulses at the correct time and then be able to detect
the information. The technique used here for the
TDSC detection method is lightly modified
compared to the one proposed in (Saber et al, 2008)
in order to manage the worst case where one
correlator is used and only one correlation is
computed for each symbol.
The synchronization process is based on the
search of the maximum correlation value along the
symbol.
The synchronization process starts by sampling
the synchronization sequence at a certain reference
point t
0
. Pulse waveforms are sampled and saved in
the registers A and B of length T
w
each other. Then
the receiver tests the existence of the pulses into the
sampled windows by correlating them according to
(8). The computed value corresponds to the
maximum value of their cross-correlation.
00
1
0
000
)()(
B
T
A
N
n
DeeW
W
TnTtdnTtdc
dd
(8)
The resulting c
W0
value is saved and other
correlations are made and saved, applying a time
shift along the whole symbol. When all correlations,
as described in (9), are obtained, the maximum value
corresponds to the presence of the pulses into the
registers.
EXPERIMENTAL VALIDATION FOR TR-UWB SYSTEMS - By Time Delayed Sampling & Correlation (TDSC)
89
1
0
0
0
)(
)(
W
N
n
De
e
Wk
TnTktd
nTktd
c
(9)
1,,2,1,0
,,,
)1(10
Kk
ccccc
KWWkWWW
(10)
where K is the number of needed correlations in
order to sweep the whole symbol.
S
T
K
(11)
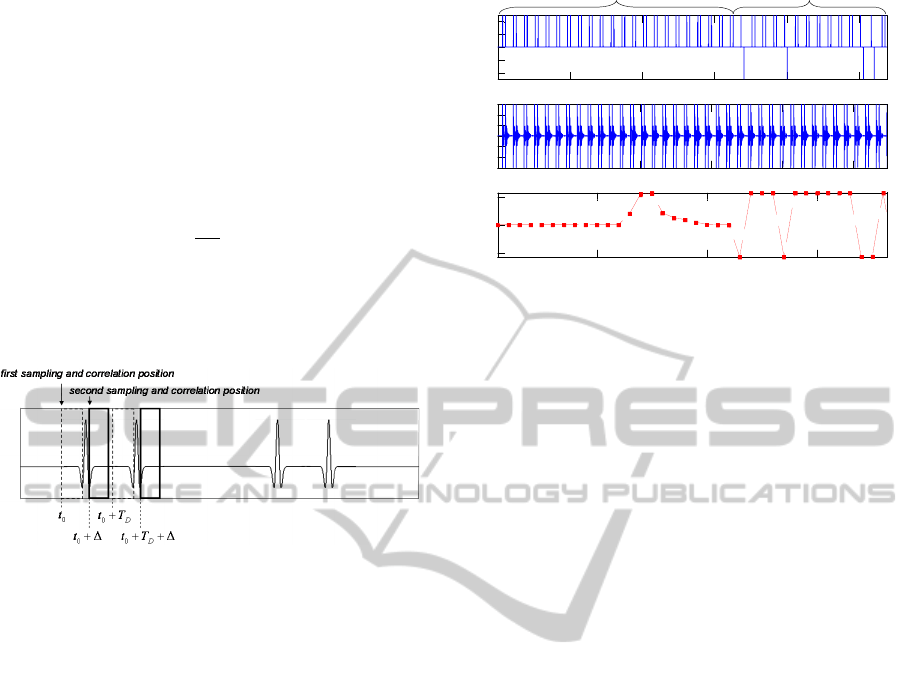
The process is shown in figure 7 for the first
sampling and correlation position, followed by a
shifted new one.
Figure 7: Time shift between consecutive sampling and
correlation windows.
Once the highest correlation value along the
symbol is identified and so its position, the detector
can correctly acquire the transmitted pulses at such
instant. Note that this process is simplified compared
to others detection methods, because it only needs
that the UWB pulses fall inside the sampling
windows T
W
, in order to be reliably detected (Muller
et al, 2007).
Figure 8 shows one example of the simulations
made to test the synchronization procedure. The
baseband TR-UWB signal, shown in 8.a, is
composed of a sequence of symbols dedicated to the
synchronization and some subsequent symbols that
carry on information bits modulated with a phase
shift of 180°. In figure 8.b it is shown the signal
translated in frequency at 4 GHz with the effects of
the channel and added noise. The last graphic shows
the results of the correlations made to obtain the
synchronization and to detect the information bits. In
this example the maximum value is obtained for k =
15, which means that the doublet is located 15
seconds after the starting reference time t
0
.
In the simulations it was calculated one point of
correlation for each symbol, meaning that K
symbols are necessary to obtain the whole swept
equivalent to the time duration of one symbol.
0 0.2 0.4 0.6 0.8 1
time, secs
2 4 6 8 10
x 10
8
time, secs
doublet UWB après le canal (h surechan.)
x 10
17
10 20 30
time, secs
time, secs
0 2 4 6 8
0 2 4 6 8
4
2
0
-2
-4
4
2
0
-2
-4
6
0
-6
a)
b)
c)
sequence of synchronization sequence of information data
correlation step k
Figure 8: Correlation values obtained after the swept of
the equivalent of one complete symbol.
The synchronization procedure is based on the
detection of pulses during the synchronization
sequence and once this is obtained then the detection
of the information bits is carried out. The next
section demonstrates the detection of the pulses of
the TR-UWB signal using the TDSC circuit with
different configurations.
4 EVALUATION TESTS AND
RESULTS
This section presents the tests carried out to validate
the detection method from real signals acquired
through the TDSC CMOS prototype. First the
structure of the test cards is described, in order to
show the conditions under which the validation was
done. Second it is explained the different
configurations used for the tests and finally the
experimental results are presented.
4.1 Test Cards
In order to specify the chip performance and validate
for the first time the detection method, the very first
basic tests of the TDSC IC were done over a test
board using a generator instrument and a digital
oscilloscope (Hirata-Flores, 2008). For a broader test
of the circuit and the evaluation of the
synchronization method and detection of data
presented in this paper, two test cards were designed
and realized: a transmitter card and a receiver card.
The transmitter card is based on a DS89C450
microcontroller to produce a squared signal that
generates the frame, a step recovery diode (SRD) for
producing very short-in-time pulses and a short-
circuit line to help produce the final waveform.
WINSYS 2011 - International Conference on Wireless Information Networks and Systems
90
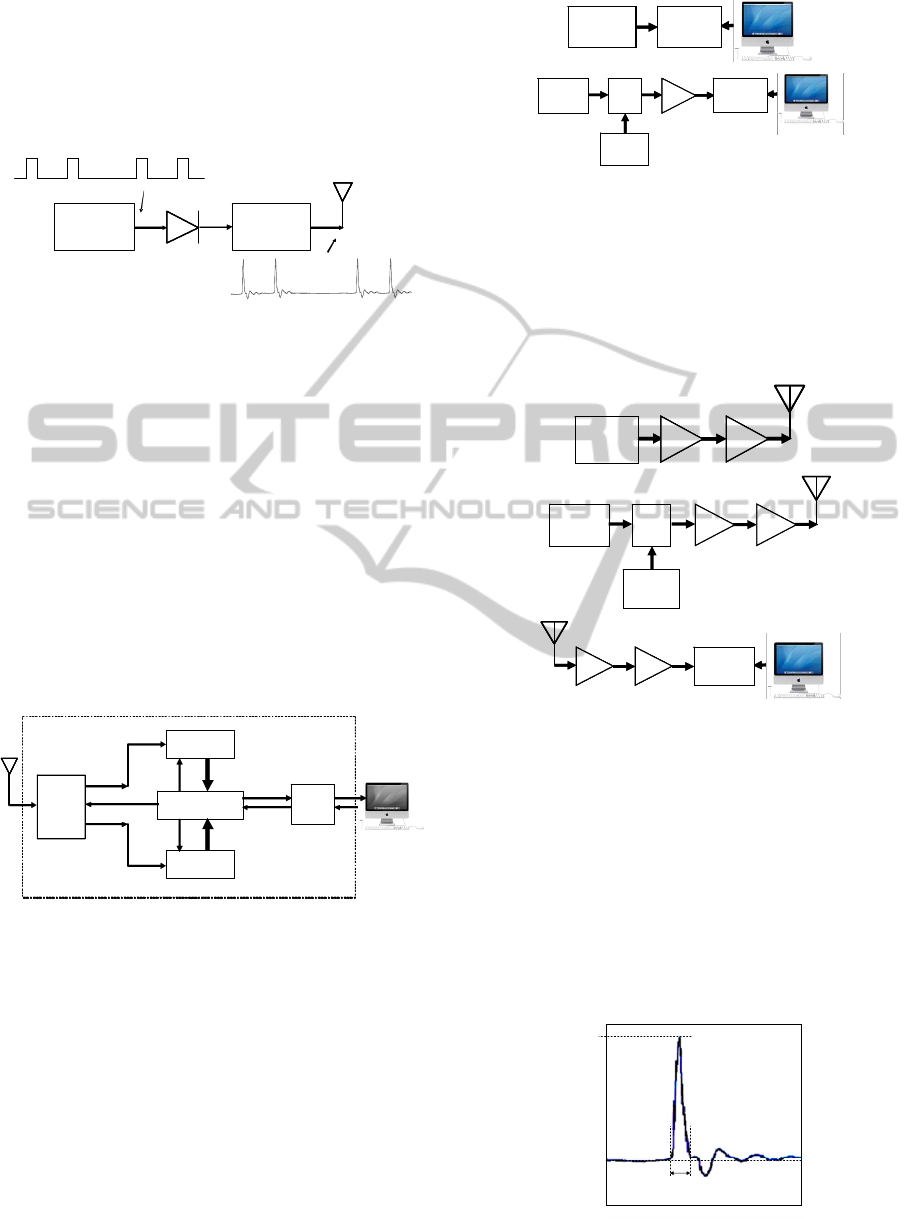
Thanks to this transmitter, TR-UWB signals are
generated in a simple way independently of other
equipment. It is also possible to control the time
between the pulses that could be as short as 140 ns
and can be incremented in 33 ns steps. Figure 9
shows the block diagram of the transmitter.
Microcontroller
SRDSRD
Waveform
Sha per
(short-circuit line)
(D S89C45 0)
Figure 9: Block diagram and pulses waveforms of the
transmitter test card.
The receiver card has been designed to help the
development and the evaluation of the detection and
synchronization methods. The card is also based on
the DS89C450 microcontroller, which sends the start
control signals to the TDSC circuit, as those shown
in figure 5, to sample and write into the registers the
incoming TR-UWB signal. The outputs of the
registers are fed to an analog to digital converter
(ADC) and sent to a computer for further processing
through a MATLAB program as shown in figure 10.
The signal detection is done by correlating the
acquired signals. All the control signals to the TDSC
circuit, the converters and the RS232 interface are
generated by the microcontroller.
samples B
write/ read
TDSC
Integrated
Circuit
ADC
(ADS931)
ADC
(ADS931)
Microcontroller
(DS89C 450)
Interface
RS232
(MAX232)
samples A
c o nv ert e d b yte A
conversion
clock A
Tx
Rx
conversion
clo ck B c o nv ert e d b yte B
Figure 10: Block diagram of the receiver test card.
4.2 Test Configuration
The tests were run using two kinds of TR-UWB
signals: a baseband signal, whose bandwidth extends
to around 1 GHz, and a frequency translated signal
centred at 4 GHz. It was used both a wired and a real
wireless channel.
For the tests using a wired channel, both the
transmitter and the receiver were connected directly
by a cable as shown in figure 11.
In the case of the tests at 4 GHz, a mixer was
employed to easily translate the baseband signal in
frequency, also shown in figure 11.
a)
Récepteur
TDSC
Récepteur
TDSC
EmetteurEmetteurEmetteurEmetteur
Transmitter
TDSC
Receiver
b)
EmetteurEmetteur
AMPAMP
MIXMIX
Générateur
RF
Générateur
RF
Récepteur
TDSC
Récepteur
TDSC
EmetteurEmetteur
AMPAMP
MIXMIX
Générateur
RF
Générateur
RF
Récepteur
TDSC
Récepteur
TDSC
Transmitter
TDSC
Receiver
RF
Generator
Figure 11: a) Direct connection between test cards at base
band. b) Transmitted signal translated at 4 GHz.
In the case of tests with a wireless channel, both
the baseband signal and the 4GHz signal were
transmitted through antennas (monopole and
discones), although these were not optimized for the
system. Figure 12 shows the configurations used.
a)
EmetteurEmetteur
AMPAMP
AMPAMP
EmetteurEmetteur
AMPAMP
AMPAMP
Transmitter
b)
EmetteurEmetteur
AMPAMP
MIXMIX
Générateur
RF
Générateur
RF
AMPAMP
Transmitter
RF
Generator
c)
Récepteur
TDSC
AMPAMP AMPAMP
Récepteur
TDSC
AMPAMP AMPAMP
TDSC
Receiver
Figure 12: a) Transmitter configuration used at base band.
b) Transmitter configuration used at 4 GHz. c) Receiver
configurations for both cases.
4.3 Experimental Results
4.3.1 Transmitted Signal
The transmitted TR-UWB signal comprised pulses
with a length of around 1 ns, a T
D
spacing time of
366 ns and a symbol period of 2.66 us. The
waveform reaches a maximum amplitude of 1.16
volts as shown in figure 13.
0 V
1.16 V
1.19 ns
amplitude (V)
time (ns)
Figure 13: Waveform of the transmitter output pulse.
EXPERIMENTAL VALIDATION FOR TR-UWB SYSTEMS - By Time Delayed Sampling & Correlation (TDSC)
91
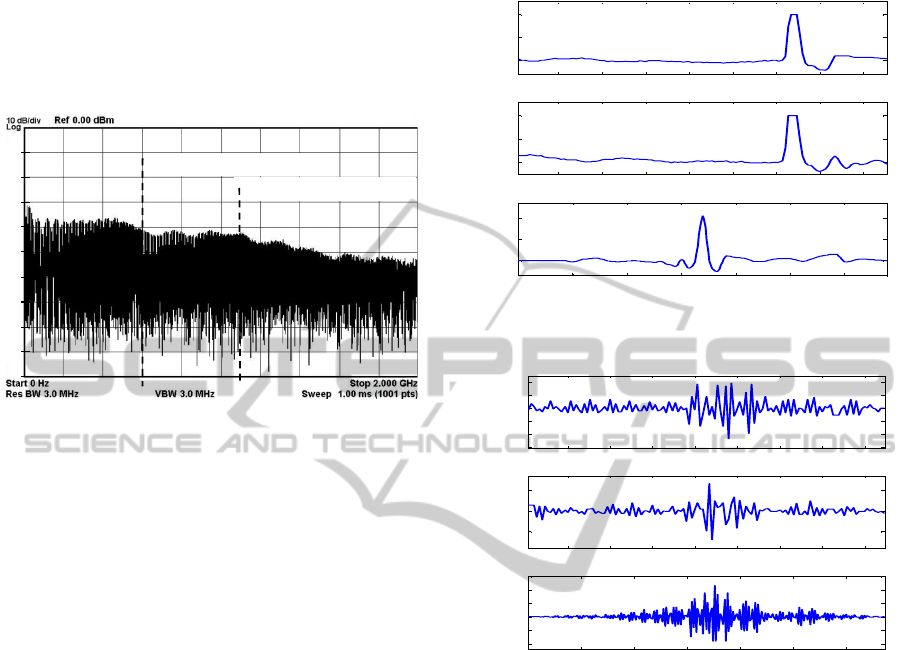
In figure 14 it is shown the power spectral
density of the signal measured directly at the output
of the transmitter. As we can see, the bandwidth at
the power level of -43 dBm reaches a value of
around 1.1 GHz. The sampling frequency of the
TDSC circuit that was used during the tests was
estimated equal to 7.5 GHz (Hirata-Flores, 2008).
f
200 MHz
f
200 MHz
BW = 600 MHz @ -40 dBm
BW = 1.1 GHz @ -43 dBm
-10
-20
-30
-40
-50
-60
-70
-80
-90
Figure 14: Power spectrum density of the transmitter
output pulse.
To allow the MATLAB program to
automatically manage the reception process, it was
necessary to previously manually calibrate it. This
was achieved for each test case, identifying an
adequate threshold value of the correlation to
distinguish between the presence and absence of
pulses in the received signal. In this way the test
system was able to continually receive and detect the
symbols in a reproducible way. The figures
presented in the following subsection correspond to
one example of the received signals for each case.
4.3.2 Configuration with Cable Connection
Figures 15 and 16 show the waveforms received in
the case of the direct connection between the
transmitter and the receiver. The former corresponds
to the baseband signal, while the latter is the signal
translated at 4 GHz. The first and the second
waveforms are the contents of registers A and B
respectively, while the last waveform is the result of
the cross-correlation function between the two of
them. The value shown as “Corr. Max” corresponds
to the maximum value of the cross-correlation, c
W0
,
as it was explained in section 2.2 and defined in (8).
The amplitude of the signals is normalized.
In both cases, baseband and pass band at 4 GHz,
it was successfully found and fixed a threshold for
the correlation value to detect the pulses. While for
the baseband the maximum correlation value was
around 4.21, for the pass band signal it was around
0.2.
2 4 6 8 10 12 14 16
0
0.5
1
2 4 6 8 10 12 14 16
0
0.5
1
0 5 10 15 20 25 30
0
2
4
Corr. Max = 4.2196
amplitude
(norm)
correlation time (ns)
amplitude
(norm)
amplitude
(norm)
time (ns)
time (ns)
Figure 15: Results with a baseband signal directly
connected to the receiver.
2 4 6 8 10 12 14 16
-0.3
-0.2
-0.1
0
0.1
0.2
2 4 6 8 10 12 14 16
-0.2
0
0.2
0 5 10 15 20 25 30
-0.2
-0.1
0
0.1
0.2
0.3
amplitude
(norm)
correlation time (ns)
amplitude
(norm)
amplitude
(norm)
time (ns)
time (ns)
Corr. Max = 0.2329
Figure 16: Results with a 4 GHz signal directly connected
to the receiver.
4.3.3 Configuration with Wireless Channel
Figure 17 shows the results obtained for a baseband
signal transmitted using a pair of monopole antennas
separated by 40 cms between them. When the pulses
are present in the TDSC circuit registers, the
maximum correlation value is around 0.21.
Figure 18 shows the results for the transmission
of a baseband signal whose transmitting point is
located at a distance of one meter from the receiver.
In this case the value that shows that the two pulses
were detected is between 0.14 and 0.135.
In order to allow comparison between the maximum
correlation values, figure 19 shows the results
according to a signal without transmitted pulses,
while figure 20 shows the case with only one
baseband pulse transmitted at 40 cms. The first case
gives a correlation value of 0.0093, while in the
second case the value obtained is 0.022, both values
WINSYS 2011 - International Conference on Wireless Information Networks and Systems
92
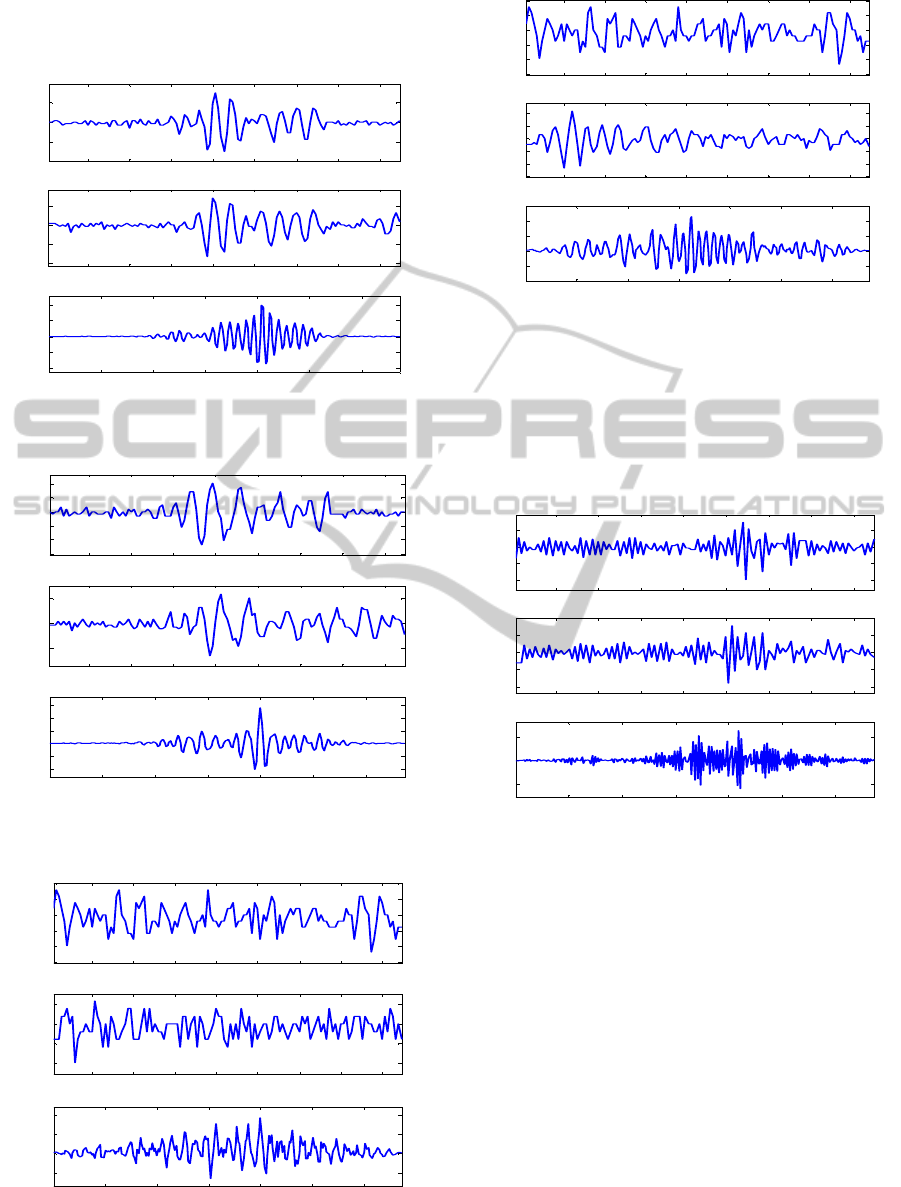
are far enough of the value corresponding to the
detection of the two pulses at the same distance,
around 0.21 as previously stated.
amplitude
(norm)
correlation time (ns)
amplitude
(norm)
amplitude
(norm)
time (ns)
time (ns)
2 4 6 8 10 12 14 16
-0.1
0
0.1
2 4 6 8 10 12 14 16
-0.2
-0.1
0
0.1
0 5 10 15 20 25 30
-0.2
-0.1
0
0.1
0.2
Corr. Max = 0.2170
Figure 17: Results with a baseband signal transmitted at
40 cms. with line of sight (LOS).
amplitude
(norm)
correlation time (ns)
amplitude
(norm)
amplitude
(norm)
time (ns)
time (ns)
2 4 6 8 10 12 14 16
-0.15
-0.1
-0.05
0
0.05
0.1
2 4 6 8 10 12 14 16
-0.1
0
0.1
0 5 10 15 20 25 30
-0.1
-0.05
0
0.05
0.1
0.15
Corr. Max = 0.1406
Figure 18: Results with a baseband signal transmitted at
100 cms. with line of sight (LOS).
amplitude
(norm)
correlation time (ns)
amplitude
(norm)
amplitude
(norm)
time (ns)
time (ns)
2 4 6 8 10 12 14 16
-0.06
-0.04
-0.02
0
0.02
0.04
2 4 6 8 10 12 14 16
-0.04
-0.02
0
0.02
0 5 10 15 20 25 30
-5
0
5
10
x 10
-3
Corr. Max = 0.0093
Figure 19: Results without transmitted pulses.
amplitude
(norm)
correlation time (ns)
amplitude
(norm)
amplitude
(norm)
time (ns)
time (ns)
2 4 6 8 10 12 14 16
-0.06
-0.04
-0.02
0
0.02
0.04
2 4 6 8 10 12 14 16
-0.15
-0.1
-0.05
0
0.05
0.1
0 5 10 15 20 25 30
-0.01
0
0.01
0.02
Corr. Max = 0.0226
Figure 20: Results with only one pulse.
The last case shown in figure 21 corresponds to a
pass band signal transmitted at 4 GHz by a pair of
discone antennas. The distance between the
transmitter and the receiver is 40 cms. The pulses
were successfully received for a corresponding
correlation value of about 0.12.
amplitude
(norm)
correlation time (ns)
amplitude
(norm)
amplitude
(norm)
time (ns)
time (ns)
2 4 6 8 10 12 14 16
-0.2
-0.1
0
0.1
2 4 6 8 10 12 14 16
-0.2
-0.1
0
0.1
0 5 10 15 20 25 30
-0.1
0
0.1
Corr. Max = 0.1253
Figure 21: Results with a 4 GHz signal transmitted at 40
cms with line of sight.
These results show that the proposed detection
method can successfully detect TR-UWB signals
through the TDSC CMOS prototype. Good detection
results were obtained for different environments and
distances. Being the detection the base of the
synchronization process, these tests have also
validated the first stage of the synchronization
process.
5 CONCLUSIONS
This paper has presented experimental results that
validate the new TDSC detection method for TR-
UWB systems using real signals.
EXPERIMENTAL VALIDATION FOR TR-UWB SYSTEMS - By Time Delayed Sampling & Correlation (TDSC)
93

Through this work we also improve the
knowledge of the TDSC performance regarding the
T
D
implementation, frequency response, signal
detection through indoor wireless channel.
In order to obtain these results, two test cards
were developed. One is a TR-UWB transmitter
based on discrete components, the second one is the
receiver based on the CMOS TDSC chip and
connected to the computer.
The processing step of the proposed detection
method based on the analog waveforms correlation
was implemented on the computer.
The analog TR-UWB signals were acquired from
a directed connection as well through an indoor
wireless channel to a distance as long as 1 meter as
first step of experimentation.
It was demonstrated that the use of the TDSC
integrated circuit, as the receiving device, allows the
detection of such signals through different
environment or frequency condition (BB or 4 GHz).
That validates also the generation of a precise delay
T
D
in order to detect TR-UWB signals.
From these results the next steps are to study
other transmitting scenarios, for different
environments and also to look forward for the
implementation of the synchronization process into
an autonomous device. This will allow the use of
this platform for purposes of localization, which is
the application subject of interest of the research
team.
REFERENCES
ECMA International (2008). High rate ultra wideband
PHY and MAC standard. ECMA-368, 3
rd
edition.
F. C. C., (2002). Federal Communications Commission.
Revision of part 15 of the commission’s rules
regarding ultra-wideband transmission systems.
Technical report.
Gezici, S., (2008). A survey on wireless position
estimation. Wireless Personal Communications,
44:263–282, 2008. 10.1007/s11277-007-9375-z.
Gezici, S. and Tian, Zhi and Giannakis, G. B. and
Kobayashi, H. and Molisch, A. F. and Poor, H. V. and
Sahinoglu, Z., (2005, July). Localization via ultra-
wideband radios: a look at positioning aspects for
future sensor networks. Signal Processing Magazine,
IEEE, 22(4):70 – 84.
Hirata-Flores, F. I. and Muller, M. and Ni, Yang and
Gimenes, C., (2008). CMOS Implementation of a TR-
UWB Receiver Based on Time Delayed Sampling and
Correlation Method. Wireless Conference, 2008. EW
2008. 14th European 22-25 , Prague.
Hirata-Flores, F. I., (2008). Design and Implementation of
a CMOS Prototype for a TDSC-UWB Receiver Based
on TR Detection Scheme. PH.D 2008, Telecom
SudParis, France.
IEEE. (2007). IEEE Std 802.15.4a™-2007. IEEE standard
for information technology - telecommunications and
information exchange between systems - local and
metropolitan area networks - specific requirement part
15.4: Wireless medium access control (mac) and
physical layer (phy) specifications for low-rate
wireless personal area networks (wpans).
Jofre, L. and Broquetas, A. and Romeu, J. and Blanch, S.
and Toda, A. P. and Fabregas, X. and Cardama, A.,
(2009) UWB tomographic radar imaging of
penetrable and impenetrable objects. Proceedings of
the IEEE, 97(2):451 –464.
Molisch, A. F. and Cassioli, D. and Chong, Chia-Chin and
Emami, S. Fort, A. and Kannan, B. and Karedal, J. and
Kunisch, J. and Schantz, H. G. and Siwiak, K. and
Win, M. Z., (2006). A comprehensive standardized
model for ultrawideband propagation channels.
Antennas and Propagation, IEEE Transactions on,
54(11):3151 –3166.
Muller, M. and Ni Y. and Lamberti R. and Hirata-Flores
F. I. and Saber, C., (2007). Fully CMOS Low Power
Low Complexity Detection Method For TR-UWB;
FTFC 2007 Paris.
Muller, M. and Ni, Y. and Lamberti, R. and Saber, Ch.,
(2008) A new signal detection method for tr-uwb: By
time delayed sampling and correlation (tdsc). In
Joaquim Filipe and Mohammad S. Obaidat, editors, E-
Business and Telecommunication Networks, volume 9
of Communications in Computer and Information
Science, pages 301–311. Springer Berlin Heidelberg.
Saber, Ch., (2008). Ultra Large Bande Radio par
Impulsions. Contributions à la Définition du Récepteur
TDSC. Relation à la filière technologique. PH. D
2008. Telecom SudParis, France.
Saber, Ch. and Lamberti, R. and Gimenes, C., (2008).
Synchronization solution for the tdsc-uwb detection
method. In Tarek Sobh, Khaled Elleithy, Ausif
Mahmood, and Mohammad A. Karim, editors, Novel
Algorithms and Techniques In Telecommunications,
Automation and Industrial Electronics, pages 311–
316. Springer Netherlands, 2008. 10.1007/978-1-
4020-8737-0_56.
WINSYS 2011 - International Conference on Wireless Information Networks and Systems
94
