
MEASURING THE BUFFER OCCUPATION OF SAP ERP
SYSTEM APPLICATIONS
Stephan Gradl, Manuel Mayer, Alexandru Danciu, Ramón Escrihuela,
Holger Wittges and Helmut Krcmar
Technische Universitaet Muenchen, Boltzmannstrasse 3, 85748 Garching, Germany
Keywords: ERP, SAP, Performance, Load Test, Measurement, Analysis.
Abstract: Enterprise resource planning (ERP) systems form the backbone for the execution, controlling and
management of business processes in today’s large companies. Availability and performance of ERP
systems is extraordinary critical for a company as even short unavailability or reduced throughput can be
very costly. As companies are evolving, the number of applications and the kinds of applications that have
to be supported are rising, which inherently also increases performance needs. However, the determination
of what makes up the performance needs is critical. The performance of SAP ERP systems strongly depends
on the usage of buffers for caching database contents. In order to predict the performance of SAP ERP
systems, it is necessary to understand and measure the buffer usage of applications running on SAP ERP
systems. In this work we explain the basic concepts and introduce a method for measuring the buffer usage
of SAP ERP applications. This method will be illustrated by a case study where each step of a business
process, executed on a SAP ERP system, will be analyzed according to the memory usage.
1 INTRODUCTION
The performance of an enterprise resource planning
(ERP) system is a business critical, non-functional
requirement (Schneider 2008).
In particular, we focus on the performance
analysis of a SAP Enterprise Resource Planning
(SAP ERP, formerly SAP R/3) system. Such
information systems are vital for companies business
processes (Krcmar 2009). SAP ERP is an integrated
backend application with tens of thousands of
installations worldwide, designed for tracking and
managing business processes in midsize and large
enterprises. From a technical perspective, this
application is built on top of a software integration
platform that provides primitives to control the
concurrency offered by application server and
database server.
The performance of these applications depends
on the resource used by the software integration
platform and the resource passed to the application.
A crucial part of these applications are the
implemented buffering techniques, as they allow the
processes to access data up to two orders of
magnitude faster than fetching the data from disks.
ERP systems are transaction based systems with a
high number of database accesses. This is reflected
by the fact that in average the time used for database
accesses takes up to one third of the overall
processing time. Therefore it is important to
understand the usage concepts and to be able to
measure the needed amount of resources in the
buffers. Without enough resources in the buffers, the
overall system, and the implemented business
processes are significantly slowed down.
The aim of this work is to illustrate the buffer
concept of SAP ERP Systems and to introduce a
method for measuring the resource demands of SAP
ERP applications in these buffers..
2 RELATED WORK
The key literature about performance measurement
and analysis of (enterprise) software systems are the
books of Jain (1991) and Lilja (2000). These authors
describe elaborately the whole process of
performance measurement, pointing out what
performance is, how it is measured, and which
factors affect the performance of a software system.
266
Gradl S., Mayer M., Danciu A., Escrihuela R., Wittges H. and Krcmar H..
MEASURING THE BUFFER OCCUPATION OF SAP ERP SYSTEM APPLICATIONS.
DOI: 10.5220/0003502302660272
In Proceedings of the 13th International Conference on Enterprise Information Systems (ICEIS-2011), pages 266-272
ISBN: 978-989-8425-55-3
Copyright
c
2011 SCITEPRESS (Science and Technology Publications, Lda.)
We are basing our work on the definitions made in
these books, and adopt them to the fields of ERP.
The importance of performance analysis is pointed
out by Menacé in his paper “Software, Performance,
or Engineering?” (Menasce & Almeida 2002). An
overview of the factors that determine the
performance of an application is given by (Bailey &
Snavely 2005) and (Hollingsworth et al. 2005). For
the performance of an ERP system, we refer to
(Schneider-Neureither 2004). In this book, the
author explains in detail the effect of the SAP
architecture and configuration on its performance,
focusing on the solution of concrete operational
problems. Although the book is written as an
administrator manual, it provides a good overview
of the factors affecting the SAP system´s
performance. An overview of existing SAP
benchmarks is given in (Prior 2003). The usage of
SAP trances is also mentioned in the work of (Schult
& Kassem 2008). Here, the traces are utilized for
system analysis to create recommendations for
automatic customization of a SAP system.
A scientific approach for the measurement of
ERP performance behaviour – in this case focusing
on the effects of virtualization – is presented by
(Jehle 2009) and (Bögelsack et al. 2010). While
Jehle (2009) is focusing on the response time
behaviour using a load test, (Bögelsack et al. 2008)
is analyzing systems´ internal patters, especially the
CPU time, for interpreting its effect on the system
performance.
Jin (2007) shows a method for performance
prediction of legacy information systems. As the
internal architecture of the investigated productive
information system is not known, the authors used a
method that is based on a black box approach for
predicting the technical performance of this legacy
information system with historical values. This
approach combines benchmarking, production
system monitoring, and performance modelling
(BMM). By analyzing and correlating the
performance values derived from the benchmarks
and monitoring, a model is created that is used for
the performance prediction.
In (Rolia et al. 2009), a LQM model for the
performance prediction of SAP ERP system is
introduced. In this approach the statistical records
provided by the SAP system are used for
performance analysis and prediction. In addition, the
authors also used CPU values gathered from an SAP
tool called saposcol. The workload used is based on
a sales and distribution scenario, very similar to the
workload that is applied in the SAP Sales and
Distribution benchmark. Buffers, both from the
application servers and the database, are not
mentioned in this work.
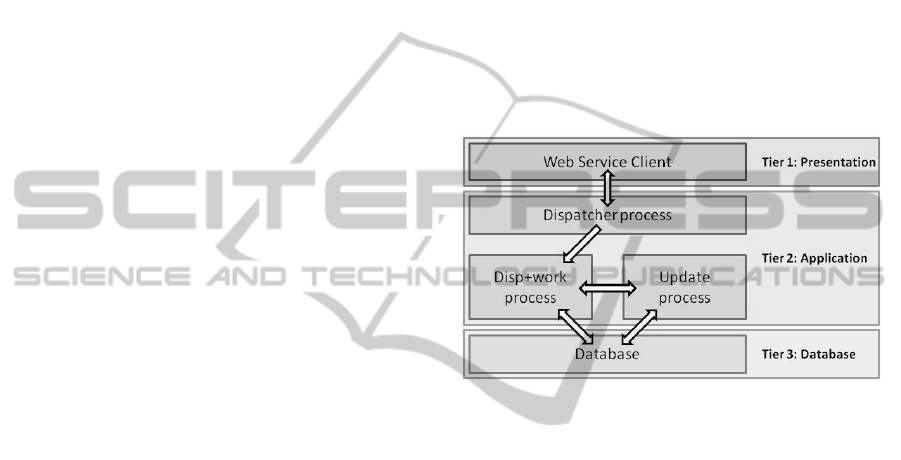
3 SYSTEM ARCHITECTURE
To provide an understanding of the ERP system
architecture, in the later referred to as SAP WebAS,
shown in Figure 1, we derive the system components
from the ERP process step-by-step by analyzing the
recorded trace and the abstraction of the trace
entries. These components are described in detail in
(Schneider 2008). The process step of calling a
program involves many components of the SAP
system.
Figure 1: Schematic architecture of SAP WebAS.
Searching for the program includes access to
internal buffers as well as access to the database
tables. This access is made by the so called
disp+work processes of the SAP system. Such
processes are responsible for executing programs,
processing user or web service requests, and
accessing the database. Before a request is
associated to one of the disp+work processes of the
SAP system, a dispatcher process is accessed. The
dispatcher process manages all other processes in the
SAP system, and his primary task is to assign a user
request to a free disp+work process. In our model,
we assume the database as a black box.
After the SAP system got the information which
program has to be executed, it loads a compiled
version of the program from the database and
executes it. Sometimes such compiled programs are
held in the internal buffers of the SAP system to
avoid database accesses.
After the request is processed, the data should be
saved to the database. This is done by the disp+work
process(es) together with a process called update
process. This process receives data and stores it in
corresponding database tables.
MEASURING THE BUFFER OCCUPATION OF SAP ERP SYSTEM APPLICATIONS
267

Simultaneously, a lock on a central table is
established, which may be described as a small
repository of all available material master records
(MMR) within the system. This lock is not set by the
disp+work process itself; it triggers a so-called
enqueue process. The only task of the enqueue
process is to set locks on any tables in the SAP
system, and to manage such locks. After the lock
was set successfully, the disp+work process can
store the data into the central MMR repository.
4 BUFFER CONCEPTS
Each SAP instance or application server has its own
buffers. SAP buffers occupy memory areas that are
local to the work process, and in individual shared
memory segments that can be accessed by all work
processes. These memory areas are executed for the
application server. SAP buffers store frequently-
used data, and make this data available to the local
application server instance. This helps to reduce the
number of database accesses, the load on the
database server, and network traffic. As a result,
system performance is considerably improved. The
data that is buffered includes ABAP programs and
screens, ABAP Dictionary data, and company-
specific data. Typically, these remain unchanged
during system operation. The sizes of buffers can be
changed or tuned to optimize performance for a
particular hardware and workload configuration.
There are several ways to tune buffers.
To support the performance of the SAP WebAS,
there are a number of buffers that can be classified
in seven groups: Repository Buffers, Table Buffers,
Program Buffer, SAP GUI Buffers, Roll and Paging
Buffers, SAP Calendar Buffer and SAP Cursor
Cache. As the SAP WebAS initially contains only
the complete source code of all the available
applications, they are compiled at the first access.
The compiled code is permanently stored in the
database and in the the Program Buffer. Active table
and field definitions, the ABAP code runs on, are
stored in the Repository Buffers. This group consists
of four buffers for the different to deliver
information of tables and fields for different use
cases. To support the presentation of the data using
the SAPGui, the SAP WebAS holds generated
screens, menus and push-button definitions in the
SAP Gui Buffers . The SAP WebAS shares his work
processes to all the users on the system. Therefore
after finishing a user request the memory context of
the specific user session has to be stored outside the
work process. To have the user session information
available this data is held in the Roll and Paing
Buffers. As an extension to these buffer there are the
Export/Import Buffers and the Export/Import Shared
Memory. The Calendar Buffer is mentioned to have
different kinds of calenders, defining holidays and
other free days available for the work processes. The
number of parsing procedures for SQL statements is
reduce by storing relevant information in the SAP
Cursor Cache.
5 MEASURING BUFFER
RESOURCES IN SAP WEBAS
5.1 Measurement Tool
The SAP WebAs provides a large number of
measurement tools for performance monitoring and
analysis. The gui of these tools are implemented as
SAP transactions and therefore not suitable test
series. To execute an automated test series, the web
service SAPTUNE_GET_SUMMARY_STATISTICS
was used. This web service delivers detailed
information about the current state of SAP WebAS
buffers, as exemplarily shown in table 1.
In SAP, the size of the buffers is defined in
kilobytes and number of entries. A buffer can be
therefore full, although there is space left, by
reaching the limit of entries. When the SAP WebAS
is started, the buffers are initialized with their full
size by allocating the needed amount of memory.
The web service delivers the currently amount of
memory that is used in the different buffers
(Used[KB]), the hitratio, the overall (allocated) size
of the buffer (Alloc[KB]), the percentaged free
space (Freespace[%]), the number of entries
(DirSize), the percentaged number of free entries
(FreeDir[%]), the number of replaced entries
(Swaps), and the number of Database accesses
needed to fill the buffer (Schneider 2008). The
hitratio is defined using formula 1:
=
− ℎ
∗ 100
(1)
For the management of the buffer some memory
is needed, which is the reason for the difference
shown in formula 2:
+
≠
(2)
Although the data is not accessed using the SAP
Gui, the execution of the webservice request does
also use the buffer infrastructure of the SAP WebAS
and therefore creates a certain amount of buffer
entries. This bias has to be overcome by adapting the
ICEIS 2011 - 13th International Conference on Enterprise Information Systems
268
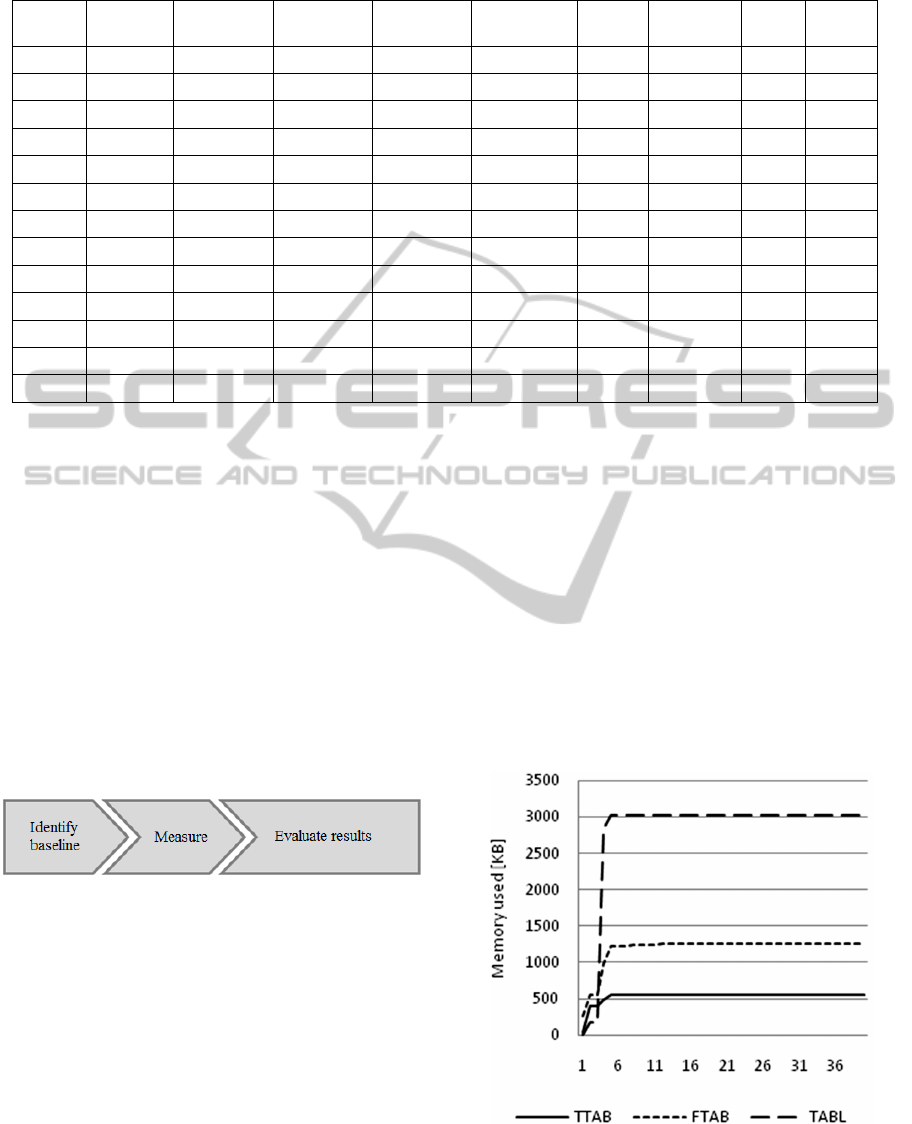
Table 1: Delivered values by SAPTUNE_GET_SUMMARY_STATISTICS.
Buffer
Used
[KB]
Hitratio [%] Alloc [KB]
Freesp
[KB]
Freespace
[%]
Dir
Size
FreeDir
[%]
Swaps
DB
Accs
TTAB 486 95,3646 6797 5214 91,47369 19990 91,47073 0 59536
FTAB 984 97,4883 31564 29018 96,720215 19990 98,554276 5246 20450
SNTAB 16 97,8395 3625 2984 99,46667 4997 98,81929 0 3795
IRBD 196 44,2553 6625 5804 96,73333 4997 94,576744 672 17484
TABL 2835 99,2928 29297 24888 89,773834 5000 99,04 45 116574
TABLP 101 86,4173 10000 9711 98,97064 500 97 5 130183
PXA 278248 99,0965 300000 72 0,025868416 75000 91,305336 12595 117483
CUA 78 99,5748 3000 2309 96,7323 1500 99,73334 0 116
PRES 15 99,6205 4297 4078 99,63352 2000 99,55 0 177
CALE 211 100 488 267 55,857742 200 49 0 1020
EIBUF 9 91,0683 4096 3272 99,72569 2000 99,95 0 0
OTR 0 100 4096 3281 100 2000 100 0 0
ESM 0 99,5268 4096 3281 100 2000 100 0 0
measurement approach as introduced in the
following chapter.
5.2 Measurement Approach
The memory consumption in the SAP Buffers
strongly depends on the workload the system has to
process. Therefore, the analysis has to be oriented to
the workload in order to capture all its impacts.
As the selected measurement tool is executed
using the buffer infrastructure of the SAP WebAS,
these measurements are intrusive and therefore
biased. For a significant measurement, the impact
baseline of this measurement tool has to be
identified and taken into account within the analysis.
Figure 2: Approach for measuring occupancy level of SAP
WebAS buffers.
To identify the baseline resource consumption by
the measurement tool, SAP buffers have to be
cleared. Within the whole process shown in Figure 2
it has to be guaranteed that no other workload by
users or scheduled background processes are
executed on the SAP system. To clear the buffers the
SAP function $SYNC was used, as “this resets all
buffers of the application server” (SAP 2009). To
identify the baseline for the measurement, the
resources in the buffer consumed by the
measurement tool have to be measured. This is done
by executing the SAPTUNE_GET_SUMMARY_-
STATISTICS web service several times.
Doing this, it turned out that the mentioned
amount of memory for the management of the buffer
does not only minimize the available space in the
buffer. This management information is created
when the buffer is accessed. To avoid a large
number of buffer synchronizations in the SAP
WebAs, there is a number of requests that are
always answered by the database directly after a
buffer is refreshed. The combination of these two
aspects of the buffer management in the SAP
WebAS is shown in Figure 3 using the example of
the table buffers:
Figure 3: Buffer occupation of measurement tool.
Depending on the access rate of the different
table buffers, it takes some iterations (x-axis) until
MEASURING THE BUFFER OCCUPATION OF SAP ERP SYSTEM APPLICATIONS
269
the buffers are used and the management
information is created. This effect has to be taken
into account when measuring the resources used in
the buffers of applications. Without doing this, the
mean of the measurement values suffers a significant
standard deviation as shown in table 2.
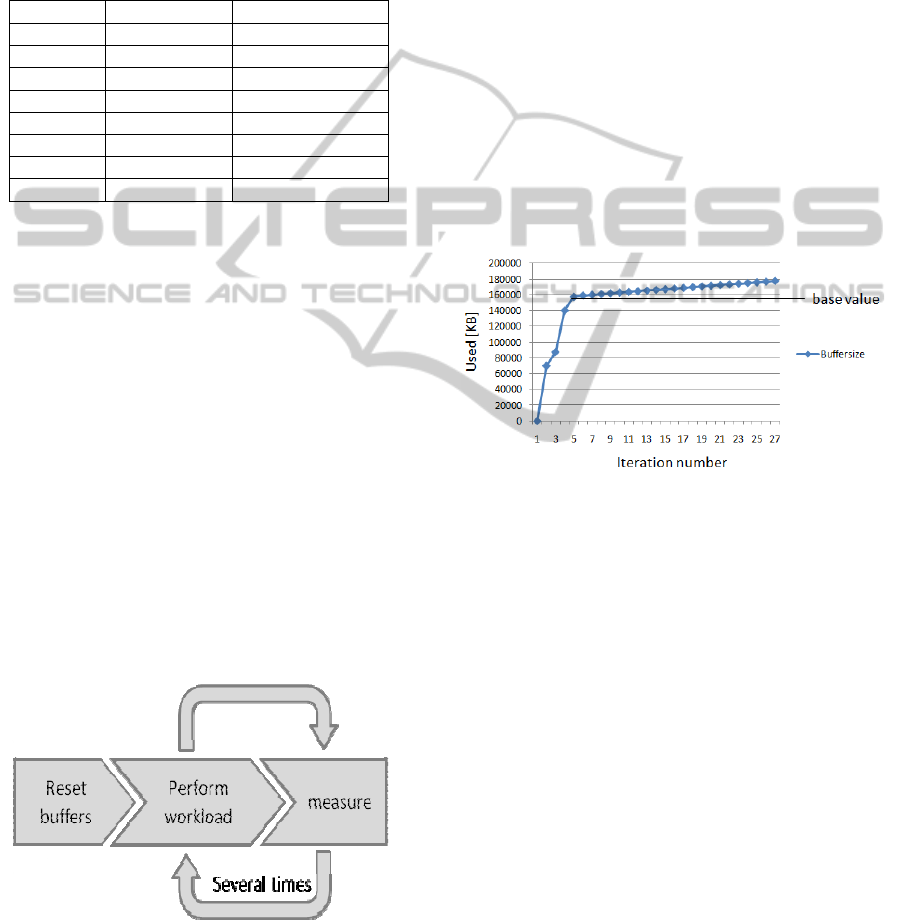
Table 2: Baseline values of SAPTUNE_GET_-
SUMMARY_STATISTICS without warm-up phase.
Buffer MEAN STD.DEV
TTAB 3622,15 20,61240046
FTAB 26161,1 2306,299152
SNTAB 272,75 2,953588362
IRBD 1898,2 32,60222789
TABL 27628,95 3,605186323
TABLP 991,5 27,0972906
PXA 277185,55 444,9519755
PRES 116,35 3,013565819
Taking into account only the values after the
buffer is completely initialized, the values in our test
series are constant showing no deviation (Figure 3).
With these criteria, these values can be taken as the
baseline for the measurement of the resources a
workload consumes in the buffers.
5.2.1 Measurement
The measurement follows the same principles as the
identification of the baseline using the web service
SAPTUNE_GET_SUMMARY_STATISTICS. As
shown in Figure 4, the effects of previous workloads
are eliminated by refreshing the buffers using the
OK-Code /$SYNC (SAP 2009). To eliminate the
already described aspects of the SAP WebAS buffer
management, the workload has to be executed
several times to secure that the buffer has been
completely initialized and used within the workload
to be measured as shown in Figure 4.
Figure 4: Process for measuring workload buffer
occupation level.
As the workload can produce data in the
database, the amount of space used in the buffers
can constantly rise. The influence of this aspect is
generally rather small as the SAP WebAS does not
buffer tables if more than 1% of database accesse are
modifying the content (SAP 2007). If the occupancy
level of the buffers is constant or rises constantly,
the workload measure cycle can be stopped, as the
mentioned aspects of SAP WebAS buffer
management are eliminated.
5.2.2 Evaluate Results
In the measurement cycle, the workload and the
measurement tool have been executed several times.
Therefore, the buffers are filled with both the data of
the workload and the data of the measurement tool,
as shown exemplarily in Figure 5. In order to get
significant results, the values of the measurement
tool (introduced as baseline in this chapter) have to
be subtracted from the measured values of the
workload measurement step.
Figure 5: Identifying base value of exemplary workload
buffer occupation level.
The base value shows the minimum occupancy
level of the respective buffer. If the buffer
occupancy shows a constant expansion, then the
difference between two measurement actions is
referred to as expansion rate. To reliably evaluate
the amount of memory a certain workload occupies
in the buffer, the following formula can be used:
=
+
∗
(3)
The method does not depend on the specific
workload, as every program executed by the SAP
ERP system uses a subset of the buffers. The buffer
requests are not triggered by the program itself. The
SAP System provides an abstraction layer between
the program and the database that decides if the data
is fetched from the buffer or from the database.
ICEIS 2011 - 13th International Conference on Enterprise Information Systems
270
6 CASE STUDY
A main task of ERP systems is the management and
monitoring of business processes. In our case study
we look into an exemplary production planning
process, since it demands many core functionalities
like master data management or work organization.
6.1 Explanation of the Case Study
The workload is based on a SAP University
Competence Center (Weidner 2006) case study and
includes the creation of material master data, bills of
materials, and routing (work processing sheets) for a
motorcycle, consisting of the engine, cylinder block,
cam shaft, and the chassis. For the semi finished
product, the engine, and the finished product, the
motorcycle, bills of materials and work processing
sheets are defined. These work steps - and
consequently the whole business process - are core
business processes and frequently used in business.
The underlying ERP System was a SAP ECC
6.00 system with the IDES dataset running on
application- and database server with Sun Solaris 10.
6.2 Measurement
Following the introduce method (chapter 6), the
measurement started by resetting the SAP Buffers
using the OK-Code /$SYNC. The result of the
baseline identification is shown in Figure 3. In our
test scenarios we identified a constant baseline.
After another reset of the buffers, the workload,
consisting of the already described business process
followed by the measurement web service
SAPTUNE_GET_SUMMARY_STATISTICS, was
executed 35 times. Figure 6 shows that in the
laboratory experiment the base value was reached
after 5 executions (x-axis) of the business process
and the measurement web service.
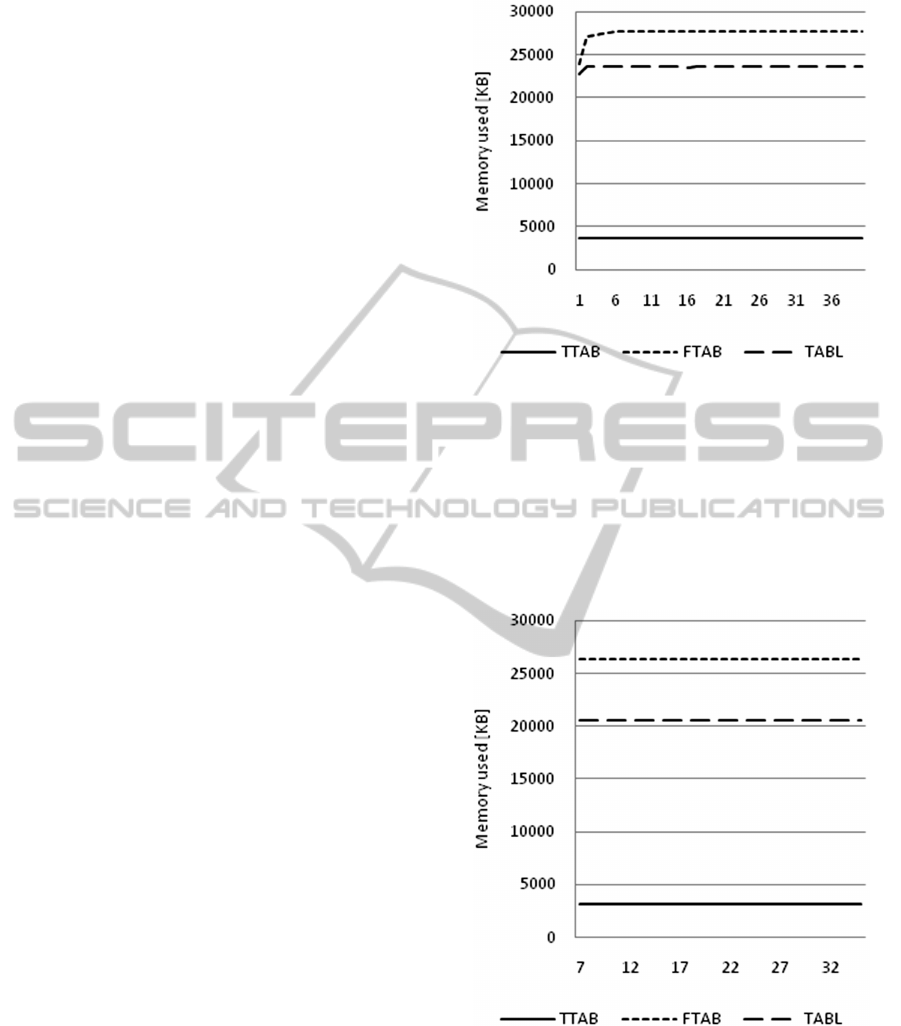
6.3 Measurement Results
The measurement tool provides the analysis of all
buffers in the SAP WebAS. In the following we
focus on the table buffers TTAB, FTAB and TABL
due to their bigger relevance. The behaviour of the
other buffers was similar to the ones displayed in the
following graphs.
The measured results of the buffer occupation
under the defined workload, as shown in table 3, had
a significant deviation from the arithmetic mean, as
the base value was not taken into account. Applying
the introduced method, the values obtained were
Figure 6: Buffer occupation level of workload and
measurement tool.
constant, showing no deviation from the mean.
Figure 7 shows the corresponding result. From the
measurement values shown in Figure 6 only the
values after the base value were taken into account.
By substracting the base line from these values we
obtained our final measurement results, shown in
Figure 7.
Figure 7: Buffer occupation level of business process
without measurement tool.
This graph shows that we were able to receive
constant and therefore significant values for the
buffer occupation under the defined workload.
MEASURING THE BUFFER OCCUPATION OF SAP ERP SYSTEM APPLICATIONS
271

7 CONCLUSIONS AND FUTURE
RESEARCH
In this paper we introduced a method for measuring
the buffer usage of SAP ERP systems and proved
the technical feasibility of this method by a case
study. Understanding the resource demands of each
application running on the system is crucial for
maintaining a high-performance system.
The proposed method implies the access to the
SAP ERP graphical user interface for resetting the
buffers. Therefore, the method cannot be fully
automated using technologies like web services.
The measurements have shown that the buffer
usage passes a transient phase for several databse
accesses after the system is started.
Further research is required for understanding the
results of the introduced method. Currently, the
method only considers the occupancy level of
buffers. In a next step, the content of these buffers
should be considered as well. The strategy of
replacing buffered content should be analysed as
well.
REFERENCES
Bailey, D. H. and Snavely, A. (2005). Performance
Modeling: Understanding The Present And Predicting
The Future. In EURO-PAR 2005 Parallel Processing,
vol. 3648/2005 SPRINGER, Berlin/Heidelberg, P.
185-195.
Bögelsack, A., Jehle, H., Wittges, H., Schmidl, J. and
Krcmar, H. (2008). An Approach To Simulate
Enterprise Resource Planning Systems. In 6TH
International Workshop On Modelling, Simulation,
Verification And Validation Of Enterprise Information
Systems, Msvveis-2008, In Conjunction With ICEIS
2008 (eds, ultes-nitsche, u., moldt, d. And augusto, j.
C.) INSTICC Press, Barcelona, Spain, P. 160-169.
Bögelsack, A., Wittges, H. and Krcmar, H. (2010).
Scalability And Performance Of A Virtualized Sap
System. In Proceedings Of The Proceedings Of The
Sixteenth Americas Conference On Information
Systems p. Lima, peru.
Hollingsworth, J. K., Snavely, A., Sbaraglia, S. and
Ekanadham, K. (2005). EMPS: An Environment For
Memory Performance Studies. In Proceedings Of The
19th Ieee International Parallel And Distributed
Processing Symposium (IPDPS'05) - Workshop 10 -
Volume 11IEEE Computer Society, P. 223.2.
Jain, R. (1991). The Art Of Computer Systems
Performance Analysis. Edition, WILEY, New York.
Jehle, H. (2009). Performance-Messung Eines
Portalsystems In Virtualisierter Umgebung Am
Fallbeispiel SAP. In CVLBA WORKSHOP 2009. 3.
Workshop des Centers For Very Large Business
Applications (cvlba) Arndt, H.-K.; Krcmar, h.,
Magdeburg, Deutschland.
Jin, Y., Tang, A., Han, J. and Liu, Y. (2007). Performance
Evaluation And Prediction For Legacy Information
Systems. ICSE´07IEEE, Minneapolis.
Krcmar, H. (2009). Informationsmanagement. Edition,
Springer-Verlag New York, Inc.
Lilja, D. J. (2000). Measuring Computer Performance - A
Practitioner's Guide. Edition, Cambridge University
Press.
Menasce, D. A. and Almeida, V. A. F. (2002). Capacity
Planning For Web Services: Metrics, Models, And
Methods. Prentice Hall, Upper Saddle River, NJ,
Upper Saddle River, NJ.
Prior, D. (2003). Who sets the pace in the sap performance
'olympics'? Gartner, 6.
Rolia, J., Casale, G., Krishnamurthy, D., Dawson, S. and
Kraft, S. (2009). Predictive Modelling Of Sap Erp
Applications: Challenges And Solutions. Proceedings
Of The Fourth International Conference On
Performance Evaluation Methodologies And Toolsicst,
Pisa, Italy, P. 1-9.
SAP (2007). Which Tables Should Be Buffered?, http://
help.sap.com/saphelp_nw04/helpdata/en/cf/21f26b446
011d189700000e8322d00/content.htm (last accessed
on 10.02.2011).
SAP (2009). note 26171 - Possible Entry Values For
Command Field ("Ok-Code"), https://websmp130.sap-
ag.de/sap/bc/bsp/spn/sapnotes/index2.htm?numm=261
71
(last accessed on 10.02.2011).
Schneider-Neureither, A. (2004). Optimierung Von Sap-
Systemlandschaften. 1. Edition, Galileo Press, Bonn.
Schneider, T. (2008). Sap-Performanceoptimierung. 5
Edition, Galileo Press, Bonn.
Schult, R. and Kassem, G. (2008). Self-Adaptive
Customizing With Data Mining Methods - A Concept
For The Automatic Customizing Of An Erp System
With Data Mining Methods. In ICTTA 2008, p. 70-75.
Weidner, S. (2006). Integrations-Fallstudie PP (SAP ECC
5.0), http://www.hcc.in.tum.de/ssi/members/common/
dokumente/hcc_schulungen/hcc_fallstudien/2006-04-
28_50_pp_fallstudie.pdf (last accessed on 2010-06-
14).
ICEIS 2011 - 13th International Conference on Enterprise Information Systems
272
