
COMPUTER-AIDED DATA-MART DESIGN
Fatma Abdelhédi, Geneviève Pujolle, Olivier Teste and Gilles Zurfluh
University Toulouse 1 Capitole– IRIT (UMR 5505), 118, Route de Narbonne
31062 Toulouse cedex 9, France
Keywords: Multidimensional model, Design process, Data-mart, Decision-makers’ requirements, Data-source.
Abstract: With decision support systems, decision-makers analyse data in data marts extracted from production bases.
The data-mart schema design is generally performed by expert designers (administrator or computer
specialist). With data-driven, requirement-driven or hybrid-driven approaches, this designer builds a data-
mart defining facts (analysis subjects) and analysis axes. This process, based on data sources and decision-
makers requirements, often turns out to be approximate and complex. We propose to design a data-mart
schema by the decision-maker himself, following a hybrid-driven approach. Using an assistance process that
visualises successively intermediate schemas built from data sources, the decision-maker gradually builds
his multidimensional schema. He determines measures to be analysed, dimensions hierarchies within
dimensions. A CASE tool based on this concept has been developed.
1 INTRODUCTION
Data-warehouses are multidimensional data-bases
which ease the decision-making process. A data-
mart is an extract from a data-warehouse meant for a
decision-maker or a class of decision-makers. Data-
mart design has been the attention of numerous
works in the recent years. The works are based
either on data-driven approaches starting from data
sources (Golfarelli et al. 1998) or on requirement-
driven approaches starting from decision-markers’
requirements (Romero & Abelló 2010). However,
we consider that most solutions turn out to be a
complex task and often inefficient. Indeed, designers
can produce useless data-mart schemas or unsuitable
for real analysis needs (data-driven approach) or
render complex the correspondence between data-
sources and data-marts (requirement-driven
approaches). Our work is based on a hybrid
approach where the decision-makers needs are
expressed from data-sources (Giorgini et al. 2005),
(Romero & Abelló 2010). They aim at elaborating
data-mart schemas by confronting decision-making
needs with data-sources.
Each decision maker (or class of decision-
makers) must have a data-mart adapted to his needs.
However, a particularity of decision-makers
requirements is their rapid evolution (Elzbieta
Malinowski & Esteban Zimányi 2008) ; the analysis
performed need to frequently adapt the studied
measures as well as the analysis axes according to
external constraints (market evolution, competition
adaptation, etc).
Thus, our problem consists in defining a semi-
automatic and incremental process allowing a
decision-maker to elaborate himself a data-mart
schema integrating, step by step, his requirements
from his available data sources.
In section 2, we present our work context.
Sections 3 and 4 are devoted to detailed presentation
of the process that we propose. The section 5
describes the implementation of our process in a
CASE tool.
2 RELATED WORK
Numerous works have provided approaches for
deriving multidimensional schemas and are usually
classified in three categories.
Data-driven (also called supply-driven or source-
driven) approaches design the data-mart from a
detailed analysis of the data sources and generate
candidate multidimensional schemas. These
approaches have the drawback of not taking into
account user (decision-makers) requirements
(Golfarelli et al. 1998), (Moody & Kortink 2000). In
(Golfarelli et al. 1998), (Moody & Kortink 2000),
239
Abdelhédi F., Pujolle G., Teste O. and Zurfluh G..
COMPUTER-AIDED DATA-MART DESIGN.
DOI: 10.5220/0003501902390246
In Proceedings of the 13th International Conference on Enterprise Information Systems (ICEIS-2011), pages 239-246
ISBN: 978-989-8425-53-9
Copyright
c
2011 SCITEPRESS (Science and Technology Publications, Lda.)
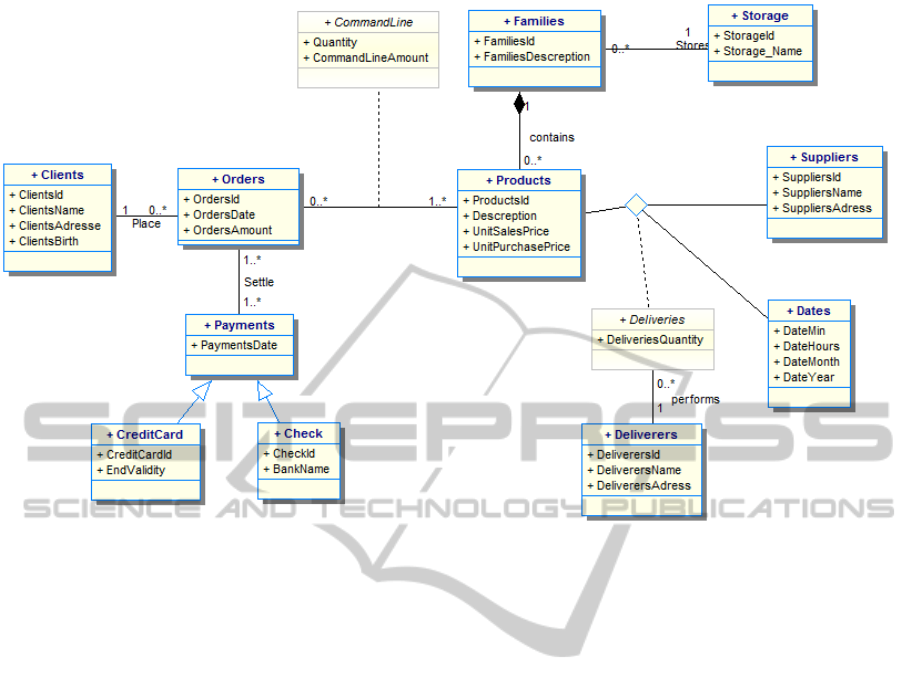
Figure 1: UML Class Diagram of products sales and stock management.
the authors define a semi-automatic method to
generate candidate multidimensional schemas from
Entity/Relationship operational data sources. Then,
the user can choose the most adapted schema.
(Phipps & Davis 2002) propose candidate
conceptual schemas using the Multidimensional
Entity/Relationship (ME/R) model. They propose
also a manual step to refine the resulting schema to
suit additional user needs. (Song et al. 2008)
proposed to generate candidate schemas from
Entity/Relationship schema using a new approach to
automatically detect facts (analysis subjects).
Unfortunately, the output of these approaches is
a set of candidate multidimensional schemas that can
be inadequate for decision-makers requirements.
The final choice of the multidimensional schema
depends on end-users knowledge. In our opinion,
refinement of the final candidate schema could be
taxing, because they can have many irrelevant
multidimensional elements.
Requirement-driven (also called Demand-driven)
approaches focus on determining the decision-maker
analysis requirements without taking into account
data sources. Subsequently, mapping with the data
sources become a complex and tedious task. There is
a risk to have data-mart schemas with no
correspondence with data-source schemas (Trujillo
et al. 2003) and (Prat et al. 2006).
Hybrid-driven approaches are a combination of
data-driven and requirement-driven approaches.
These approaches generate a set of multidimensional
schemas from data sources (data-driven) and a set of
multidimensional schemas from decision-markers
requirements (requirement-driven approach). Then,
experienced designers can match these two types of
schemas to obtain a coherent multidimensional
schema both compatible with data sources and
taking into account decision-makers requirements.
(Pinet & Schneider 2009) propose to generate a
multidimensional schema from a conceptual schema
using UML notations. This approach represents
source classes with a directed acyclic graph. The
user chooses a node from this graph to design a fact.
All connected nodes to this chosen fact represent the
potential dimensions of this fact. However, in our
opinion, this representation of multidimensional
schema is complex. (Romero & Abelló 2010)
present an automated hybrid-driven method. To
generate multidimensional schemas, this method
uses as input decision-makers requirements,
expressed with SQL queries, and relational data
source. As a consequence, constructing
multidimensional schemas requires an expert
(computer specialist) to formalize the SQL queries
and analyse the data sources.
To our knowledge, few works try to allow users to
participate in the process of designing schemas.
But, even if the user knows his requirements he
ICEIS 2011 - 13th International Conference on Enterprise Information Systems
240
obviously faces a double complexity:
- data sources’ organization;
- elaboration process for multidimensional
schemas.
We propose a hybrid-driven approach to assist
the decision-makers in elaborating his
multidimensional schemas himself and its evolution.
3 DATA-SOURCES
AND DECISION-MAKERS’
REQUIREMENTS
The source is a conceptual schema, represented with
a UML class diagram (a widely recognized schema
in the database community). Figure 1 presents the
source schema (our running example). This example
describes products stock and sales.
Decision-makers, who want to analyse data, can
express their requirements in informal terms,
without making reference directly to the data source
schema. For example, it is possible to analyse:
- the number of Orders by Families and
Products;
- the turnover (sum of amounts of orders) by
month and by product;
- the number of orders with a product that has
a sales price between two values.
Requirements are expressed here in natural
language in terms of analysis subjects and analysis
axes. This type of expression is used in the industrial
domain as shown in a field study (Annoni et al.
2006).
4 THE ELABORATION PROCESS
Our work aims at allowing a decision-maker to
elaborate data-mart schemas himself from available
date-sources and his analysis requirements. Our
objective is to eliminate, as much as possible, the
need of an administrator or a computer specialist
who would be responsible for elaborating data-marts
from specifications provided by the decision-maker.
In this paper, we do not address issues related to
multiple sources. Our process is based on a hybrid
approach. It starts from a source schema and
integrates gradually the requirements (in terms facts,
dimensions and hierarchies) for generating a
multidimensional schema.
The Class Diagram (CD), that corresponds to the
source schema is analysed and transformed to make
it useable. Many-to-one associations are kept as they
are. Many-to-many associations become a class
(with no attributes) linked to its related classes.
Association-classes attached to a link become a
standard class linked to each of the related classes.
Composite-aggregation are considered as
associations and treated as such. For generalizations,
the sub-class is separated to generate classes.
Figure 2: Our design process that allows a decision-maker
to build data-mart schema.
The process includes four successive steps; each
step produces a new schema more complete than the
one of the previous step. The last schema
corresponds to the expected data-mart. Thus user
requirements are incrementally added.
The first step
consists in extracting from the
source CD a limited set of candidate facts and
display them in the first of three intermediate
schemas noted IS
1
. The choice of the facts is based
on personalization techniques (see § 4.4).
In IS
1
, the decision-maker chooses the fact that
he wants to analyse from the ones proposed in the
intermediate schemas, he then specifies the required
aggregation functions. He can designate several facts
and thus elaborate a constellation schema.
In a second step
, the system automatically
elaborates the second intermediate schema noted
IS
2
; it proposes all possible dimensions associated
with the chosen fact.
In IS
2
, the decision-maker is able to indicate
dimensions which are the analysis axes according to
which he wishes to analyse the fact.
The third step
generates the third intermediate
schema noted IS
3
presenting the decision maker with
all possible hierarchies for each dimension.
In IS
3
, the decision-maker chooses each
hierarchy that correspond to his needs.
In the final fourth step
of the process, the system
allows elaborating the data-mart schema which
corresponds to the decision-makers’ requirements.
Personalization meta-data will be memorized here.
The interest of this incremental process is in the
meta-data which the system saves progressively.
These meta-data will allow the correspondence
COMPUTER-AIDED DATA-MART DESIGN
241
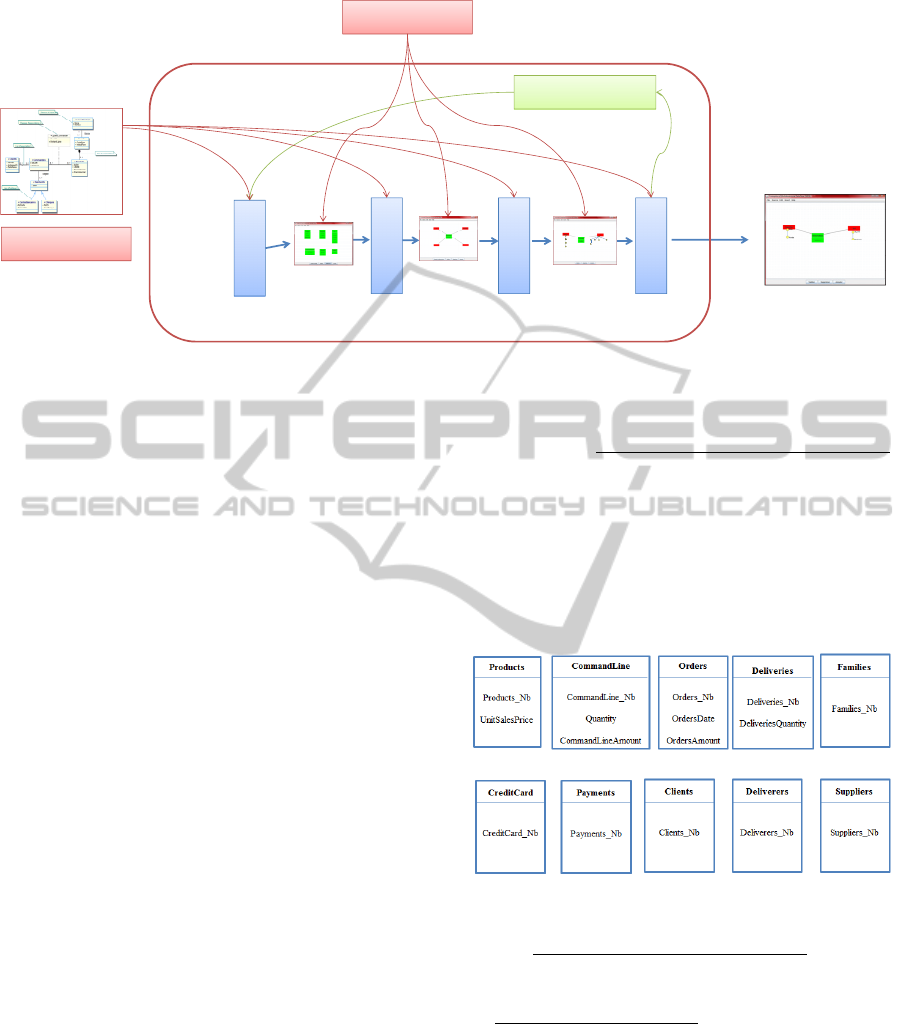
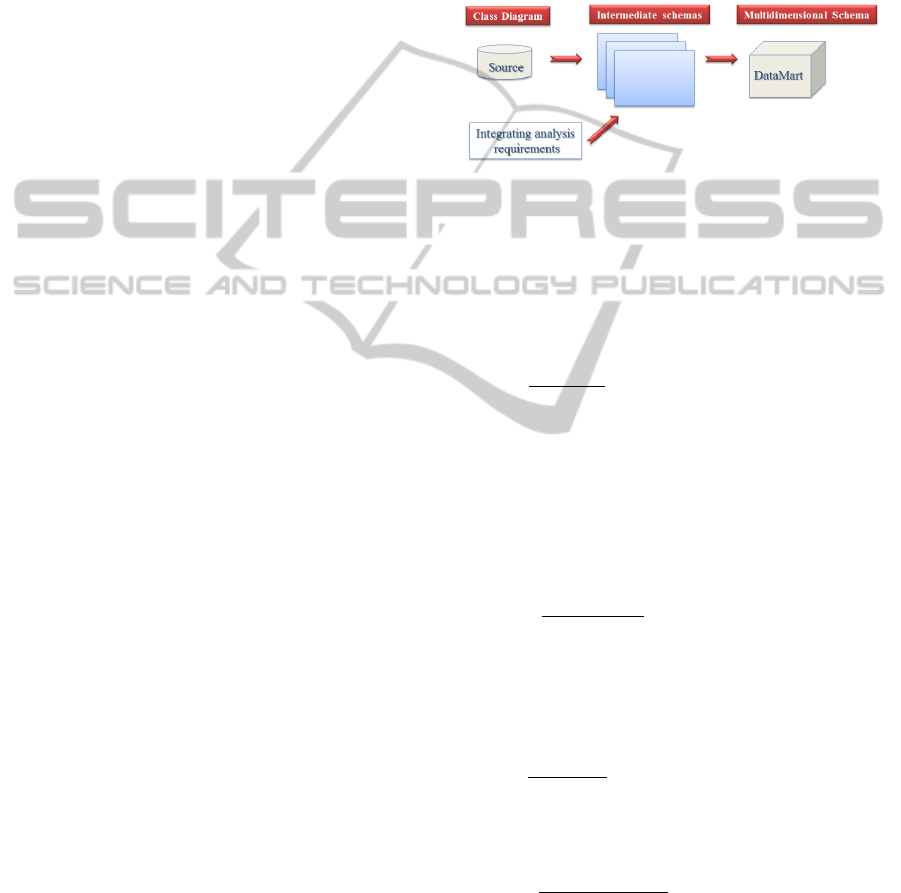
Figure 3: The transformation from data-source and decision makers’ requirements to data-mart schema.
between the data-mart and source, called Extracting,
Transforming and Loading processes (ETL).
4.1 Step 1: Generating Candidate Facts
Industrial experience shows that a data source
(Commercial or production data-base) frequently
contains tens or even hundreds of object classes and
links (Annoni et al. 2006). Thus, on the one hand,
we consider that the decision maker cannot choose
the fact from the source conceptual schema. The
source schema is too difficult to be understood by a
non-computer specialist. On the other hand decision-
makers who analyse in a recurring way a source use
similar schemas (similar measures and dimensions).
Therefore, we choose to show to the decision-maker
a representative sub-set of source schema through an
intermediate schemas noted IS
1
. From any source
modelled by a UML Class Diagram (CD), the sub-
set of classes taken from the CD is a set of classes
that are likely to be analysed by a decision-maker
(candidate facts). This is based on personalization
techniques using meta-data (see § 4.4). The IS
1
thus
contains candidate facts extracted from sources and
which correspond to representative source classes
that are frequently analysed by the decision-maker.
We consider that the IS
1
should not contain more
than 10 candidate facts. The objective is to show in
IS
1
, candidate facts that correspond to classes in the
sources that have most frequently been analysed
since the decision maker has been working on this
source. Personalization meta-data are saved during
the step 4. For a given decision-maker, these meta-
data associate a weight (weight attribute) to each
source class. Thus, it is easy to extract 10 classes
having the highest weights: the personalization
classes.
Notations: Transformed schema from source,
noted CD, is defined by a set of n classes and set of
p many-to-one associations between classes : CD =
(C, L) with C = {c
1
, c
2
, ...c
n
} and L = {l
1
, l
2
, ...l
p
}.
Each class is defined by a name and a set of q
attributes, each attribute being defined by a name
and by a type:
c
i
= (N, A) ∀ i∈[1..n] with A = { a
1
(n
1
: t
1
),
a
2
(n
2
: t
2
),… a
q
(n
q
: t
q
)}
Figure 4: Intermediate schema n°1 (IS
1
).
The classes of personalization schema noted CP
contains a list of x classes extracted from the source
CP = <c
1
, c
2
, ...c
x
>.
Intermediate Schema n°1
(IS
1
) is defined by a set
of candidate facts: IS
1
= {f
1
, f
2
, ...f
t
}. Every fact is
defined by a name and a set of r measures: f
j
= (N,
M) ∀ j∈[1..t] with M = {m
1
(n
1
: t
1
)
, m
2
(n
2
: t
2
), ...
m
r
(n
r
: t
r
)}.
Let us consider the following functions:
isnumeric(t
k
) returns true if t
k
has a numeric type
such as integer or float and isaggregative(a
k
) returns
true if a
k
is an additive or semi-additive attribute.
Step 1
Step 2
Step 3
Step 4
decision-makers’
requirements
Personalization metadata
Fact
Dimensions Hierarchies
Data-Mart schema
Id_Vol
NoComp
IdRes
Jour
Mois
Année
DateArr
Aéroport
DateDep
Année
HV1
HV2
HV3 HV4
Intermediate
schema 1
Intermediate
schema 2
Intermediate
schema 3
Conceptual schema's
source
ICEIS 2011 - 13th International Conference on Enterprise Information Systems
242
The step 1 of the incremental process consists
therefore in seeking in IS
1
, a set of candidate facts
(at most 10) and measures. From this intermediate
schema, the decision-maker will designate the
measures to be analysed from a selected fact.
There are two possible of candidate measures:
- Measures “<Fact>_Nb”; that consists in
counting instances for each fact
(aggregation function COUNT).
- Numeric attributes extracted from source
and corresponding to the chosen fact.
If a user chooses a numeric attribute, he must
associate with it an aggregation function: COUNT,
AVG, SUM, MIN, etc.
The decision maker not being a computer
specialist, is not authorized to create calculated
measures from several attributes of CD.
Example
: A decision-maker chooses the source
“products sales and stock management” (Figure 2).
The system will propose him the following IS
1
that
contains candidate facts extract from the source.
In IS
1
, the decision-maker chooses the desired
measures. For example, if he chooses “Orders_Nb”
and “OrdersAmount”, the fact “Orders” will be
selected and all other candidate facts in IS
1
will
disappear.
4.2 Step 2: Generation of Candidate
Dimensions
The role of the second step is to elaborate IS
2
from
IS
1
which contains the fact to be analysed and the
CD of the source. The system will generate in IS
2
the set of candidate dimensions. IS
2
is defined by a
set of g facts extracted from IS
1
and a set of h
candidate dimensions associated to each fact; every
dimension is established by its name N and by its
associated facts : IS
2
= (F,D) with F = {f
1
,f
2
,…,f
g
},
D={d
1
,d
2
,…,d
h
}, d
i
= (N,f
j
), ∀ i ∈ [1...h] and j∈[1..g].
Let us consider the following functions:
correspond_fact(CD, IS
2
, fi) returns the class in CD
corresponding to the fact f
i
in IS
2
. link(CD, c
i
)
returns the set of classes in CD which are directly
linked to the class c
j
in CD.
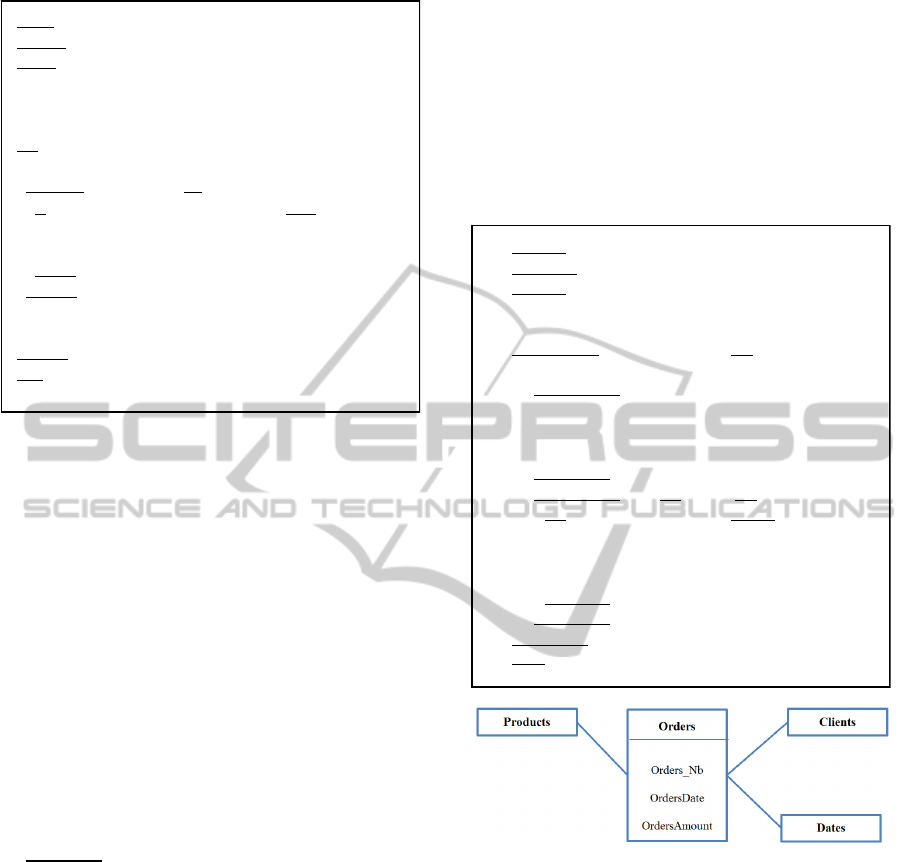
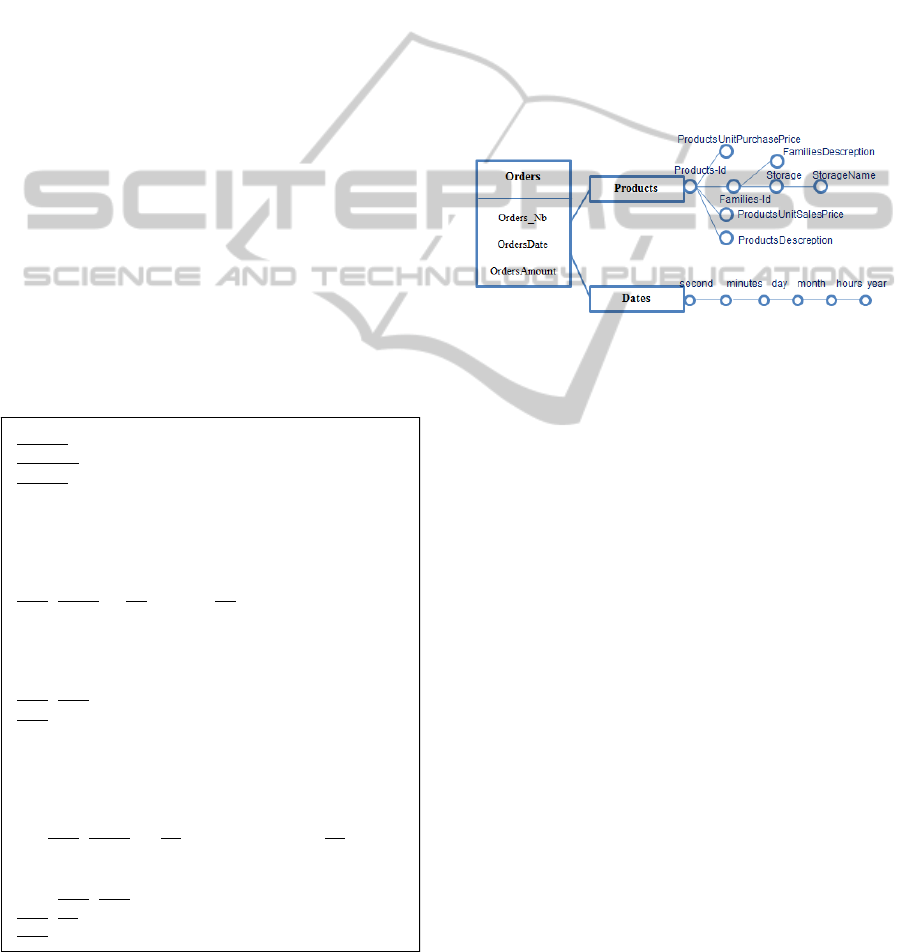
Figure 5: Intermediate schema n°2 (IS
2
).
From IS
2
, elaborated by the system, the decision-
maker designates one or more dimensions with
which he wishes to analyse the fact. IS
2
will keep
only the facts and dimensions chosen by the
decision-maker.
4.3 Step 3: Generating Candidate
Hierarchies
From the IS
2
, the decision-maker choses useful
dimensions for his analyse. Step 3 consists in
generating the candidate hierarchies within each
dimension. Every hierarchy represents an analysis
perspective specifying different granularity levels
(parameters) with which the analysis indicators
Input : CP, CD
Output
: IS
1
begin
t
max
←10; -- maximum number of candidate
facts
SI
1
←∅; -- set of candidate facts
for
i←1 to t
max
do
M←∅; -- set of measures
for each
a
k
in CP[i].A do
if
isnumeric(t
k
) ∧ isaggregative(a
k
) then
M←M ∪ {(n
k
:t
k
)}
-- new measure from a
k
end if
end for
IS
1
←SI
1
∪ {(CP[i].N, M)}
-- new candidate fact
end for
end
Input : CD, IS
1
Output
: IS
2
begin
IS
2
.F ← IS
1
-- set of
chosen facts
for each
f
k
in IS
2
.F do
x ← correspond-fact(CD, IS
2
, f
k
)
for each
c
i
in link (CD, x) do
IS
2
.D ← SI
2
.D ∪ {(ci.N, f
k
)}
-- extracts new dimensions from
classes in CD
end for
for each
a
i
in x.A do
if
a
i
not in f
k
.M then
IS
2
.D ← IS
2
.D ∪ {(a
i
.n
i
, f
k
)}
-- extracts new dimensions from
attributes of x
end if
end for
end for
end
COMPUTER-AIDED DATA-MART DESIGN
243
(measures) can be manipulated. These parameters
are organized from the finest granularity to most
general granularity. Different hierarchy types exist.
We consider only strict hierarchies (E. Malinowski
& E. Zimányi 2006).
IS
3
thus contains the facts and dimensions to be
analysed and one or more candidate hierarchies for
each analysis dimension. These candidate
hierarchies are extracted from CD. Let c be the class
that correspond to the fact. A set of classes and
attributes of the dimension d are so selected:
- Internal identifier of the dimension d,
represents the finest granularity,
- Attributes of the class d, with the exception
of internal identifiers,
- Classes connected to d through a many-to-
one associations; one instance of a lower
level (finer) corresponds to one instance of
the higher level (more general) and of the
higher level corresponds to several instances
of the lower level. This step is recursive.
The third intermediate schema (IS
3
) is defined by
a set of g facts, and j dimensions extracted from IS
2
and a set of k candidate parameters associated to
each dimension. Each parameter is defined by its
name, the associated dimension and its predecessor
in the dimension hierarchy.
IS
3
= (F, D, P) with F = {f
1
, f
2
, ...f
g
}; D = {d
1
, d
2
,
... ,d
l
} ; P = {p
1
, p
2
, ... , p
r
} where p
i
= (N,d
j
,a
i
);
∀ i∈[1..r] and j∈[1..l] and a
i
is the antecedent of p
i
parameter in the hierarchy of the d
j
dimension.
Let us consider the following functions:
correspond_dim(CD, IS
3
, d
i
) returns the class in CD
corresponding to the dimension d
i
in IS
3
,
link_1(CD, c
j
) return the set of classes in CD which
are directly linked with the class c
j
in CD with one-
to-many links. We do not consider multiple
hierarchies.
Example: the decision-maker chooses
dimensions « Dates » and « Products » from the
proposed dimensions. The system generates then the
following IS
3
schema containing candidate
hierarchies. These hierarchies are extracted from the
CD.
Figure 6: Intermediate schema n°3 (IS
3
).
The decision-maker chooses from IS
3
the
parameters Year and Month from Dates dimension.
Example: the decision-maker chooses dimensions
« Dates » and « Products » from the ones proposed
as well as the parameters Families-Id, Storage and
ProductsUnitSalesPrice from of Products dimension
(cf. Figure 6).
4.4 Step 4: Generation Data-mart
Schema
The final IS
3
represents the star schema or
constellation schema that the decision maker wishes
to analyse (Ravat et al. 2007).
The fourth step consists in producing a data-mart
schema after choosing parameters to be analysed by
the decision-maker. This schema noted DMS
(DataMartSchema) is defined by a set g facts, j
dimensions and k parameters chosen on IS
3
: DMS =
(F, D, P) with F = {f
1
, f
2
, ...f
g
}; D = {d
1
, d
2
, ... ,d
l
}; P
= {p
1
, p
2
,...,p
k
}.
But also this step produces a set of personalized
classes used as input for step1 CP = <c
1
, c
2
,…, c
x
>
with a classes number generally fixed at 10.
Personalized classes correspond to source classes
of CD having more probability to be analyzed by a
decision-maker when he will elaborate a new data-
mart schema in the future. Each time a new data-
mart schema is developed, the system tries to
Input : CD, IS
2
Output
: IS
3
begin
IS
3
.F ← IS
2
.F -- set of chosen
facts
IS
3
.D ← IS
2
.D -- set of chosen
dimensions
P ← ∅
for
each d
in IS
3
.D do
x ← correspond-dim(CD,IS
3
,d)
hierarchy(d,x,P) -- hierarchy
of the d dimension
IS
3
.P ← IS
3
.P
∪ P
end for
end
___________________
hierarchy(d,x,P) -- recursive
procedure for computing hierarchy of
one dimension
begin
if link-1(x) <> ∅ then
for
each y in link-1(CD,x) do
P ← P
∪ {(y.N,d,x)}
hiérarchie (d,y,P)
end
for
end
if
end
ICEIS 2011 - 13th International Conference on Enterprise Information Systems
244
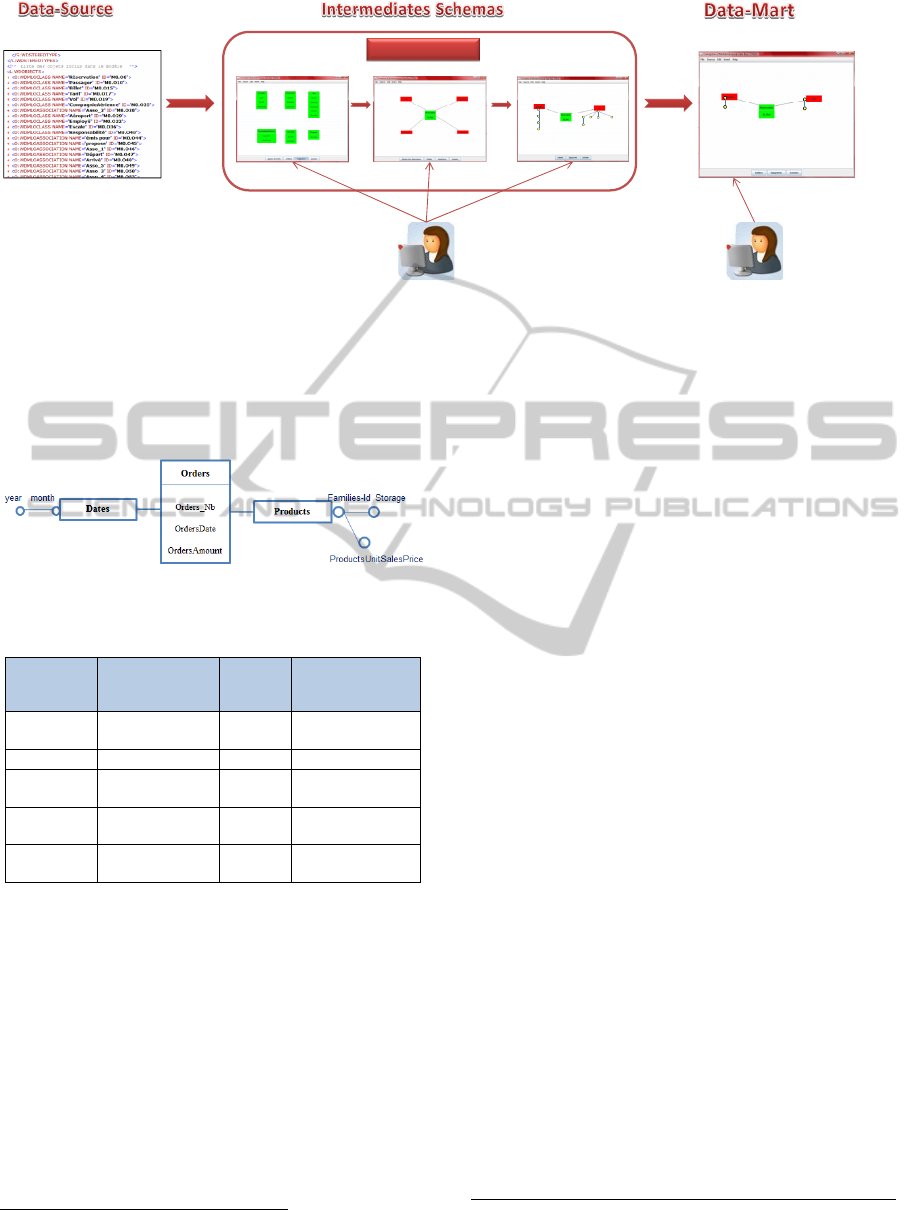
Figure 7: The process for elaborating a data-mart schema.
recognize multidimensional elements. The meta-data
saved with the accumulated frequencies of the
sources classes used in the data-mart. In step 1, these
meta-data will be used to choose a set of candidate
facts from the source schema.
Figure 8: Data-mart schema.
Table 1.
Data-mart
concept
Corresponding
element into CD
source
Weight
CD class that
accumulates the
weight
measure of
fact
attribute 10
class containing
the attribute
dimension class 5 A whole class
dimension attribute 5
class containing
the attribute
level of
dimension
attribute 4
Class containing
the attribute
level of
dimension
class 4 A whole class
5 CASE TOOL
To validate our proposal, we have developed a
CASE tool based on the process described in this
paper. Until now, we have not performed an
experiment in an industrial environment using real
operational sources.
The CASE tool is developed in Java and relies
on the JGraph
1
library; it takes as input the Class
Diagram CD described in an XML
2
Document
1
JGraph Ltd.: JGraph – Java Graph Visualization and Layout.
http://www.jgraph.com/.http://www.jgraph.com/
and produces the multidimensional schema (star
schema or constellation schema). Figure 8 shows
flight management; the CD shown is the data-source
that will be analysed by the decision-maker.
In principle, the decision-maker does not
visualize the entire CD because it is difficult to
search a potential fact among the numerous classes.
The system generates in IS
1
a subset of CD
containing the most representative classes for the
decision-maker using personalization techniques
(Jerbi et al. 2009). From this schema, the decision-
maker will incrementally integrate his requirements.
This CASE tool takes a mixed approach to help
the decision-maker to define data-mart schema from
the CD of the source while incorporating decision-
makers’ requirements. It presents the advantage of
offering a vision of data-source schema and
graphical incremental process to assist the decision-
maker in elaborating the data-mart schema himself
without the help of designers.
6 CONCLUSIONS AND FUTURE
WORK
This paper proposes an approach to elaborate
multidimensional schema from data-source schemas
to be analysed that gradually integrates the decision-
makers’ requirements. This approach is original as it
allows a decision-maker to gradually build his
multidimensional schema, without calling on a
database administrator or a computer specialist. It
differs from author hybrid-driven, data-driven and
requirements-driven approaches in which the user
does not directly intervene. The knowledge of the
data sources by the decision-maker is reduced using
2
XML, Extended Markup Language, from http://www.w3.org
/XML/.
Mois
Année
Id_Vol
NoComp
Id_Vol
NoComp
IdRes
Jour
Mois
Année
DateArr
Aéroport
DateDep
Année
HV1
HV2
HV3 HV4
IS
1
IS
2
IS
3
XML
Java+JGraph
Decision‐maker
Decision‐maker
Analyse
Elaborating schema
COMPUTER-AIDED DATA-MART DESIGN
245

personalization techniques. However, this
mechanism does not reduce the possibilities of the
decision-maker. Indeed, if he wishes to choose a fact
out of the intermediate schema, he may navigate
within the data-source schema.
The extension of this work is in the process of
automatic data-mart generation from data-source
schema. The proposed approach allows elaborating a
multidimensional data-base schema. But the design
of this multidimensional data-base will be possible
from saved meta-data through the progress of the
design approach.
Moreover, the approach has been implemented
through a CASE tool from text-book cases. An
industrial experiment is planned validate all the
proposed mechanisms.
REFERENCES
Annoni, E. et al., 2006. Towards Multidimensional
Requirement Design. Data Warehousing and
Knowledge Discovery, 75–84.
Giorgini, P., Rizzi, S. & Garzetti, M., 2005. Goal-oriented
requirement analysis for data warehouse design. Dans
Proceedings of the 8th ACM international workshop
on Data warehousing and OLAP. Bremen, Germany:
ACM, p. 47-56.
Golfarelli, M., Maio, D. & Rizzi, S., 1998. The
Dimensional Fact Model: a conceptual model for data
warehouses. Int. Journal of Cooperative Information
Systems, 7(2&3), 215–247.
Jerbi, H. et al., 2009. Applying recommendation
technology in OLAP systems. Enterprise Information
Systems, 220–233.
Malinowski, E. & Zimányi, E., 2006. Hierarchies in a
multidimensional model: From conceptual modeling
to logical representation. Data & Knowledge
Engineering, 59(2), 348–377.
Malinowski, E. & Zimányi, E., 2008. Designing
Conventional Data Warehouses. Advanced data
warehouse design, 251 -- 313.
Moody, D. L. & Kortink, M. A., 2000. From enterprise
models to dimensional models: a methodology for data
warehouse and data mart design. DMDW’00, Sweden,
5.
Phipps, C. & Davis, K., 2002. Automating data warehouse
conceptual schema design and evaluation. Proc. 4th
DMDW, Toronto, Canada.
Pinet, F. & Schneider, M., 2009. A Unified Object
Constraint Model for Designing and Implementing
Multidimensional Systems. Dans Journal on Data
Semantics XIII. p. 37-71.
Prat, N., Akoka, J. & Comyn-Wattiau, I., 2006. A UML-
based data warehouse design method. Decision
Support Systems, 42(3), 1449-1473.
Ravat, F. et al., 2007. Graphical querying of
multidimensional databases. Dans Advances in
Databases and Information Systems. p. 298–313.
Romero, O. & Abelló, A., 2010. Automatic validation of
requirements to support multidimensional design.
Data & Knowledge Engineering.
Song, I. et al., 2008. SAMSTAR: An Automatic Tool for
Generating Star Schemas from an Entity-Relationship
Diagram. Dans Conceptual Modeling - ER 2008. p.
522-523.
Trujillo, J., Lujan-Mora, S. & Song, I. Y., 2003. Applying
UML for designing multidimensional databases and
OLAP applications. Advanced Topics in Database
Research, 2, 13–36.
ICEIS 2011 - 13th International Conference on Enterprise Information Systems
246
