
LABEL ORIENTED CLUSTERING FOR SOCIAL NETWORK
DISCUSSION GROUPS
Ahmed Rafea, Ahmed El Kholy Sherif and G. Aly
Computer Science and Engineering Department, School of Science and Engineering, American University in Cairo
New Cairo, Egypt
Keywords: Clustering, Bisecting K-mean algorithm, Social network, Discussion groups.
Abstract: This paper proposes applying Bisecting K-means algorithm, to cluster the social network discussion groups
and providing a meaningful label to the cluster containing these groups. The clustering of the discussion
groups is based on the heterogeneous meta-features that define each group; e.g. title, description, type, sub-
type, network. The main ideas is to represent each group as a tuple of multiple feature vectors and construct
a proper similarity measure to each feature space then perform the clustering using the proposed bisecting
K-means clustering algorithm. The main key phrases are extracted from the titles and descriptions of the
discussion groups of a given cluster and combined with the main meta-features to build a phrase label of the
cluster. The analysis of the experiments results showed that combining more than one feature produced
better clustering in terms of quality and interrelationship between the discussion groups of a given cluster.
Some features like the Network improved the compactness and tightness of the cluster objects within the
clusters while other features like the type and subtype improves the separation of the clusters.
1 INTRODUCTION
In both professional and personal life, human beings
naturally form groups based on affinities and
expertise. We gravitate toward others with whom we
share common interests. Most of us belong to real
world networks that are formed organically. Not
surprisingly, these networks rapidly migrated to the
online world. Online social networking sites like
MySpace, Facebook, and Bebo have been around in
various forms for nearly a decade, and have begun to
achieve worldwide notice in the past few years.
Social networks connect people with friends and
others who work, study and live around them.
People use social networks to keep up with friends,
upload an unlimited number of photos, share links
and videos, and learn more about the people they
meet. These online networks contain great power.
They change the online space from one of static web
pages and stale marketing messages to a live, vibrant
network of connected individuals who share their
abilities; expertise and interests. Online social
networks take many forms, and are created for many
reasons. Despite their differences, online social
networks do, however, commonly exhibit some
concepts like discussion groups (Chastain, 2008).
The motivation behind this work is to provide an
approach for clustering discussion groups that will
contribute in the enhancement of efficient searching
and browsing of these groups. Solving the problem
of finding a related discussion board won’t be
complete unless the users knows how and why these
groups are related and this could be achieved by
adding a label to each cluster that describes the
similarity aspects between the member groups of
each cluster.
The main goal of this paper is to apply an
algorithm for clustering discussion groups using
their heterogeneous meta-features, and investigate
the quality of clustering process when some or all of
these meta-features are used to facilitate discussion
groups browsing.
The proposed approach is based on applying one
of the well known clustering algorithms on typical
discussion groups, and experiment with different
features to measure their impacts on the clustering
quality. This could be summarized in the following
steps:
Collect (crawl) a set of discussion groups in
one of well-known social network like
Facebook
Extract the social meta-features used in the
205
Rafea A., El Kholy Sherif A. and Aly G..
LABEL ORIENTED CLUSTERING FOR SOCIAL NETWORK DISCUSSION GROUPS.
DOI: 10.5220/0003488402050210
In Proceedings of the 13th International Conference on Enterprise Information Systems (ICEIS-2011), pages 205-210
ISBN: 978-989-8425-53-9
Copyright
c
2011 SCITEPRESS (Science and Technology Publications, Lda.)

discussion groups
Build a representation model for each feature,
Utilize these feature vectors to build a
similarity measure to cluster these groups
Conduct experiments to investigate the impact
of different features
The second section reviews previous works
related to multiple features clustering. The third
section describes our approach for clustering
discussion groups. The forth section explains the
evaluation methodology to measure the impact of
different features on the clustering quality. The fifth
section describes the experiments conducted, their
results, and discussion. The sixth section illustrates
how labels are generated for clusters
2 MULTIPLE FEATURE
CLUSTERING
Using multiple features in clustering has been
always a major concern as it is common in real life
to have more than one feature for the objects that are
intended to be clustered. Moreover, in many cases
these features that characterize the clustered objects
are heterogeneous in nature which complicates the
process of building the similarity measures.
A good example of multiple feature clustering is
XML documents. Many research works attempted to
solve the XML clustering problem by proposing
several techniques and algorithms. Basically, the
clustering of XML documents as a problem has two
dimensions; content and structure. The content
dimension needs distances that estimate similarity in
terms of the textual content inside elements, while
the structure dimension needs distances that estimate
similarity in terms of the structural relationships of
the elements. Taken these two dimensions into
consideration, the authors in (Tagarelli, Greco,
2006) tackled the problem of clustering XML data
according to structure and content features enriched
with lexical ontology knowledge. In (Costa et al.,
2004), the authors proposed a methodology for
clustering XML documents based on their structural
similarities which is based on the notion of XML
cluster representatives. They exploited the tree
nature of XML documents and provided techniques
for tree matching, merging and pruning. Another
work in (Dalamagas, 2006) the application of
clustering methods was explored for grouping
structurally similar XML documents by modelling
the XML documents as rooted ordered labelled
trees. The authors applied clustering algorithms
using the tree-edit distance between these trees in
terms of the hierarchical relationship of their nodes.
Another interesting work in (Doucette, Ahonen,
2002) deals with clustering homogeneous collections
of text-centric XML documents. They used the
classic k-means clustering algorithm and combining
structural similarities and content similarity in order
to improve the clustering quality. One of the most
recent approaches is the work presented in (Nayak,
Xu, 2006). The authors proposed a compact level
structure representation of each XML document
based on node summaries per level of the XML
document. Based on this representation, Antonellis
et al. (2008) define an appropriate distance metric
for heterogeneous XML documents and they apply a
hierarchical clustering algorithm in the set of level
structure representations of the documents
Media Clustering is also a main application that
employs multiple features in the clustering
techniques. Abrantes (2000) extended a class of
constrained clustering algorithms for shape
estimation by using multiple features. These features
consist of edge points and associated image
properties, e.g., gradient, texture and colour.
Eterfreund (1998) exploited the image gradient and
optical flow using an algorithm called velocity
snake. Moreover, Gradient and texture information
were integrated in directional feature extraction
(Blake, Isard, 1998). In (Zhong, Jain, 1998), the
author used image gradient, colour, and motion cues
to update a deformable template model. In addition
to images, videos also built up from multiple
features that could be used in clustering; Lee et al.
(2000) proposed an efficient method to detect abrupt
shot changes in a video sequence.
3 REPRESENTING AND
CLUSTERING DISCUSSION
GROUPS
A data set is built by crawling discussion groups
from Facebook which is the most popular social
network nowadays. Examining the meta-features of
these discussion groups, we found that this data set
has numerical, text and categorical features.
Standard k-means is designed to work with
numerical data, and does not work well with
categorical and text data which are of heterogeneous
feature spaces by nature so it was necessary to build
a data model and similarity measures that overcome
this problem by treating each feature space as a
separate problem and applying different weights to
each element of meta-features.
ICEIS 2011 - 13th International Conference on Enterprise Information Systems
206

3.1 Discussion Groups Representation
and Similarity Measures
Every object (instance) in the data set consists of 5
features; 2 text (title &description) and 3 categorical
(network, type and subtype). Each object is
represented as a tuple of 5 component feature
vectors. The data object is written as x = (F1, F2, F3,
F4, F5) where the i
th
component feature vector F
i
, 1
<= i <= 5, is a column vector and lies in a
certain feature space.
3.1.1 Textual Features
The Title & Description group features (F1, and F2)
are represented using the information retrieval
vector space model. (Salton, McGill, 1983). The
basic idea is to construct a word dictionary of all the
words that appear in any of the objects in the dataset,
and to prune or eliminate stop words, then, the size
of the word dictionary is further reduced using
stemming (Frakes, Baeza-Yates, 1992). Suppose f1
unique words remain in the dictionary after such
elimination. A unique identifier is assigned from 1
to f1 to each of these words. Now, for each group x
in the dataset, the first 2 vectors F1 & F2 will be an
f1-dimensional vector. The j
th
column entry, 1 <=
j <= f1, of F1 & F2 is the number of occurrences
of the j
th
word in the title or description respectively
in group x. Finally, each of the two components F1
and F2 is normalized to have a unit Euclidean norm
(Singhal et al., 1996), that is, their directions are
retained and their lengths are discarded (Modha,
Spangler, 2003)
.
The similarity measure used for these textual
features is the Euclidean distance. The less the
distance the more similar the groups are.
3.1.2 Network Feature
The Network feature (F3) is an attribute or feature in
the user profile as well as in the discussion group. A
group could have one or more networks and the
subscriber of a group could also belong to more than
one network. This feature is represented as a set of
values representing the networks given as an
attribute of the group.
A similarity relationship matrix of the networks
is built based on the members of the groups; for
example, network N1 and network N2 could be
considered highly related if many members belong
to both networks. The relation is based on
association analysis which is useful for discovering
interesting relationships hidden in large datasets
(Tan et al., 2006). We built the Network dataset
from the networks of the users to which they belong;
for example, if a user belongs to Egypt, AUC-Egypt
and IBM, then a transaction Egypt, AUC-Egypt,
IBM is added to the dataset. After building the
dataset we generate a 2 item set (the set of paired
items (2-Networks) in the dataset. We evaluate the
relationship based on objective measure that is
computed using the frequency counts tabulated in a
contingency table that is used to compute the
correlation between a pair of networks using
Pearson’s correlation coefficient. The value of
correlation ranges from -1 (perfect negative
correlation) to +1 (perfect positive correlation). If
the variables are statistically independent then the
value is 0. The whole process is repeated for every
couple of networks and a similarity relationship
matrix for m networks, was built. The similarity
measure between two groups is calculated using this
similarity matrix by taking the average of the
similarity measures between the networks in one
group and the networks in the other group.
3.1.3 Type and Subtype Features
The Type & Subtype features (F4 and F5) are of
categorical nature. A group could have one or more
type and one or more subtype features values. These
features are represented as a set of values
representing the types and subtypes.
A similarity relationship matrix of types is built
using the members of the groups, for example type
T1 and type T2 could be considered highly related if
many members subscribe to groups have both types.
If a user subscribed in a group that has Business,
Geography and Music as types then a transaction of
Business, Geography, and Music is added in the type
dataset. The similarity relationship is based on
association analysis in the same way as we did for
network feature. The same approach was also used
for the subtype feature values to build a similarity
matrix for the subtypes. The similarity measure
between two groups using the type feature is
calculated using the type similarity matrix by taking
the average of the similarity measures between the
types’ values in one group and the types’ values in
the other group. The similarity measure using the
subtype feature is calculated in the same way using
the subtype feature similarity matrix.
3.2 Clustering Discussion Groups using
a Combined Similarity Measure
The minimization problem of the classical Euclidean
k-means is known to be NP-complete (Kleineberg et
al., 1998). So we used an adaptation of the classical
LABEL ORIENTED CLUSTERING FOR SOCIAL NETWORK DISCUSSION GROUPS
207

K-means algorithm which is the bisecting K-means
algorithm. The bisecting K-means algorithm is based
on a simple idea; to obtain k cluster split the set of
all objects into two clusters, select one of these
clusters to split and so on until k clusters have been
produced or a threshold is reached. Bisecting K-
means has less trouble with initialization because it
performs several trial bisections and takes the one
with the lowest sum of the squared errors (SSE) and
because there are only two centroids at each step
(Tan et al., 2006).
Finding weights for combining the features
similarity measures is an optimization problem.
Genetic algorithm (GA) is well known method to
solve such optimization problem. At the heart of the
genetic algorithm is the Chromosome. The
Chromosome represents a potential solution and is
divided into multiple genes. There is also what is
called the fitness function. In our case the weights of
the features similarity measures are represented as
genes with values that range from 1..5. The fitness
function was decided to be the Silhouette function
(Tan et al., 2006) which is a well known function
that measures the quality of clustering a dataset. The
bigger the value of this function the better is the
solution.
4 EVALUATION
METHODOLOGY
Due to the lack of the evaluation dataset, we used a
crawler to crawl 1000 Facebook discussion groups
as to test our clustering approach. Facebook was
chosen because of its popularity and diversity in
discussion groups. Moreover, Facebook provides
APIs to access the required information. A crawler is
built that crawls the discussion groups to collect the
group identification numbers and then used the APIs
to collect all the other information required like the
title and description and all other Meta features.
The Silhouette Coefficient was used as it
integrates the cohesion and separation quality
measures of clustering. The steps explaining how to
compute the Silhouette coefficient for an individual
object in a cluster, is given in (Tan et al., 2006). The
basic idea is to measure the average distance of an
object (discussion group in our work) in a cluster to
all objects in the same cluster (a
i
) and to get the
minimum distance of the same object to other
objects in other clusters (b
i
). Then compute the
Silhouette coefficient using the following formula:
Silhouette coefficient = (b
i
- ai) / max (a
i
, b
i
)
The average Silhouette coefficient of a cluster
can be computed by simply taking the average of the
silhouette coefficients of objects belonging to the
cluster. An overall measure of the goodness of a
clustering can be obtained by computing the average
silhouette coefficient of all points. The Silhouette
coefficient values range from -1 to +1. The greater
the value of the coefficient the better the clustering
is.
In order to apply the Silhouette, the distance
between groups is used instead of similarity. For
textual feature we have already proposed the
Euclidean distance while the inverse of the similarity
measure will be used for network feature and the
inverse of the similarity measure is used for type and
subtype features.
5 EXPERIMENTS
Several experiments have been conducted to show
the impact of using multi-features on the quality of
the clustering. In order to do that, three experiments
were conducted. The first experiment was conducted
using features having the same type, the second
experiment was conducted using different
combinations of features, while the third experiment
was conducted using all features with equal and
different weights for each feature.
5.1 Single Type Features Clustering
In this experiment, the groups were clustered based
on a single type of features and the evaluation was
based on the whole set of features in order to have a
solid common ground to be able to make a fair
comparison and show how other features that are
not counted for in the clustering affects the quality
of the clustering. The implemented clustering
approach was applied on the dataset to generate 10,
20 and 40 clusters then measuring the Silhouette
coefficient values for each run. The results in Table
1 show that using the Type and Subtype features for
clustering provide the best clustering, while the
network feature came as the second best independent
of the number of clusters.
5.2 Multiple Feature Clustering
In this experiment, the focus is on showing the effect
of combining more than one feature on the quality of
clustering. Different combinations of the features
were used in the clustering and as the previous
experiment; the evaluation was based on the whole
set of features in order to have a solid common
ICEIS 2011 - 13th International Conference on Enterprise Information Systems
208
ground in comparing the output. Applying the
implemented clustering to generate 10, 20 and 40
clusters then measuring the Silhouette coefficient
values for each run, the results are shown in Table 2.
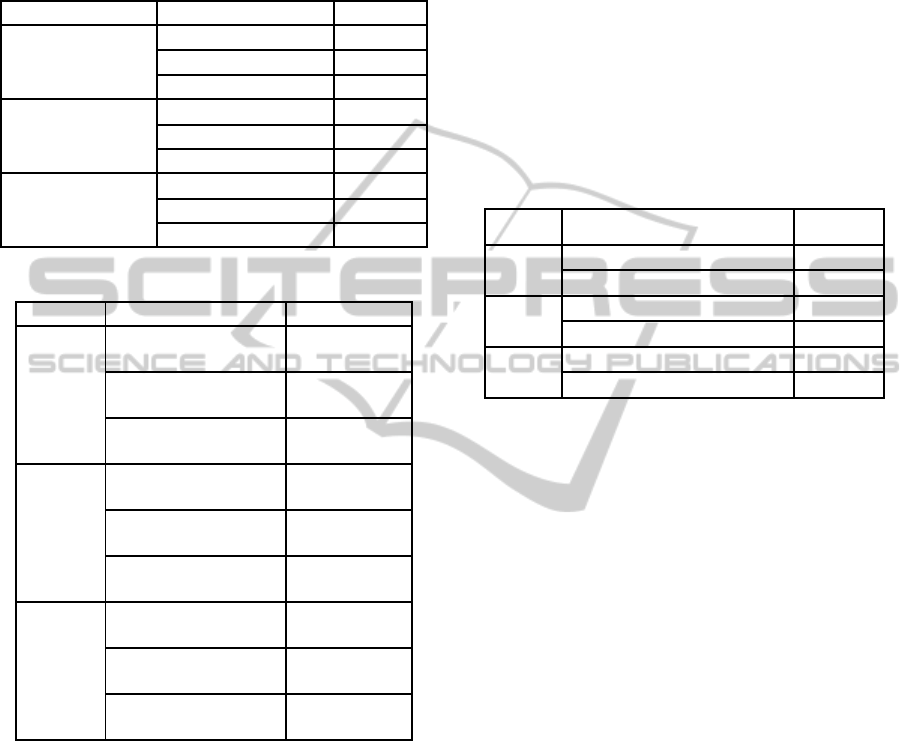
Table 1: Single Feature Clustering.
Clusters Number Clustering Features Silhouette
10 Clusters Title & Description 0.45
Type & Subtype 0.58
Network 0.56
20 Clusters Title & Description 0.46
Type & Subtype 0.59
Network 0.56
40 Clusters Title & Description 0.47
Type & Subtype 0.59
Network 0.57
Table 2: Multiple Feature Clustering.
Clusters Features Silhouette.
10
Title & Description
and Network
0.60
Title & Description
and Type & Subtype
0.57
Network and Type &
Subtype
0.66
20
Title & Description
and Network
0.62
Title & Description
and Type & Subtype
0.59
Network and Type &
Subtype
0.67
40
Title & Description
and Network
0.63
Title & Description
and Type & Subtype
0.61
Network and Type &
Subtype
0.68
When comparing these results with the first
experiment results, it became clear that the effect of
combining more than one feature produces better
results. The best results were produced when
combining the Network with Type and Subtype
features while the second best was when the textual
features were combined with the Network feature. It
should also be noticed that adding the textual
features to Type and Subtype features did not have
any impact on clustering enhancement.
5.3 Multiple weighted Features
Clustering
In this Experiment, we compared the effect of
changing the weights of the features used in the
clustering. A development set of 100 groups was
taken out of the evaluation dataset, to estimate the
weights. The GA was run using the bisecting K-
means and the Silhouette function to choose the best
solutions among the solutions population generated
by the GA. Keeping the GA running for more than
36 hours with 22 evolution cycles over the
development dataset, the best weights produced
were 1, 5, 2, 4, 1 to be assigned to the group’s title,
description, network, type and subtype respectively.
The clustering was done one time using the
recommended weights and another time with equal
weights. The results are shown in Table 3.
Table 3: Multiple versus Equal Weights Assignment.
Clusters Features Silhouette
10 Different Weights (1,5,2,4,1) 0.69
Equal Weights 0.68
20 Different Weights (1,5,2,4,1) 0.73
Equal Weights 0.70
40 Different Weights (1,5,2,4,1) 0.77
Equal Weights 0.70
The results showed that the more features used
the better clustering quality is. It is also worth noting
that the weighted features clustering produced better
results than equal weights features clustering.
5.4 Analysis and Discussion
The overall analysis of the three experiment results
has revealed that:
The best result obtained when using Type and
Subtype features only was 0.59
The best result obtained when using the
Network, Type, and Subtype features, was 0.68
The best result obtained when using equal
weights for all features, was 0.70
The best result obtained when using weights
for all features, was 0.77
The number of clusters has noticeable impact
only when clustering was conducted using
weights for features. Silhouette coefficients
ranged from 0.69 to 0.77 when the number of
clusters was 10 and 40 respectively.
Adding the Title and Group description
features to Network, Type, and Subtype
features, without giving weights, slightly
improved the clustering quality.
Using weights for all features improved the
clustering quality with 10% over using equal
weights
LABEL ORIENTED CLUSTERING FOR SOCIAL NETWORK DISCUSSION GROUPS
209

6 CONCLUSIONS
In this research the Bisecting K-means clustering
technique was applied to cluster the social network
discussion groups using the groups’ meta-features.
The main contributions in this paper are: assigning a
suitable similarity measure for each meta-feature,
and enhancing the clustering quality by assigning a
weight for each feature using genetic algorithms.
Making use of the data of the members of a
group; namely the networks to which they belong
and the types and subtypes of the groups they joined
was the new idea in developing the similarity
measure. The similarity measures of network, type
and subtype features were based on building
statistical correlation for analyzing relationships
between a pair of feature values of group members.
One of the important results is that giving
weights to the features has increased the clustering
quality. When more weight is given to the group
description and type features better Silhouette
coefficient was obtained. The results of the
experiments illustrates the effect of social features,
induced from members data, as the best results were
obtained when the network, type, and subtype
features are combined in the experiment in which we
tried different combinations.
As a future work, more social features; for
example, the users posts, should be investigated and
used in building the clusters and see the effect of
these social features on the clustering quality. More
experiments are needed on larger dataset to prove
the preliminary findings explained in this work.
ACKNOWLEDGEMENTS
The authors of this paper are especially grateful for
Cairo Microsoft Innovation Center CMIC, for the
support to this research.
REFERENCES
Abrantes, A., 2000. A Constrained Clustering Algorithm
for Shape Analysis with Multiple Features. ICPR, 15th
International Conference on Pattern Recognition
(ICPR'00) - Volume 1, page 1916.
Antonellis, P., Makris, C., Tsirakis, N., 2008. XEdge:
Clustering Homogeneous and Heterogeneous XML
Documents using Edge Summaries. In Proceedings of
the 2008 ACM symposium on Applied computing,
Fortaleza, pages 1081-1088.
Blake, A., Isard, M. 1998. Active Con tours, Springer,
Chastain, L., 2008. Social networking for Businesses and
Association. Cerado Inc. Half Moon Bay.
Costa, G., Manco, G., Ortale, R, Tagarelli, A., 2004. A
Tree-Based Approach to Clustering XML Documents
by Structure. In Proceedings of the 8th European
Conference on Principles and Practice Knowledge
Discovery in Databases (PKDD ’04).Pisa, pages 137-
148.
Dalamagas, T., Cheng, T., Winkel, K., Sellis, T.K., 2006.
A methodology for clustering XML documents by
structure. In Information Systems Journal, 31(3),
pages 187-228.
Doucet, A., Ahonen-Myka, H., 2002. Naïve Clustering of
a large XML Document Collection. In Proceedings of
the 2002 Initiative for the Evaluation of XML
Retrieval Workshop (INEX ’02), pages 81-87.
Eterfreund, N., 1998. Robust Tracking with Spatio-
Velocity Snakes: Kalman Filtering Approach. ICCV,
pages 433-439.
Frakes, W. B., Baeza-Yates, R., 1992. Information
Retrieval: Data Structures and Algorithms, Prentice
Hall, Englewood Cliffs.
Kleinberg, J., Papadimitriou, C., Raghavan, P., 1998. A
Microeconomic View of Data Mining. Data Mining
and Knowledge Discovery, 2(4), pages 311-324.
Lee, H., Lee, C., Kim, S., 2000. Abrupt Shot Change
Detection using an Unsupervised Clustering of
Multiple Features. In Proceedings of IEEE
International Conference on Acoustics, Speech, and
Signal Processing, Volume 6, pages 2015 - 2018
Modha, D., Spangler, S., 2003. Feature Weighting in K-
means clustering. Machine Learning, 52(3), pages
217-237.
Nayak, R., Xu, S., 2006. XCLS: A Fast and Effective
Clustering Algorithm for Heterogeneous XML
Documents. In Proceedings of the Pacific-Asia
Conference on Knowledge Discovery and Data
Mining (PAKDD ’06). Singapore, pages 292-302.
Salton, G., McGill, M. J., 1983. Introduction to Modern
Retrieval, McGraw-Hill Book Company.
Singhal, A., Buckley, C., Mitra, M., Salton, G., 1996.
Pivoted Document Length Normalization. In Proc.
ACM SIGIR, pages 21-29.
Tagarelli, A., Greco, S., 2006. Toward Semantic XML
Clustering. In Proceedings of the 2006 Siam
Conference on Data Mining (SDM ’06). Maryland,
pages188-199.
Tan, P., Steinbach, M., Kumar, V., 2006. Introduction to
Data Mining, Pearson Addison Wesley.
Witten, I., Paynter, G., Frank, E., Gutwin, C., Neville-
Manning, C., 1999. KEA: Practical Automatic
Keyphrase Extraction. In Proceedings of the Fourth
ACM Conference on Digital Libraries, Berkeley,
pages 254-255.
Zhong, Y., Jain, A., Dubuisson-Jolly, M., 1998. Object
Tracking Using Deformable Templates, ICCV, pages
440-446.
ICEIS 2011 - 13th International Conference on Enterprise Information Systems
210
