
A CHARACTERIZATION METHODOLOGY OF EVOLUTIONARY
BEHAVIOR IN RECOMMENDER SYSTEMS
Alan Cardoso, Daniel Rocha, Rafael Sachetto, Leonardo Rocha
Computer Science Departament, Federal University of S
˜
ao Jo
˜
ao Del Rei (UFSJ)
Pc. Dr. Augusto Chagas Viegas 17 - DCOMP - 36300-088, S
˜
ao Jo
˜
ao Del Rei, Brazil
Fernando Mour
˜
ao, Wagner Meira Jr.
Computer Science Departament, Federal University of Minas Gerais (UFMG)
Av. Ant
ˆ
onio Carlos 6627 -ICEx - 31270-010, Belo Horizonte, Brazil
Keywords:
Recommender systems, Evolutive, Characterization.
Abstract:
Recommender Systems (RSs) have become increasingly important tools for various commercial applications
on the Web. Despite numerous efforts, RSs still require improvements to make recommendation more effective
and applicable to many real scenarios. Recent studies point out the temporal evolution as a primordial manner
for improving RSs without, however, understand in detail how this evolution emerges. Thus, we propose a
methodology for evolutive characterization of users and applications in order to provide a better understanding
of this temporal dynamic in RSs. Applying our methodology in a real scenario has proved to be useful even to
help in the choice of RSs adherents of each scenario.
1 INTRODUCTION
The large volume of data available on the WEB has
generated in recent years a challenging scenario for
various applications. Users have more options that
can effectively handle (Adomavicius and Tuzhilin,
2005). Several commercial applications, such as
Amazon, Last.Fm, among others, provide a collec-
tion of items with millions of distinct products. Al-
though the availability of a wide range of options has
been a desired scenario in the past, nowadays repre-
sents a major challenge. In fact, we can state that this
large amount of options is “choking” the users, mak-
ing the simple choice of products of user interest a
difficult task. In this context, the Recommender Sys-
tems (RSs), which allow filtering this amount of in-
formation, showing only what can be useful to user
interest, are becoming increasingly important.
Several strategies to recommend products, infor-
mation and services to users have been proposed
recently (Adomavicius and Tuzhilin, 2001a; Burke,
2002; Abbasse and Mirrokni, 2007). The main idea
of the RSs is to estimate potentially interesting items
to users, based on a prior knowledge of their behavior,
as well as relevant characteristics of these items. Al-
though the idea is simple, its implementation presents
many computational challenges ranging from how to
model the users behavior, to how to use this mod-
eling information to provide the recommendation it-
self. For instance, user behavior can be represented
by any subset of items he has consumed, or even by
items not yet consumed but that may be relevant to
the system or to the user, given a metric of interest.
While there are numerous proposals, current RSs still
need improvements to address these challenges and
make the recommendation more effective and appli-
cable to a wider range of scenarios, such as trip ad-
vice, financial services, among others (Adomavicius
and Tuzhilin, 2001b).
Such challenges are being addressed by incorpo-
rating some dimensions of analysis into RSs. Cur-
rently, particular attention is being given to the tem-
poral dimension (Koren, 2009), due to the dynamic
aspect of user behavior. The user taste is not a static
characteristic, exhibiting changes over time. A same
user may has distinct opinions about the same object
in different moments. Several studies agree on the im-
pact of taste shifts to the recommendation (Adomavi-
cius et al., 2005; Adomavicius and Tuzhilin, 2001b;
Koren, 2009). As a consequence, the user model-
696
Cardoso A., Rocha D., Sachetto R., Rocha L., Mourão F. and Meira Jr. W..
A CHARACTERIZATION METHODOLOGY OF EVOLUTIONARY BEHAVIOR IN RECOMMENDER SYSTEMS.
DOI: 10.5220/0003479306960706
In Proceedings of the 7th International Conference on Web Information Systems and Technologies (WTM-2011), pages 696-706
ISBN: 978-989-8425-51-5
Copyright
c
2011 SCITEPRESS (Science and Technology Publications, Lda.)

ing should be continuously updated to reflect such
natural changes. In this sense, a major activity is
to understand and measure the variability associated
with the user behaviors and with the applications over
time, as well as the interaction between them. De-
spite the relevance of this understanding, we did not
find any studies that analyze how this temporal evolu-
tion, which we call evolutionary behavior, emerges in
RSs.
In this work we present a methodology for evo-
lutionary characterization of users and applications,
which is divided into three main steps that represent
a hierarchical view of the RS domains. The objec-
tive is to measure a not closed set of characteristics
that vary over time and that would affect the qual-
ity of the RSs. Such information will provide sub-
sidies for the proposal of new techniques in RSs, as
well as for proper changes in traditional techniques.
For instance, through our methodology we can assess
practical issues about RSs, usually disregarded in the
literature, such as: How often users tend to consume
the same item?; How diverse is the user consumption
in a given period of time?; What is the time interval
between consecutive accesses of the users in the sys-
tem?
In order to validate our methodology, we have
chosen the Last.Fm, one of the largest virtual mu-
sical community in the world. The results showed
that Last.Fm is mainly composed by activities of new
users, that present a decreasing consumption trend.
Further, the user behaviors are concentrated in few
distinct items, exhibiting a high repetition rate in the
consumption and a very dynamic behavior, quickly
varying their set of favorite songs. Such observations
allowed to assist in identifying the most appropriate
techniques for recommendation to Last.Fm besides to
properly redefine some traditional RSs assumptions.
In summary, the main contributions of this work can
be described as the proposal of a new methodology of
evolutionary characterization, and a deeper and useful
understanding of an actual recommendation domain.
The remainder of this paper is organized as fol-
lows. Section 2 discusses the main related work. Sec-
tion 3 presents our methodology of characterization.
After, in Section 4, we apply the proposal method-
ology in data derived from the Last.Fm. Finally, in
Section 5, we conclude and discuss future work.
2 RELATED WORK
Recommender Systems (RSs) play currently an im-
portant role in e-commerce systems, assisting users in
finding their favorite items and services. At this way,
several studies propose new strategies to recommend
products, information and services to users in vari-
ous domains (Burke, 2002). However, several chal-
lenges make the effectiveness and applicability of cur-
rent techniques inadequate for many scenarios (Ado-
mavicius and Tuzhilin, 2005). Some of these chal-
lenges have been studied extensively, and metrics that
allow to identify and to measure them in real domains
are recurrently investigated.
A first challenge consists of modeling the user be-
havior. Since each user can be modeled through a
distinct subset of objects (e.g., only for objects con-
sumed by him, or by objects considered relevant to the
domain), identifying the best model represents a com-
plex task. Nevertheless, most studies about user mod-
eling in RSs are done in a simplistic way, without take
into account some relevant characteristics of the user
behavior, such as the items relevance for each user.
For instance, metrics that quantify the consumption
diversity of each user may provide useful information
about the appropriate size of the object sets that model
the users. A second challenge refers to data sparsity,
established by the very nature of commercial appli-
cations. As the number of distinct objects in these
domains is generally huge, users are able to consume
only a small portion of the existing items. Moreover,
there is a high concentration of users around a few dis-
tinct objects followed by a downward concentration
around other objects, a phenomenon known as heavy
tail (Anderson, 2006), accentuating the data sparsity.
In this context, measuring the emergence of new users
and items over time in recommendation domain al-
lows to identify the actual impact of sparsity in RSs.
Some studies even suggest specific techniques to ad-
dress this problem in RSs (Wu and Li, 2008).
Another common challenge in RSs consists of
providing diversified recommendations (McSherry,
2002; Lathia et al., 2010). Although the domains
where the RSs operate have a wide variety of items,
the recommendations are generally somewhat diver-
sified. In (Zhang and Hurley, 2008), for example, the
authors model the diversity of the recommendation as
an optimization problem. We also can point out the
so called Cold Start problem as a challenge for RSS.
The Cold Start refers to the difficulty in making rec-
ommendations on new items or for new users, since
there is little information in the system about such
items and users (Schein et al., 2002). In fact, one ma-
jor challenge is to provide precise recommendations
when little is known about the users (Adomavicius
and Tuzhilin, 2005).
More recently, a new challenge has been analyzed
in RSs: the temporal evolution of the data (Koren,
2009; Cremonesi and Turrin, 2010). Traditionally,
A CHARACTERIZATION METHODOLOGY OF EVOLUTIONARY BEHAVIOR IN RECOMMENDER SYSTEMS
697

RSs are based on the premise that users past behav-
ior repeats in the future. However, this assumption
is not always true, since data may change over time.
For instance, new objects appear and opinions about
the same objects vary over time. Thus, the analysis of
these data need to find a balance between penalizing
time effects that have low impact on future behavior,
while capturing trends that reflect inherent recurring
patterns in the data.
Efforts on temporal evolution in RSs can be clas-
sified into two groups. The first one includes studies
which focus on assessing the quality of the recom-
mendations over time. In (Lathia et al., 2009), the im-
pact of temporal dynamics on the recommendations
is evaluated. In (Zhang and Hurley, 2008), the au-
thors assess how the diversity of the recommendation
is affected over time. In the second group we have
works that propose new recommendation models that
take into account the temporal evolution (Cremonesi
and Turrin, 2010). In (Koren, 2009), the authors ar-
gue that proposing recommendation models that take
into consideration the time tends to be more effective
than proposing complex models. Thus, variations on
the profiles of the users over time have been incorpo-
rated to RSs (Stern et al., 2009).
Our work differs from others by analyzing how
the temporal dynamics emerges in recommendation
scenarios, as well as by evaluating how some met-
rics related to the aforementioned challenges behave
over time. Despite various efforts, we did not find
any studies that aim to characterize and to understand
the temporal evolution in RSs. We believe that this
understanding is relevant not only to propose tech-
niques that address the temporal dynamics properly,
but also to provide a better understanding of the other
recommendation challenges. Quantifying each of the
mentioned challenges, and how they evolve over time,
allow us to identify which should be prioritized, and
consequently, what techniques are best suited to each
domain.
3 METHODOLOGY
In this section we present our characterization
methodology of the evolutionary behavior in recom-
mendation environments. In order to characterize
different dimensions of each domain, we divide this
methodology in three main steps, namely System
Context Analysis, Interaction Analysis and Users
Profile Analysis. Each step has a not closed set of
metrics that can capture relevant aspects of the do-
main, which vary over time and that may affect the
quality of the recommendation. The choice of these
metrics is based on their correlation with the main
challenges currently studied in RSs, as pointed out by
previous studies described in section 2. Further, new
metrics can be also incorporated into our methodol-
ogy as other relevant aspects are identified.
It is noteworthy that, although these steps are in-
dependent and can be applied separately, they repre-
sent a hierarchical view of the recommendation en-
vironments. The objective of the System Context
Analysis is to evaluate how the supply of items is de-
fined over time as well as to identify the business rules
established by the recommendation domain. After,
we evaluate in the Interaction Analysis how users
interact with the system during their lifetime. Fi-
nally, in the Users Profile Analysis, we characterize
how the users behave, regarding the consumption of
items available in the domain, and how this behavior
changes over time. In the subsequent sections, we de-
scribe in detail the goals and major metrics related to
each of the above steps of our methodology.
3.1 System Context Analysis
This first step of our methodology aims to understand
the evaluated environment. Identifying inherent char-
acteristics of the objects and the interaction pattern
between objects and users, defined by the environ-
ment, represents the main direction of this analysis.
For example, the “consumption” of songs may dif-
fer essentially from the “consumption” of videos. It
is verified since it is assumed that users listen to the
same songs again and again more often than watch
the same videos. Another relevant aspect would be
the distribution of items popularity in each domain.
While in some areas, such as songs and videos, pop-
ular items are orders of magnitude more consumed
than unpopular items in others, such as restaurant
recommendation, this difference is not as prominent.
Therefore, we consider how these features define a
set of general “parameters” for the recommendation
in each domain, by being able to inform the recom-
mender systems aspects that enable them to adapt to
each domain. For instance, knowing that a same user
often consumes the same item repeatedly may suggest
to the recommender that it can make the same recom-
mendation for the same user more than once.
In order to accomplish this analysis, there is a list
of metrics in Table 1 that we consider relevant. The
choice of such metrics was done through a systematic
collection of information that can be directly used by
recommender systems. It is important to mention that,
as in the other steps, we are not interested in list a
closed set of all existing and possible to be measured
“parameters”.
WEBIST 2011 - 7th International Conference on Web Information Systems and Technologies
698

Table 1: Metrics for System Context Analysis (CA).
Metric Description
Distribution of lifetime in the system (CA-1) For each user, we determine his lifetime, from his registration moment until the analysis
moment. At this way, we are able to verify if users of a given domain tend to remain in
the system for a long time.
Distribution of consumed items (CA-2) For each user, we measure the total number of items consumed throughout his lifetime
until the analysis moment. This distribution shows how many items, in general, users
consume in the domain.
Distribution of items popularity (CA-3) For each distinct item, we determine the number of different users who have consumed
it, at least once, during the period of analysis. Therefore, we evaluate the probability
of an item become popular in the system.
Emergence rate of users and distinct consumed
items (CA-4)
For each moment of analysis, we calculate the number of distinct items and users in
the system. Thus, it is possible to identify the diversification trend of the environment
in terms of users and objects.
Repetition rate in items consumption (CA-5) For each moment of analysis, we divide the total number of consumed items by the
number of distinct consumed items at each moment. This information is particularly
useful since it measures the recommender “freedom” in offering repeatedly a same item
to a same user.
Table 2: Metrics for Interaction Analysis (IA).
Metric Description
System usage time (IA-1) It is defined as the amount of temporal units of a user lifetime that he actually have
consumed items or have accessed the system.
Interval between accesses over time (IA-2) The interval between accesses is given by the average time interval between consecutive
accesses of a same user. An analysis of these intervals over time shows whether users
are gradually abandoning the system or not.
Consumption frequency per lifetime (IA-3) It represents the average number of items consumed by users in each distinct moment
of their lifetimes. This information may be relevant for evaluating if the system has an
increasing trend of consumption. An important issue closely related to this analysis is
whether “older” users in the system have a higher consumption profile or not.
Distribution of consumption rate per access (IA-4) It is defined by dividing the number of requests that an item gets by the number of
times it was consumed (in scenarios where such distinction is valid).
3.2 Interaction Analysis
Having identified the characteristics of the recom-
mendation domain, our next step consists of under-
standing how the users use and interact with the sys-
tem. Aspects such as how often they consume items,
the temporal gap between consecutive consumptions,
the system usage assiduity, among others, represent
important information about how the systems are
used. The usefulness of such information to the rec-
ommenders can be illustrated by considering the in-
formation from the Interval between accesses over
time, as defined in Table 2. Users with a smaller inter-
val between accesses may impose a stronger require-
ment of diversity for their recommendation list, since
consuming very similar items in a short period of time
may annoy the users.
The major metrics defined for this step are de-
scribed in Table 2. As mentioned, the proposed set
of metrics can be expanded to capture other relevant
information to the recommenders. For example, met-
rics based on access log, which determine the user
navigation paths in the system, or access time, among
others, represent potentially relevant information.
3.3 Users Profile Analysis
Finally, our methodology focuses on understanding
the behavior of users in the system regarding the con-
sumed object, defined as the user profile. In fact, this
step represents a quantitative analysis about the users
behavior. Such analysis is based on two main dimen-
sions: the diversity of items consumed by each user as
well as the temporization of their actions. We mean
by temporization the measurements of the time inter-
vals between the actions of a user on the system in
order to understand recurrent behavioral patterns over
time. The understanding of this profile is essential to
guide the recommendation in an individualized strat-
egy. For example, knowing that users, or even a spe-
cific user, have an average diversity in consumption
of X distinct items per week suggests that the recom-
mender should not provide more than X distinct items
per week to each user.
A CHARACTERIZATION METHODOLOGY OF EVOLUTIONARY BEHAVIOR IN RECOMMENDER SYSTEMS
699

Table 3: Metrics for Diversity Analysis (DA) of Consumption.
Metric Description
Diversity Distribution (DA-1) For each user, we determine the number of distinct items consumed throughout his
lifetime in the system. Such information describe the consumption profiles of the users
regarding the items diversification.
Average diversity per lifetime (DA-2) For each user “age” in the system, measured through the temporal unit of analysis, we
verify how many distinct items on average the users consume. Thus we can identify
the trend of diversification of the users consumption profiles during their lifetime.
Items Diversity in an ordered set of size N (DA-3) For each moment X of analysis, we measure the percentage of overlap between the N
most relevant items for a user u
i
at the moment X and the N most relevant items for u
i
at each distinct moment Y after X .
Relevance Variability of the Items (DA-4) It determines the mean value of relevance of the items consumed by each user at each
distinct moment.
It is important to point out that the definition of
some mentioned metrics, both for the Diversity of
Consumption Analysis and for the Actions Tempo-
rization, uses an ordered set of items for each user,
that is based on a relevance measure. We can define
the relative relevance of the items considering differ-
ent aspects, such as consumption frequency, similar-
ity between items, transition probability in a “naviga-
tion” network between items, among others. Thus,
most relevant items are in top positions in the set,
while less important ones are maintained in the last
positions. Moreover, the proposed analysis can be
performed by considering different temporal granu-
larities (e.g., weeks, months, semesters, among oth-
ers) as well as different sizes of item sets. At this
way, it is possible to define a broader evaluation, able
to contrast the evolutionary behavior of users in dif-
ferent temporal granularities, as well for distinct sizes
of item sets.
Next, we define the main metrics used for both
dimensions of the Users Profile Analysis:
• Diversity of Consumption: it aims to evaluate how
users behave in terms of diversity of consumed
objects. Moreover, variations of this diversity
over time, as well as its evolutionary trend is the
research focus in this step of the analysis. The
proposed metrics for this analysis are presented in
Table 3.
• Actions Temporization: it aims to understand re-
current behavioral patterns over time, such as the
time period in which users consume the items and
the time required for an item no longer be con-
sumed or be re-consumed. The proposed metrics
for this analysis are presented in Table 4.
In the following section we apply the metrics
described in this section on data derived from the
Last.Fm, bringing up the opportunity to further dis-
cuss the main concepts related to each of them. More-
over, we present the conclusions that can be obtained
by applying our methodology, as well as several kinds
of useful information that can be exploited by RSs.
Finally, we discuss how such information can help to
identify the most promising RSs techniques for do-
mains with distinct characteristics.
4 CASE STUDY
4.1 Database Description
In order to set the context, we present the dataset used
in our analysis. We use a dataset from Last.Fm sys-
tem
1
, which is an UK-based Internet radio and music
community website, founded in 2002. At the moment
of the data acquisition, it claimed over 30 million ac-
tive users. It is also estimated that Last.Fm had more
than 27 million different tracks and 12 million dis-
tinct artists in its database
2
. As Last.Fm represents
one of the biggest musical community in the world,
and since all the data is readily available on the WEB,
it is a good data source for music recommender sys-
tems.
Our analysis was performed on a sample of data
from Last.Fm. These data were collected through
an API provided by Last.Fm
3
. This API allows us
to obtain information related to several data entities
such as artists, albums, tracks, users, among others.
We consider as relevant to our analysis only infor-
mation related to users and tracks. Such informa-
tion was collected for a set of 146,973 distinct users
and 1,515,258 distinct tracks in the time interval from
02/12/2005 to 04/26/2009.
1
Available at http://www.last.Fm/.
2
These information were retrieved from the Last.Fm
Radio Announcement, on 03/25/2009, available at
http://blog.last.fm/2009/03/24/lastfm-radio-announcement.
3
http://www.last.fm/api.
WEBIST 2011 - 7th International Conference on Web Information Systems and Technologies
700
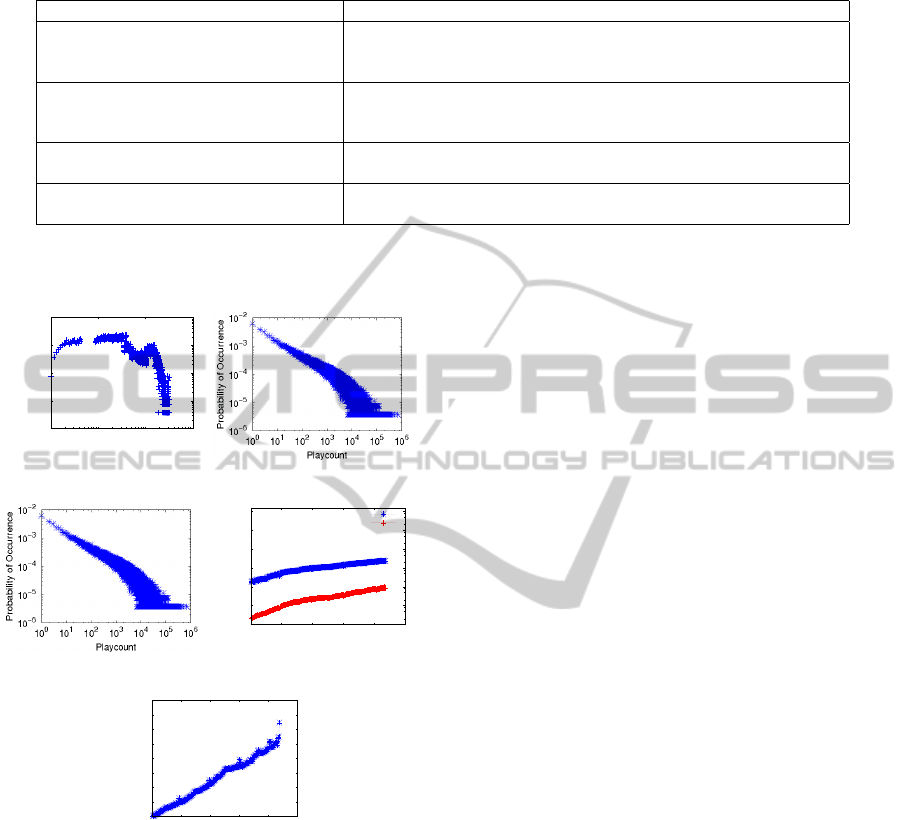
Table 4: Metrics for Temporization Analysis (TA) of Actions.
Metric Description
Distribution of Stability Period (TA-1) It determines the continuous period of time that items remain as the most relevant to
each user. A distribution of these values shows if, in general, items remain relevant for
a long period in a domain.
Probability of Re-execution (TA-2) It determines the probability of an item more relevant in the moment X be consumed
at least once in every moment Y after X . This measure is related with the possibility of
an item to be relevant again in future, given that it is relevant in the present.
Saturation Time (TA-3) It determines the average time required for an item no longer be consumed, from the
moment it was first consumed by each user.
Probability of Return (TA-4) It determines the probability of an item that has been relevant for a user in the past, but
is no longer consumed by him, come back to be consumed again.
4.2 System Context Analysis
10
−6
10
−5
10
−4
10
−3
10
−2
1 10 100 1000
Probability of Occurrence
Lifetime (Weeks)
(a) CA-1. (b) CA-2.
(c) CA-3.
10
3
10
4
10
5
10
6
10
7
10
8
10
9
0 50 100 150 200 250
Total Number
Week
distinct songs
distinct users
(d) CA-4.
0
100
200
300
400
500
600
700
800
0 50 100 150 200 250
Repetition Rate
Week
(e) CA-5.
Figure 1: Context Analysis Metrics.
The plots in Figure 1 present the metrics described for
the Context Analysis in the previous section. We start
our analysis by the distribution of the users lifetime
in the system, shown in Figure 1 (a). We can see that
most collected users have between 10 and 50 weeks
of lifetime in the system. Very short periods (less than
5 weeks) or very long ones (over 150 weeks) have a
very low probability of occurrence. This shows that
although users explore the system for some period,
Last.Fm is not able to keep them assiduous for a long
time.
In Figure 1 (b) we present the distribution of to-
tal number of songs listened to by the users. We ob-
serve that the probability of users listen to few songs
in the system is very high. Furthermore, it is impor-
tant to realize that this distribution follows a power
law, emphasizing the huge difference of probabili-
ties between listening to few songs and many songs.
Thus, in addition to remain for a short period of time
in the system, users tend to consume few items, stress-
ing the Cold Start problem for recommendation in the
Last.Fm (Schein et al., 2002).
Our next analysis concerns to the distribution of
song popularity in the system, as shown in Figure 1
(c). Most of the tracks in our dataset have been lis-
tened to by less than 100 distinct users, and only a
very restricted number of them have been listened to
by many users. Thus, Last.Fm represents a scenario
in which very few items manage to become popu-
lar. Consequently, simple recommendations strate-
gies based on popularity would not be appropriate for
most of the items.
The graphic in Figure 1 (d) presents the number
of distinct users and items that arise in the system at
each moment. Since we do not have the whole set
of users and tracks that appear in the Last.Fm glob-
ally, this plot, in fact, exhibit the set of new users that
appear in our dataset at each week and the number of
distinct songs that were listened to by at least one user
from this set at each week. As we can see, there is a
significant increase of unique users present in the sys-
tem each week, and also an increase of distinct mu-
sics. Such growth in the number of users and tracks
is slightly rising, generating an increasing sparsity of
information for RSs, which, to be effective, must be
skilled in dealing with this problem.
Finally, we analyze the repetition rate in the con-
sumption, as presented in Figure 1 (e) . We note
that Last.Fm not only constitutes an environment with
high repetition rate, but also by a growing trend in that
rate. That is, despite the amount of distinct tracks in-
creases over time, users tend to listen to more often
the same tracks over time. This observation has two
A CHARACTERIZATION METHODOLOGY OF EVOLUTIONARY BEHAVIOR IN RECOMMENDER SYSTEMS
701

important implications for recommenders. The first
one is that items already consumed by the users could
be recommended again for several times. The second
implication is that the recommenders should be ro-
bust to the super specialization problem, avoiding the
recommendations to be always anchored in the items
already known by the users.
In summary, the context analysis suggests that
Last.Fm represents a challenging scenario to recom-
menders, since, despite the huge diversity of users
and items, the usage history for most users is small,
concentrated in few items, and is characterized by a
high repetition rate in consumption. Further, sim-
ple popularity-based strategies for recommendation
seems to be not effective in this scenario.
4.3 Interaction Analysis
50
100
150
200
250
50 100 150 200 250
Usage Time (Weeks)
Lifetime (Weeks)
Ideal Scenario
(a) IA-1. (b) IA-2.
0.2
0.25
0.3
0.35
0.4
0.45
0.5
0 50 100 150 200 250
Normalized Number
of listened tracks
Lifetime (Weeks)
(c) IA-3.
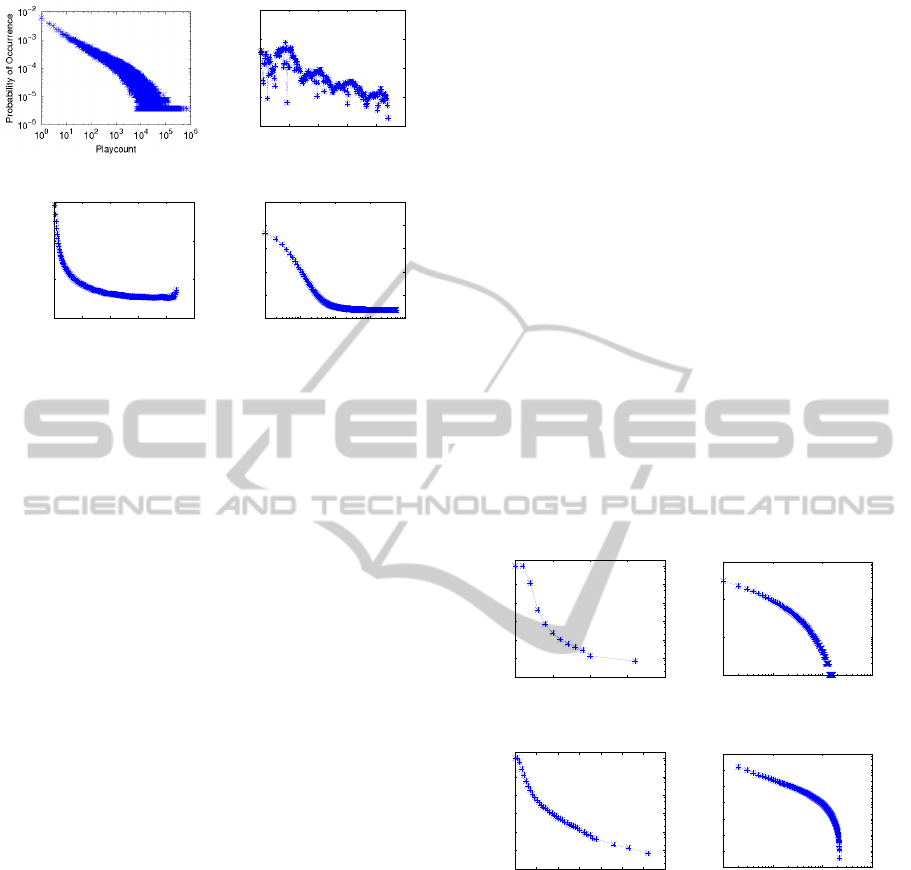
Figure 2: Interaction Analysis Metrics.
We start the interaction analysis in the Last.Fm ob-
serving the Figure 2 (a), which shows the Usage Time
per Lifetime for all users. Both metrics are calcu-
lated considering the number of distinct weeks. The
curve called “Ideal Scenario” represents the scenario
in which the usage time is equal to the lifetime, that
is, the users listen to songs in the system every week
during their lifetime. It is interesting to note that over
time users tend to use less frequently the system. In
the Last.Fm, as users “grow old” in the system, the
usage time tends to move away from the lifetime. In
this case, more decisive recommendation strategies
are necessary in order to keep users in the system.
Our next analysis concerns about the average in-
terval between system accesses. Figure 2 (b) presents
the Complementary Cumulative Distribution Func-
tion (CCDF) for these interval. Actually, as we do
not have the access log for the Last.Fm, we measure
the interval between consecutive listenings for each
user. We can observe that only 0.1% of the users
have an interval greater than 10 weeks, that is, the
vast majority of users have a small average interval
between listenings. Moreover, as the time interval in-
creases, the percentage of users decreases, following
two distinct linear regimes: at first, until about the
tenth week, the decay is sharp, from this point the de-
cay becomes smoother. This result, associated to that
presented in Figure 1 (a), shows that in Last.Fm new
users use the system frequently, but tend to abandon it
quickly instead of gradually reducing their system us-
age. This information is important for recommenders,
which can prioritize users with an interval between
listenings that is slightly more than 1 week, since they
will potentially abandon the system.
Figure 2 (c) shows the average number of songs
listened to by users over time. This average was cal-
culated using the values normalized by the maximum
number of songs listened to by each user in a single
week. As we can note, there is a noticeable decay in
the number of songs listened to over time. In general,
users tend to use the system less frequently. Again,
RSs may be relevant tools to reduce this decay in the
usage frequency.
From the analysis of this step we can better
discern the interaction between the users and the
Last.Fm, characterizing the latter as a system primar-
ily composed by activities performed by new users,
which present a downward consumption trend. Such
behavior may be related to some type of system limi-
tation, such as poor quality recommendations or lack
of some features in the system. Some of the metrics
defined in Section 3 could not be evaluated because
we do not have information about access in our data.
4.4 Users Profile Analysis
As described in Section 3, we divide our user profile
analysis into two steps: Diversity Analysis and Tem-
porization Analysis. The following subsections de-
scribe the main results found at each step. The under-
standing of this profile, along with the understanding
of the environment and the user interactions, previ-
ously obtained, comprises a set of extremely rich and
useful information for RSs.
4.4.1 Consumption Diversity
In Figure 3 (a) we present the diversity distribution
of items consumed by the users. We observe that the
vast majority of users (more than 90%) listen to up to
200 distinct songs, while few users have a very high
diversity of songs (i.e., above 5,000). This shows that
users in Last.Fm have a consume behavior focused on
WEBIST 2011 - 7th International Conference on Web Information Systems and Technologies
702
(a) DA-1.
100
120
140
160
180
0 50 100 150 200 250
Mean Diversity Per User
Lifetime (Weeks)
(b) DA-2.
0
0.05
0.1
0.15
0 50 100 150 200 250
Intersection Percentage
Temporal Distance (Weeks)
(c) DA-3.
0.75
0.8
0.85
0.9
0.95
1
1 10 100 1000 10000
Normalized Mean Relevance
Temporal Distance (Weeks)
(d) DA-4.
Figure 3: Diversity Analysis Metrics.
a small number of distinct items. Thus, it is possible
to draw distinct consumer profiles based on how di-
verse are their consumption historic, and RSs can pro-
vide recommendations with diversity levels according
to each consumer profile.
In addition, Figure 3 (b) presents the mean diver-
sity of consumed items per user over time. We ob-
served that users listen to, on average, 150 distinct
songs in their first weeks of life. However, as the users
“grow older” in the system, the diversity of consumed
items reduces significantly. This information may be
relevant to RSs, since it informs to them, at each mo-
ment, the limit of items diversity to be recommended.
We also analyzed the intersection between the
most relevant items consumed by users at distinct mo-
ments over time, as shown in Figure 3 (c). In this
case, we defined as relevance metric the frequency
with which each distinct track was listened to by each
user in each single week. After, we select for analy-
sis only the 100 most relevant tracks for each user in
each week. At the end, we calculate the intersection
percentage between each week X and all other further
weeks Y , and define a mean intersection percentage
per temporal distance between X and Y . We observe
that the percentage of intersection is very low even
between adjacent weeks (i.e., less than 15%). More-
over, this intersection quickly decreases over time,
obeying a power law and achieving a value close to
zero in 54 weeks. That is, within one year, the users
habit changes almost completely. At this way, we can
guide the recommenders about the percentage of mu-
sic currently consumed by each user that should be
changed at each different time interval (e.g., every
week, month or semester).
Finally, we show in Figure 3 (d) the analysis of rel-
evance variability of the consumed items over time.
Again, we defined the relevance metric as the fre-
quency with which each song was listened to at each
distinct week. The frequency of each pair user/song
was normalized by the highest frequency with which
the user listened to, in a single week, the song. Start-
ing from the first time a user listened to each song,
we calculated the average relevance of all songs at
each subsequent moments. Finally, we defined an av-
erage value of relevance for all pairs of user/music
observed in each of these subsequent moments. We
observe that the average song relevance tends to be
high at moments close to when they were listened to
for the first time. In the later moments, this relevance
decreases sharply, stabilizing at very low values. This
shows that a song remains interesting to the users only
for a short period of time, close to the first moment
it was listened to. Since Last.Fm is an environment
with a high consumption repetition, this relevance de-
cay suggests that repeated recommendations are more
prone to succeed at moments near to the first time that
each song was listened to.
4.4.2 Actions Temporization
10
−6
10
−5
10
−4
10
−3
10
−2
10
−1
10
0
0 5 10 15 20
CCDF of Users
Temporal Distance (Weeks)
(a) TA-1.
10
−3
10
−2
10
−1
10
0
10
0
10
1
10
2
10
3
Probability of Re−execution
Temporal Distance (Weeks)
(b) TA-2.
10
−6
10
−5
10
−4
10
−3
10
−2
10
−1
10
0
0 10 20 30 40 50 60 70
CCDF of Users
Temporal Distance (Weeks)
(c) TA-3.
10
−7
10
−6
10
−5
10
−4
10
−3
10
−2
10
−1
10
0
10
0
10
1
10
2
10
3
Probability of Return
Temporal Distance (Weeks)
(d) TA-4.
Figure 4: Actions Temporization Metrics.
First, we evaluate the distribution of stability pe-
riods in the Last.Fm, Figure 4 (a). For this analysis
we considered only the five most relevant songs (i.e.,
favorite songs) to each user at each distinct moment
over time. Further, we defined temporal distances for
each song considering the first time that it becomes
favorite for a user. For instance, the temporal distance
zero refers to the first moment in which a song figures
between the 5 favorite songs for a user. We can ob-
serve that, on average, almost all songs figure as the
5 most relevant ones for a user about two consecutive
weeks. However, in the third week (i.e., temporal dis-
A CHARACTERIZATION METHODOLOGY OF EVOLUTIONARY BEHAVIOR IN RECOMMENDER SYSTEMS
703
tance 2) only 2.5% of the songs remains among the
favorites. This clearly shows that the users preference
remains stable for a short period, generating a certain
dynamics in the set of favorite songs that should be
captured by RSs.
Our next evaluation is about the probability of re-
execution of the favorite songs. Thus, we present in
Figure 4 (b) the average probability of a favorite song
be listened to at each temporal distance starting from
the week in which it became favorite. We observed
that only a third of the songs that have become the
favorite are listened to again in the next week. More-
over, only 23% of them are listened to again after two
weeks. This decay follows a power law until the hun-
dredth week. These observations suggest that recom-
mending favorite songs after a few weeks would not
be a good strategy, since the users might be “satu-
rated” quickly. Another interesting point is that, from
the hundredth week, the probability of a user listen to
their favorite songs is almost zero, which shows that
older songs may become “forgotten” by the users.
In Figure 4 (c) we show the results for the satu-
ration time analysis. For this analysis we measured
how long, on average, a user can continually listen to
songs that have been, at some point, between the 5
favorites. We can observe that the probability of any
music been listened to by two (98%) or three (62%)
consecutive weeks, after to become one of the five
favorites is much higher than during more than four
weeks (6% only). This shows that, in general, users
are interested in listening to a song for a short period
of time, presenting subsequently a significantly lower
interest for these songs.
We also evaluate the average probability of return
for the favorite songs of each user. For such analysis,
we evaluate the probability of the weekly most rele-
vant song X of each user to figure between his 100
favorite songs at each distinct week after the first time
X has no longer been listened, defined as the temporal
distance zero. Figure 4 (d) presents the distribution of
the average probability of return for all favorite songs
at each moment. We note that just over 15% of these
songs are listened to a week after the first week they
are not observed between the 100 most relevant songs.
The probabilities present a descendant behavior that
also follows a power law for temporal distances up to
approximately 150 weeks. This shows that, in fact,
over time the songs become “forgotten”. Therefore,
we have two important implications for RSs. The first
one is that once the user stops listening to a favorite
song, it will hardly return to listen to it in the near fu-
ture. The second implication is that in a distant future
such songs could be a good way to diversify the rec-
ommendation to users.
The analysis of this step allows us to define
Last.Fm users as presenting a not very diversified con-
sumption, besides defining a very dynamic behavior,
quickly varying the set of favorite songs. In addition,
each song is most often consumed at moments close
to the first time users listened to them. We also note
that such users listen to the same song during a short
and continuous period of time, and once they stop lis-
tening to it, they will hardly listen to it again.
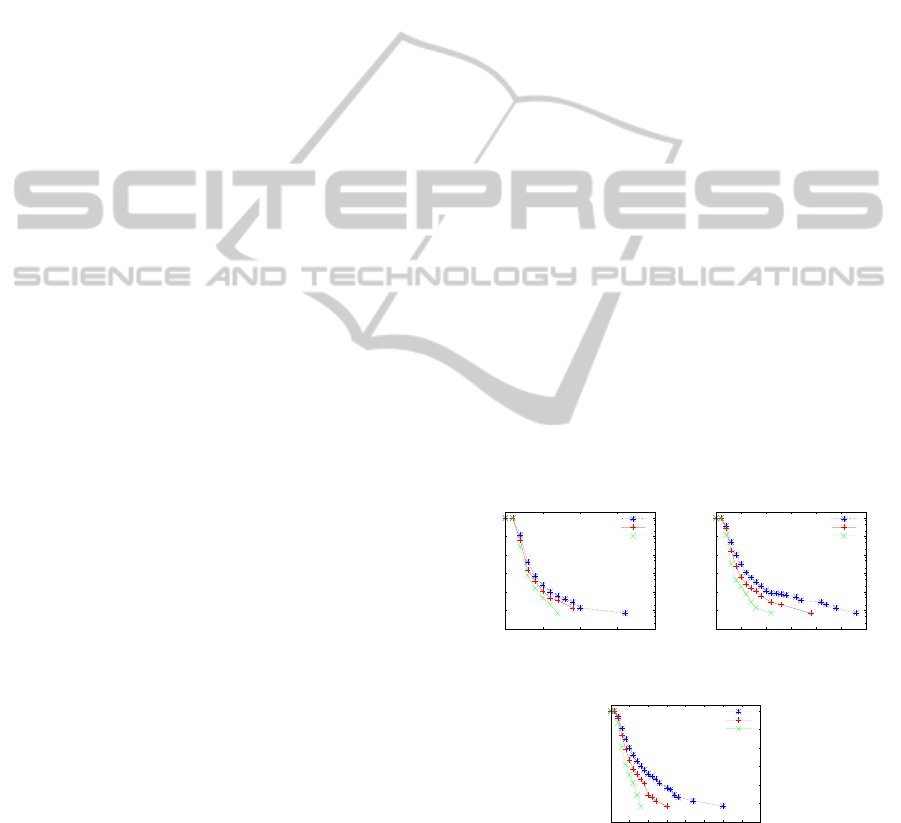
Finally, it is important to note that several of the
metrics analyzed in this section may be reevaluated
varying both temporal granularities and distinct sizes
of ordered sets. Thus, it is possible to contrast the evo-
lutionary behavior considering different perspectives
of analysis. In the plots of Figure 5, for example, we
present an analysis of the distribution of stability pe-
riod for various temporal granularities, aggregated by
different sizes of ordered sets. An interesting aspect
to note is that as we increase the temporal granularity,
the decay of probabilities is more pronounced, show-
ing that in longer periods of time there is a larger di-
versity of items consumed by users. We also note that,
as we increase the size of the analyzed set, the differ-
ences of probabilities between major and minor tem-
poral granularities tend to be higher. This shows that
larger sets of favorite items are more stable at lower
temporal granularities. Thus, it would be possible to
define distinct recommendation strategies by combin-
ing the user behavior in distinct temporal granulari-
ties, as well as the sizes of ordered sets, in order to
provide more precise recommendations.
10
−6
10
−5
10
−4
10
−3
10
−2
10
−1
10
0
0 5 10 15 20
CCDF of Users
Temporal Distance (Weeks)
Week
Biweek
Month
(a) Top-5.
10
−6
10
−5
10
−4
10
−3
10
−2
10
−1
10
0
0 5 10 15 20 25 30
CCDF of Users
Temporal Distance (Weeks)
Week
Biweek
Month
(b) Top-25.
10
−6
10
−5
10
−4
10
−3
10
−2
10
−1
10
0
0 5 10 15 20 25 30 35 40
CCDF of Users
Temporal Distance (Weeks)
Week
Biweek
Month
(c) Top-50.
Figure 5: Analysis of AT-1 Metric for distinct Top-N.
In general, the information from each step of our
methodology can assist in choosing the most appro-
priate recommendations techniques for each scenario.
For Last.Fm, for example, we observed that the Cold
WEBIST 2011 - 7th International Conference on Web Information Systems and Technologies
704

Start issue is more prominent than the problem of
sparsity. Therefore, techniques such as those pro-
posed in (Schein et al., 2002) are preferable. More-
over, we note that a model based only on the top-N
musics listened to by a user may be more promis-
ing than to consider all the musics he listened to in
a given period, since the musics diversity is low and
there is a high repetition rate in the system. Consid-
ering the challenge of temporal evolution, we found
that smaller temporal granularities are better both to
model user behavior and to update the “knowledge”
of the RSs, since users in the Last.Fm are highly dy-
namic, changing the set of favorite songs quickly. Fi-
nally, it’s worth to note that, in this domain, the diver-
sification of the recommendation is an issue bigger
than the accuracy, since users often consume items
that they already know. Thus, techniques to diversify
recommendation like those presented in (Zhang and
Hurley, 2008) are particularly relevant to Last.Fm.
A point to be highlighted is the need to validate
these observations and conclusions. For this purpose,
we adopted as validation strategy the implementation
of a new RS method, which incorporates many of the
observations raised up, and the subsequent contrast
of results between the proposed technique and tradi-
tional ones. This strategy is currently in development
and its application on the Last.fm represents our next
step.
5 CONCLUSIONS AND FUTURE
WORKS
In this work, we present a methodology for evolution-
ary characterization of users and applications in order
to provide subsidies for the proposal of new recom-
mendation techniques, as well as for proper changes
in traditional techniques. Despite the relevance of the
temporal evolution over the recommendation, we did
not find studies that aim to understand and character-
ize such evolution. In turn, our methodology is useful
for assessing practical issues about RSs, usually dis-
regarded in the literature.
In order to verify the applicability of our method-
ology, we evaluate as a case study the music system
Last.Fm. Measurements of a not closed set of char-
acteristics pertinent to recommendation domains al-
lowed us to better understand the Last.Fm. This is an
environment with a wide diversity of items, as well as
a growing number of users and new items over time.
However, Last.Fm fails to keep its users for a long
time, becoming anchored by new users, who present
a low and declining system usage rate. These findings
allow us to identify a series of challenges for recom-
mender systems, such as increasing sparsity of the do-
main, little information about the users, and the Cold
Start problem.
The relevance of this type of observation goes be-
yond the understanding of the environment. It allows
us to better identify which recommendation tech-
niques would be more appropriate for each type of en-
vironment, and better adjust RSs in order to provide
better recommendations. For instance, for Last.FM
we verified that specific techniques that address the
problems of Cold Start and low diversity in recom-
mendations are more relevant.
As future work, we aim, at first, to validate our
conclusions. For such, we are implementing a new
RS method, which incorporates several of the obser-
vations raised up, that will be applied to the Last.fm.
Results of this new technique will be contrasted with
traditional ones, in order to verify the relevance of
these new information. Later, we aim to analyze other
metrics, as well as to apply our methodology in other
recommendation scenarios. .
ACKNOWLEDGEMENTS
This work was partially supported by CNPq, CAPES,
FINEP, Fapemig, and INWEB.
REFERENCES
Abbasse, Z. and Mirrokni, V. (2007). A recommender sys-
tem based on local random walks and spectral meth-
ods. In Proceedings of the 9th WebKDD and 1st SNA-
KDD, pages 102–108. Springer.
Adomavicius, G., Sankaranarayanan, R., Sen, S., and
Tuzhilin, A. (2005). Incorporating contextual infor-
mation in recommender systems using a multidimen-
sional approach. ACM Transactions on Information
Systems (TOIS), 23(1):103–145.
Adomavicius, G. and Tuzhilin, A. (2001a). Expert-driven
validation of rule-based user models in personaliza-
tion applications. Data Mining and Knowledge Dis-
covery, 5(1):33–58.
Adomavicius, G. and Tuzhilin, A. (2001b). Extending rec-
ommender systems: A multidimensional approach.
In Proceedings of the Workshop on Intelligent Tech-
niques for Web Personalization (ITWP2001), pages 4–
6.
Adomavicius, G. and Tuzhilin, A. (2005). Toward the
next generation of recommender systems: A sur-
vey of the state-of-the-art and possible extensions.
IEEE transactions on knowledge and data engineer-
ing, 17(6):734–749.
A CHARACTERIZATION METHODOLOGY OF EVOLUTIONARY BEHAVIOR IN RECOMMENDER SYSTEMS
705

Anderson, C. (2006). The long tail: How endless choice is
creating unlimited demand. Random House Business
Books.
Burke, R. (2002). Hybrid recommender systems: Survey
and experiments. User Modeling and User-Adapted
Interaction, 12(4):331–470.
Cremonesi, P. and Turrin, R. (2010). Controlling Consis-
tency in Top-N Recommender Systems. In 2010 IEEE
International Conference on Data Mining Workshops,
pages 919–926. IEEE.
Koren, Y. (2009). Collaborative filtering with temporal dy-
namics. In Proceedings of the 15th ACM SIGKDD,
pages 447–456. ACM New York, NY, USA.
Lathia, N., Hailes, S., and Capra, L. (2009). Evaluating col-
laborative filtering over time. In In ACM SIGIR Work-
shop on the Future of IR Evaluation, Boston, USA.
Lathia, N., Hailes, S., Capra, L., and Amatriain, X. (2010).
Temporal diversity in recommender systems. In SI-
GIR ’10: Proceeding of the 33rd international ACM
SIGIR conference on Research and development in in-
formation retrieval, pages 210–217, New York, NY,
USA. ACM.
McSherry, D. (2002). Diversity-conscious retrieval. Ad-
vances in Case-Based Reasoning , pages 27–53.
Schein, A. I., Popescul, A., Ungar, L. H., and Pennock,
D. M. (2002). Methods and metrics for cold-start
recommendations. In Proceedings of the 25th SIGIR,
pages 253–260. ACM Press.
Stern, D. H., Herbrich, R., and Graepel, T. (2009). Match-
box: large scale online bayesian recommendations.
In Proceedings of the 18th WWWW, pages 111–120,
New York, NY, USA. ACM.
Wu, J. and Li, T. (2008). A modified fuzzy c-means algo-
rithm for collaborative filtering. In Proceedings of the
2nd KDD Workshop on Large-Scale Recommender
Systems and the Netflix Prize Competition, pages 1–
4. ACM.
Zhang, M. and Hurley, N. (2008). Avoiding monotony: im-
proving the diversity of recommendation lists. In Pro-
ceedings of the ACM RS, pages 123–130. ACM.
WEBIST 2011 - 7th International Conference on Web Information Systems and Technologies
706
