
BUSINESS PROCESS MODEL IMPROVEMENT BASED ON
MEASUREMENT ACTIVITIES
Laura Sánchez-González, Francisco Ruiz, Félix García and Mario Piattini
Alarcos Research Group, TSI Department, University of Castilla La Mancha
Paseo de la Universidad, nº4, 13071, Ciudad Real, Spain
Keywords: Business process, Measurement, Continuous improvement, BPMN.
Abstract: The current importance of Business Process improvement lies in the fact that it is a key aspect for
organizational improvement. Since business process improvement can be dealt from different perspectives,
we propose the use of measurement as a technique by which to collect information concerning the quality of
the process. We have specifically applied measures to the design stage of the business process lifecycle,
which signifies measuring conceptual models. Measurement in Design and Analysis lifecycle stage has
several advantages, principally in that it is a means to avoid the propagation of errors to later stages, in
which their detection and correction may be more difficult. We therefore propose certain steps for business
process model improvement, based on measurement activities (measurement, evaluation, and redesign).
These activities have been applied to a real hospital business process model. The model was modified by
following expert opinions and modelling guidelines, thus leading to the attainment of a higher-quality
model. Our findings clearly support the practical utility of measurement activities for business process
model improvement.
1 INTRODUCTION
In recent years, business process (BP) modelling and
improvement has become an important means of
ensuring changes in an organization’s structure and
functioning, thus leading to the creation of a more
competitive and successful enterprise (Damij, Damij
et al. 2008). BP influences product quality and
customer satisfaction, which are fundamental
aspects in a market environment, and enterprises are
therefore forced to improve their processes in order
to improve products and services (Cardoso 2006).
The first step towards improving business
processes is to collect any data regarding their
design, deadlocks, bottlenecks, etc. Measurement is
a good means of collecting this kind of data, and
serves at least the following three purposes:
understanding, control and improvement (Park,
Goethert et al. 1996). The use of measurement
information therefore makes it possible for
organizations to learn from the past in order to
improve their performance and achieve better
predictability over time.
A business process is a complex entity with a
characteristic lifecycle. In our work we consider the
approach defined by Weske (Weske 2007), who
organizes the lifecycle in a cyclic structure with
logic dependences between the design and analysis,
configuration, enactment, and evaluation stages. We
focus on the first stage, design and analysis, in
which the principal activity is that of process
modelling. The main purpose of design and analysis
is to capture the business schema and general
procedures (Sparks 2000). The conceptual models
produced in this stage are first required to be
intuitive and easily understandable in order to
facilitate communication among stakeholders.
Measuring and improving BP models has several
advantages, principally that of avoiding the
propagation of errors or bad-structures to later
lifecycle stages, in which corrections and
modifications may involve a high economic cost and
effort (Wand and Weber 2002).
Measures for conceptual models deal with the
static properties of BP and are defined upon the BP
model at the time of the design. Several initiatives
concerning the measurement model have recently
been published, owing to the advantages of
improving business processes in this stage. Most of
the measures published to date have been collected
104
Sánchez-González L., Ruiz F., García F. and Piattini M..
BUSINESS PROCESS MODEL IMPROVEMENT BASED ON MEASUREMENT ACTIVITIES.
DOI: 10.5220/0003462201040113
In Proceedings of the 6th International Conference on Evaluation of Novel Approaches to Software Engineering (ENASE-2011), pages 104-113
ISBN: 978-989-8425-57-7
Copyright
c
2011 SCITEPRESS (Science and Technology Publications, Lda.)
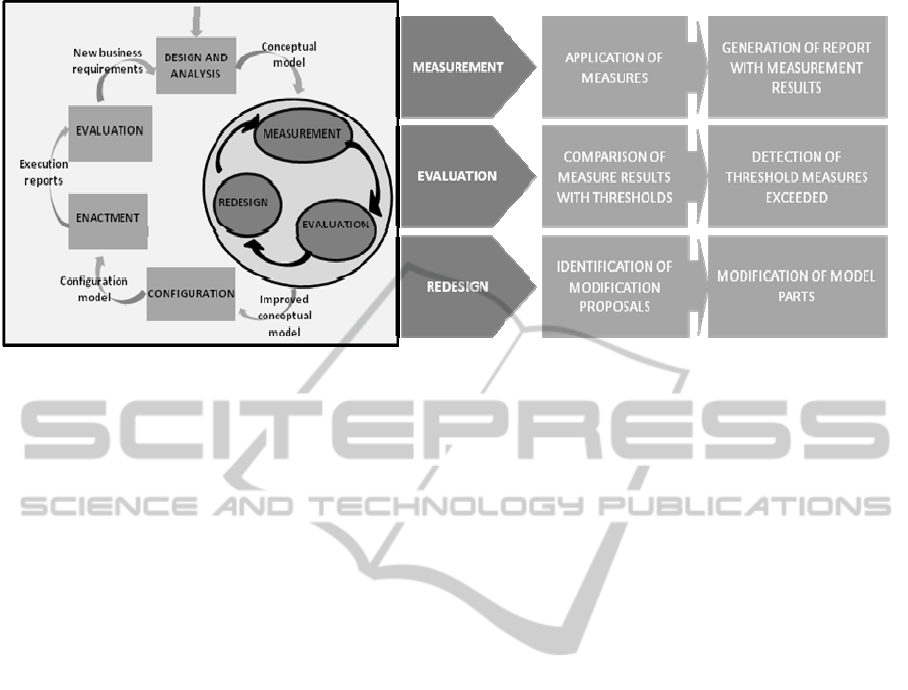
Figure 1: Improvement activities in BP lifecycle.
in (Sánchez-González, García et al. 2010b). This
work shows that there is no consensus among
researchers as to which measurable concepts it is
most interesting to measure (complexity,
structuredness, cohesion, coupling, etc). It also
highlights that most of the proposals have not been
empirically validated. This lack of validation
particularly emphasises the need for research in this
area. The work presented herein contributes to the
maturity of BP measurement through the collection
of measures and the demonstration of their practical
utility in an experience report.
The principal idea behind our proposal is to
apply measurement during the early stages of the
lifecycle, the design and analysis stage, in order to
obtain feedback controlled by measures and thereby
achieve a higher-quality implementation of the
process, with a lower value of complexity, therefore
making it easier to maintain (Mendling 2008). The
measurement process is divided into three activities:
applying measures, evaluating measurement results
and redesigning the model. The pragmatic idea of
these activities is to discover unsafe design,
hazardous structures or unexpected. Finally, one
critical aspect of the improvement activities is to
demonstrate that they are potentially useful in
practice. We therefore present an experience report
of the application of improvement activities to a real
hospital business process.
The remainder of the paper is as follows. In
Section 2 we describe the improvement activities in
which measures were applied, evaluate the
measurement results and redesign the model. In
Section 3 we present an experience report of the
application of these activities to a real business
process, specifically a hospital business process. In
Section 4, we describe some implications and
limitations of this research. Finally, Section 5 shows
our conclusions and presents topics for future
research.
2 BUSINESS PROCESS MODEL
IMPROVEMENT
In this article, we propose certain activities for
business process model improvement. The principal
idea is to collect as much information as possible
about the static properties of the business process.
The activities are: applying measures collected in
previous works, evaluating measurement results
against threshold values and redesigning the model.
These three activities can be executed in a cyclic
manner, signifying that multiple iterations can be
run to obtain a high-quality model. This idea is
depicted in greater detail in Figure 1.
In Figure 1 the lifecycle stages are represented as
a square and the improvement activities as ellipses.
The design and analysis stage initially produces a
conceptual model. This model serves as input for the
improvement activities. The improvement of the
model can be carried out in several iterations of the
3 activities (measurement, evaluation and redesign).
These activities can be introduced in the BP
lifecycle as an extended stage, which can enrich the
final product. After the configuration stage, the
execution model is enacted through the generation of
log files, which describe all the steps followed to
achieve the business goals. These log files can be
measured (processed) in order to discover certain
important aspects such as execution time, deadlocks,
etc. The measurement initiatives for improvement in
the execution stage are described in (Delgado, Ruiz
BUSINESS PROCESS MODEL IMPROVEMENT BASED ON MEASUREMENT ACTIVITIES
105

et al. 2009). The evaluation of these execution
reports implies the generation of new business
requirements which had not previously been
considered.
2.1 Measures for Business Process
Conceptual Models
In recent years, the number of measurement
approaches for conceptual models has grown
considerably owing to the advantage of improving
business processes in the early phases. BP model
measures are used to quantify structural aspects of
models, which signifies measuring their internal
quality. This internal quality is understood as the
model’s total number of characteristics from an
internal view, and this is measured and evaluated
against the internal quality requirements (ISO/IEC
2001). Internal quality (quality in general) can be
seen from different points of view, and should
therefore be quantified with more than one measure
in order to obtain as much information as possible
with regard to the model. For example, model
complexity cannot be measured solely with the
Control-flow Complexity (CFC) measure, because
this measure only takes into account decision node
elements.
As we mentioned, various measures are found in
literature (Sánchez-González, García et al. 2010b),
and Table 1 specifically shows references to their
measurement initiatives and provides a brief
description of them.
However, it is also important to consider external
quality in conceptual models. External quality refers
to the total number of characteristics in the model
from an external view (ISO/IEC 2001), such as how
understandable the models are, how difficult it is to
modify them, etc. From the point of view of a top-
down quality SEQUAL framework (Krogstie, Sindre
et al. 2006), understanding is an enabler of
pragmatic quality, which relates to model and
modelling and its ability to enable learning and
action. In order to clarify this idea, Figure 2 shows
the relationship between internal and external
quality and some examples of measurable attributes.
Most authors have carried out experiments
focused on the relationship between measures and
external quality attributes: understandability and
modifiability. These belong to the more general
concepts of usability and maintainability
respectively (ISO/IEC 2001).
To the best of our knowledge, very few articles
concerning the relationship between measures for
internal quality and measures for external quality
Table 1: Proposals of measures for business process
models.
Measure Description
Coupling, cohesion and
connectivity level
(Vanderfeesten, Cardoso et
al. 2007; Vanderfeesten,
Reijers et al. 2008)
Cohesion and coupling
between activities and cross
connectivity in the
relationship between nodes
and directed arcs.
Structural complexity
(Rolón, García et al. 2006)
Measures related to the
number of different elements
of BPMN models.
Error probability (Mendling
2008)
Number of nodes, diameter,
gateway mismatch, depth,
density, average and max
connector degree, cyclicity,
sequentiality and
separability.
Control flow complexity
(Cardoso 2006)
Related to the number of
OR-split, AND-split and
XOR-split
Entropy (Jung 2008) Uncertainty or variability of
workflow process models
Structuredness (Laue and
Mendling 2009)
Number of unstructured parts
Complexity (Meimandi
Parizi and Ghani 2008)
Activity, control-flow, data-
flow and resource
complexity
Goodness (Huan and Kumar
2008)
Goodness of models
regarding execution logs
have been published to date, although some research
has been published in (Rolón, Cardoso et al. 2009;
Rolon, Sanchez et al. 2009; Sánchez González,
García et al. 2010), and these works obtained a
subgroup of measures which can be considered as
good indicators for understandability and
modifiability. This subgroup of measures is shown
in Table 2. The application of this subgroup of
measures is produced in a pair (measure, result),
which should be reported in a document in order to
be used in next activity: evaluation.
Figure 2: Internal and external quality in conceptual
models.
ENASE 2011 - 6th International Conference on Evaluation of Novel Software Approaches to Software Engineering
106

2.2 Evaluation of Measurement Results
The evaluation of measurement results involves
providing an objective assessment of them.
Numerical results only offer information in terms of
comparison between models rather than an
independent interpretation. For example, given two
process models, it is possible to discover not only
which of them is best in the relative terms of a
specific measure, but whether the values are
acceptable or not. It is therefore necessary to
consider the threshold or limit values in order to
indicate for what specific value the measure’s
quality begins to decline.
Table 2: Empirically validated measures and their
relationship with understandability and modifiability.
Measure Description U
*
M
*
Measures of Rolón (Rolón, García et al. 2006)
TNSF Total Number of sequence flows X
TNE Total Number of events X
TNG Total Number of gateways X
NSFE Number of sequence flows from
events
X
NMF Number of message flows X
NSFG Number of sequence flows from
gateways
X X
CLP Connectivity level between
participants
X
NDOOut Number of data objects which
are outputs of activities
X
NDOIn Number of data objects which
are inputs of activities
X
CLA Connectivity level between
activities
X
Measures of Cardoso (Cardoso 2006)
CFC Control flow complexity. Sum
over all gateways weighted by
their potential combinations of
states after the split
X X
Measures of Mendling (Mendling 2008)
Number of
nodes
Number of activities and routing
elements in a process model
X
Gateway
mismatch
Sum of gateway pairs that do not
match each other, e.g. when an
AND-split is followed by an OR-
join
X X
Depth Maximum nesting of structured
blocks in a process model
X
Connectivity
coefficient
Ratio of total number of arcs in a
process model to its total number
of nodes
X
Density Ratio of total number of arcs in a
process model to the
theoretically maximum number
of arcs
X
Sequentiality Degree to which the model is
constructed from pure sequences
of tasks
X X
Various proposals for the extraction of threshold
values exist in literature, principally in the Software
Engineering field. Some proposals for thresholds are
derived from experience (McCabe 1976; Nejmeh
1988; Coleman, Lowther et al. 1995), but the lack of
scientific support has led to disputes about their
values. Some authors, on the other hand, have used
statistical techniques to obtain thresholds. For
example, Shatnawi (Shatnawi 2010) extracted
thresholds for Object Oriented (OO) code measures
in order to study the relationship between OO and
error-severity categories. This author also validated
the Bender method (Bender 1999) and found that
there are effective thresholds for the measures
analyzed.
With regard to business process measurement,
we have attempted to extract threshold values for
some measures in previous works. This is the case of
Control-flow complexity measure, structural
complexity and error probability measures, which
were used to apply the Bender method in order to
extract thresholds. These works were published in
(Sánchez-González, García et al. 2010a; Sánchez-
González, Ruiz et al. 2011). Table 3 shows extracted
thresholds for some empirically validated measures.
This table divides the domain of the measure into 4
different groups, depending on the level of
efficiency: “very efficient”, “fairly efficient”, “fairly
inefficient” and “very inefficient”.
2.3 Redesign of Business Process
Models
In this section, we focus on modifying some parts of
the model in order to improve its general quality.
Those parts that are candidates for alteration have
been identified through the use of measures. For
example, let us imagine that we are analyzing the
results of the CFC measure in a specific model, and
we obtain a numerical value which is higher than the
threshold: “If CFC is higher than 44, the model is
difficult to understand”. These results indicate that
the number of decision nodes must be reduced in the
model, since it may be difficult for stakeholders to
understand.
Nevertheless, modifying the model using only
the information collected from measures and
thresholds can be quite difficult. Some guidelines
therefore exist to assist modellers in this task. In
literature, it is possible to discover various
guidelines for inexpert modellers, whose purpose is
to obtain higher-quality models that can ensure a
more reliable execution. Mendling et al. (Mendling,
Reijers et al. 2010) proposed seven pieces of advice
BUSINESS PROCESS MODEL IMPROVEMENT BASED ON MEASUREMENT ACTIVITIES
107

for modellers (denominated as 7PMG) which are
built on strong empirical insight. This advice is
related to the maximum number of nodes before
decomposition, number of events, OR-routing
elements, routing paths per element or the use of a
verb-object activity label. On the other hand, Becker
et al. (Becker, Rosemann et al. 2000) define certain
guidelines of modelling (GoM), which are
specifically six general techniques for adjusting
models to the perspectives of different types of user
and purposes. To illustrate the used of these
guidelines, let us imagine the following example. If
the measure “total number of events” is higher than
20 (very inefficient), 7PMG advises that the use of
“one start and one end event” is the best way to
reduce the measure value.
Redesign therefore involves changing those
specific parts of the model with low quality detected
by measures. Modelling guidelines can also help to
ensure the quality of the model but a previous
measurement effort is necessary to identify any
potential problems.
Table 3: Thresholds for business process model measures.
1: very
inefficient
2: fairly
inefficient
3: fairly
efficientt
4: very
efficient
Understandability
Nºnodes 65 50 37 31
GatewayMismatch 29 16 6 1
Depth 4 2 1 1
Coefficient of
connectivity
1,7 1,1 0,6 0,4
Sequentiality 0,1 0,35 0,6 0,7
TNSF 72 49 34 20
TNE 20 12 7 2
TNG 17 10 5 0
NSFE 28 13 4 0
NMF 27 15 7 1
NSFG 40 22 11 0
CLP 7,5 4,23 2,2 0,2
NDOIN 31 44 4 0
NDOOUT 23 11 3 0
CFCxor 30 17 8 1
CFCor 9 4 1 0
CFCand 4 2 0 0
Modifiability
GatewayMismatch 46 22 4 1
Densitiy 0,6 0,22 0,00
1
0
Sequentiality 0 0,18 0,6 0,86
NSFG 25 13 9 0
CLA 0,53 0,875 1,1 1,3
CFCxor 27 16 8 1
CFCor 9 4 1 0
CFCand 6 2,3 0 0
3 EXPERIENCE REPORT:
HOSPITAL PROCESS
In order to demonstrate the practical utility of this
proposal, we describe an experience report which
was developed in the General Hospital of Ciudad
Real (GHCR) in Spain. First, a specific work group
was created, consisting of specialists in modelling
tasks (Software Engineers) and health professionals
at the hospital:
a) Those responsible for processes: the
assistant director of nursing and the person
responsible for hospital’s admissions units.
b) Collaborators: head of human resources and
finances, head of computer services and
head of out-patients’ healthcare.
The work group then modelled various processes
which had previously been selected by the hospital’s
managerial and quality staff, although in this paper
we shall focus on the “Incorporation of a new
employee” (INE) process, which includes the
training plan, information and suitability of those
people involved in the hospital in order to facilitate
their integration into the new job. The process model
is shown in Figure 3.
This process was selected as a low-complexity
process, although the services provided are very
important. It is a purely administrative process (it is
not related to patient care), but moves a large
number of users (in 2007, the hospital staff consisted
of 2.600 workers, and 6989 new contacts were made
with regard to substitutions and new incorporations).
This process involves different professional
categories: doctors, pharmacists, nurses,
psychologists, administrative and technical staff and
others. Specific process characteristics were the
following:
a) Mission: to promote the organization of the
INE process, which includes a plan for
training, information and adaptation of the
people involved to the hospital requirements
in order to facilitate their integration into the
new job.
b) Limits: the INE process starts when the
professional comes to the hospital and
finishes when he/she is incorporated into the
new job.
c) Clients: new professionals
d) People responsible: those responsible for
nursing, medical aspects and management.
e) Participants: new professionals in hospital,
human resources, computer services,
lingerie, pharmacy, prevention services,
nursing and management service.
ENASE 2011 - 6th International Conference on Evaluation of Novel Software Approaches to Software Engineering
108
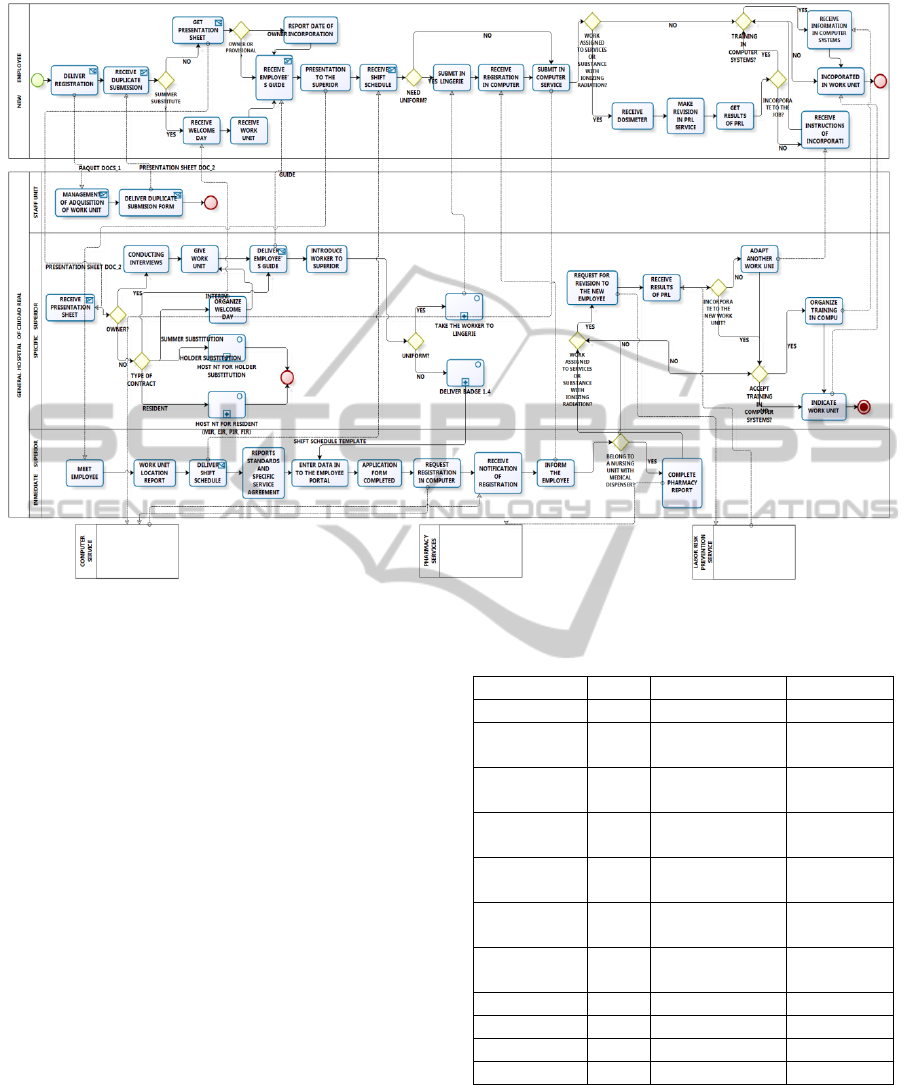
Figure 3: BPMN model for the Incorporation of the New Employee (INE) hospital process.
f) Suppliers: human resources, provisions,
maintenance, training and information
systems.
The results of the application of the
improvement activities are described in the
following sub-sections:
3.1 Applying Improvement Activities
The design of the INE process model is represented
in BPMN (OMG 2006) (Figure 3), the de facto
standard for BP modelling. This conceptual model
was a candidate for improvement. We therefore
applied the three measurement activities previously
presented.
A) Measurement
We applied most of the measures published to date,
particularly those measures which had been
empirically validated. It was not possible to apply all
of them owing to the absence of certain elements in
this specific model. The results obtained are shown
in Table 4 (pair measure/result).
Table 4: Measurement results for the INE process.
Measure Result Understandability Modifiability
Nº of nodes 59 Fairly inefficient -
Density 0,02 -
Fairly
efficient
Sequentiality 0,396 Fairly inefficient
Fairly
inefficient
Connectivity
coefficient
1,54 Very efficient -
Mismatch
connector
16 Fairly inefficient
Fairly
inefficient
Control flow
complexity
22 Fairly inefficient
Fairly
inefficient
CLA 0,61 -
Very
inefficient
CLP 3 Fairly efficient -
TNE 5 Fairly efficient -
NSF 73 Very inefficient -
NMF 18 Fairly inefficient -
B) Evaluation
After obtaining the measurement results, we
evaluated them by following the threshold values
shown in Table 3. The conclusions were as follows:
Number of nodes is 59, so the model is fairly
inefficient in understandability tasks
BUSINESS PROCESS MODEL IMPROVEMENT BASED ON MEASUREMENT ACTIVITIES
109

Density is 0.02, so the model is fairly efficient in
modifiability tasks
Sequentiality is 0.396, so the model is fairly
inefficient in understandability and modifiability
tasks
Connectivity coefficient is 1.54, so the model is
very inefficient in understandability tasks
Mismatch connector is 16, so the model is fairly
inefficient in understandability and modifiability
tasks
Control flow complexity is 22, so the model is
fairly inefficient in understandability and
modifiability tasks
CLA is 0.61, so the model is very inefficient in
modifiability tasks
CLP is 3, so the model is fairly efficient in
understandability tasks
TNE is 5, so the model is fairly efficient in
understandability tasks
TNSF is 73, so the model is very inefficient in
understandability tasks
NMF is 18, so the model is fairly inefficient in
understandability tasks
After the evaluation, we detected some potential
parts for alteration. For example, number of nodes
was a very high value, and could have compromised
the understandability of the model. The same applies
to connectivity coefficient, control-flow complexity,
CLA and TNSF, which obtained the worst results of
the measurement activity. On the other hand,
density, CLP and TNE obtained acceptable results
and did not need to be analyzed for further
improvement initiatives. These results guided us in
our definition of some proposals for redesign.
C) Redesign
After the selection of those parts of the INE model
that are potential elements for modification, the
redesign activity is carried out. This is the most
critical activity, since it depends on the successful
implementation of improvement activities.
Redesign was classified into two different
groups: changes proposed by specialists in
modelling tasks following guidelines of modelling
and changes proposed by health professionals.
Changes proposed by Health Professionals
Professionals at the hospital proposed certain
modifications which implied some differences in the
way in which some parts of the model were
designed.
The work group created to model tasks proposed
changes which produced several semantically
equivalent models. The Dephy method (Linstone
and Turoff 2002), was used to allow the work group
to select the most suitable changes. Each of these
changes produces a different version to the original,
specifically 4 different versions are generated:
A) The “belongs to a nursing unit with medical
dispenser” decision node was eliminated in
the immediately superior lane.
B) Some activities were added: “complete
pharmacy report” “send registration request
to pharmacy services”, “receive registration
in computer services”, “inform the
employee” in the immediately superior
lane.
C) The “belongs to a nursing unit” decision
node was eliminated and another decision
node was added in order to distinguish two
categories: planned or urgent in specific
superior lane.
D) Combination of version B and C.
The work group’s opinion and a first
application of the measures revealed that
version D is the best option, and we
Figure 4: Model of INE process applying changes proposed by health professionals.
ENASE 2011 - 6th International Conference on Evaluation of Novel Software Approaches to Software Engineering
110
selected it as the candidate for the improved
conceptual model. The results of these changes are
depicted in Figure 4. This change obtained better
results with regard to measures in comparison to the
original model. Table 5 shows the measures
analyzed and the results obtained. The measurement
values for the original model are shown in brackets
for the purpose of comparison. This comparison
shows an evident improvement in the model quality.
Table 5: Measure values of the improved model generated
by health professionals.
Measure Result
Mismatch connector 16 (15)
Control flow complexity 22 (21)
CLA 0,61(0,64)
NSF 73 (71)
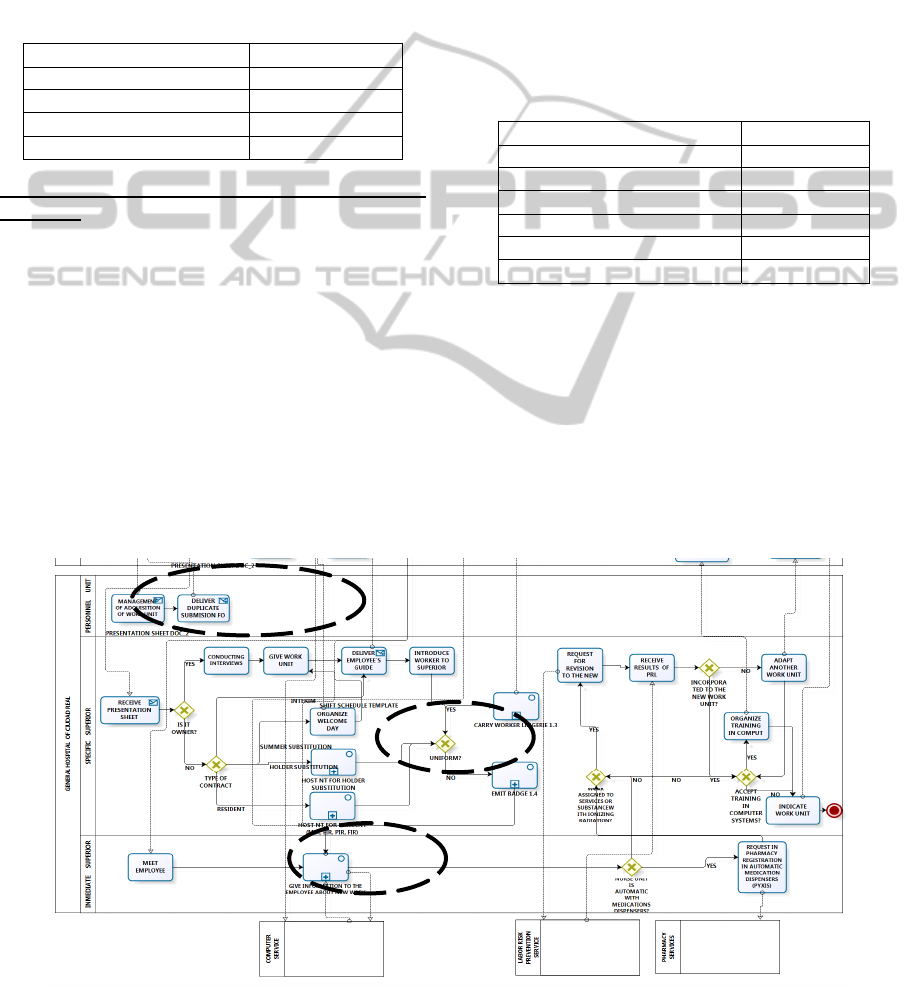
Changes Proposed following Guidelines of
Modeling
On the other hand, the changes proposed by
modelling experts was based on the guidelines for
modellers published in (Mendling, Reijers et al.
2010). The following modifications were therefore
applied to the INE process model:
1. To reduce number of nodes:
a. Decompose a model with more than
50 elements.
b. Use one start and one end event.
2. To reduce TNF:
a. The elimination of some nodes
reduces the number of sequence
flows.
3. To reduce NMF:
a. The grouping of activities in a
subprocess reduces the number of
messages.
4. To reduce control-flow complexity and
mismatch connector:
a. Avoid OR routing elements.
5. A further improvement that is not taken into
account in the measures is “use verb object
activity labels”.
The proposed changes to the model are depicted in
Figure 5, and the measures’ improved results are
described in Table 6.
Table 6: Measure values of the improved model generated
by IT expert.
Measure Result
Nº of nodes 48(59)
Sequentiality 0,47(0,396)
Mismatch connector 10(16)
Control flow complexity 19(22)
TNE 3(5)
N
SF 63(73)
D) Selection of the improved Business Process
Design
The application of measures in both alternatives
allowed us to discover that the most acceptable
design is that obtained by professionals in
modelling. Specifically, 35% of the measures
analyzed improved their values when following
guidelines for modelling, as opposed to 23% of the
measures obtained when following the advice of
professionals in the health sector.
Figure 5: Version of INE process, including changes proposed following guidelines of modelling.
BUSINESS PROCESS MODEL IMPROVEMENT BASED ON MEASUREMENT ACTIVITIES
111

This signifies that the conceptual model depicted in
Figure 5 obtained better measurement results, thus
suggesting that the model is a good choice and can
increase the probability of obtaining a correct
process enactment.
4 IMPLICATIONS AND
LIMITATIONS
In this section we highlight some of the implications
and limitations of our research. In the previous
section, we described the process used to improve
conceptual models. In the first part, some measures
were applied to an INE process model, obtaining
certain measurement results. One limitation is
related to applied measures. Although more
measurement initiatives have been published, it is
not possible to apply them because of their lack of
empirical validation. This is an important
disadvantage in business process measurement and
may have limited our research.
On the other hand, measurement values were
assessed by following thresholds in order to guide us
in redesigning tasks. In a real situation
(Incorporation of a new employee) we had two
different initiatives for redesigning. One of them
was based on the opinion of health experts. After
seeing some business issues as a conceptual model,
represented in BPMN, they discovered that some
parts can be realised in a different way with the
same results. These changes to the original model
were made, and some improvements were made to
the measures (i.e. Control flow complexity was 21
rather than 22 in the original model). Nevertheless,
some improvement initiatives can be also be made
by following theoretical guidelines, with which even
better results are obtained (nº of nodes, sequentiality,
mismatch connector, control flow complexity, TNE
and NSF). These results reveal that theoretical
guidelines produce better modification proposals
than changes based on experience. Despite this
result, we believe that the changes proposed by
guidelines should not be applied in isolation, but
should be accompanied by the opinions of domain
experts. If the BP is modified by domain experts in a
controlled manner, it will be possible to avoid the
rejection of changes in the lifecycle enactment stage.
5 CONCLUSIONS AND FUTURE
WORK
We conclude this article by summarizing its
contributions and by providing an overview of future
research. We have discussed the importance of
measuring business processes, specifically in the
design and analysis stage, because it is known that
improving conceptual models in the first stage
implies several advantages in the case of avoiding
the propagation of errors to later stages, in which
their elimination might be more difficult and
expensive. This finding has a strong implication for
the way in which business process improvement is
confronted. A high-quality conceptual model can
therefore ensure an acceptable execution.
The experience report allows us to demonstrate
the practical utility of measurement activities,
obtaining a higher-quality model. The application of
measurement to conceptual models detected some
potential parts for alteration (number of nodes,
reducing sequence and message flow, reducing
decision nodes, or reducing number of events).
Guidelines of modelling also assisted us in making
these modifications. Finally, we obtained an
improved quality model which can ensure a better
execution.
As a future work, we wish to provide more
empirically validated measures in order to make the
measurement process more reliable. We also intend
to design more guidelines for inexpert modellers.
Finally, our idea is to apply measurement activities
in other real business processes at the hospital and in
other real organizations in order to ensure their
practical utility.
ACKNOWLEDGEMENTS
This work was partially funded by the following
projects: INGENIO (Junta de Comunidades de
Castilla-La Mancha, Consejería de Educación y
Ciencia, PAC 08-0154-9262); ALTAMIRA (Junta
de Comunidades de Castilla-La Mancha, Fondo
Social Europeo, PII2I09-0106-2463), ESFINGE
(Ministerio de Educación y Ciencia, Dirección
General de Investigación/Fondos Europeos de
Desarrollo Regional (FEDER), TIN2006-15175-
C05-05) and PEGASO/MAGO (Ministerio de
Ciencia e Innovación MICINN and Fondo Europeo
de Desarrollo Regional FEDER, TIN2009-13718-
C02-01).
REFERENCES
Becker, J., M. Rosemann, et al. (2000). Guidelines of
Business Process Modeling. Business Process
ENASE 2011 - 6th International Conference on Evaluation of Novel Software Approaches to Software Engineering
112

Management, Springer Berlin / Heidelberg. 1806:
241-262.
Bender, R. (1999). "Quantitative Risk Assessment in
Epidemiological Studies Investigatin Threshold
Effects." Biometrical Journal 41(3): 305-319.
Cardoso, J. (2006). "Process control-flow complexity
metric: An empirical validation." SCC '06:
Proceedings of the IEEE International Conference on
Services Computing: 167--173.
Coleman, D., B. Lowther, et al. (1995). "The Application
of Software Maintainability Models in Industrial
Software Systems." Journal of Systems and Software
29(1): 3-16.
Damij, N., T. Damij, et al. (2008). "A methodology for
business process improvement and IS development."
Information and Software Technology 50(11): 1127-
1141.
Delgado, A., F. Ruiz, et al. (2009). "MINERVA: Model
drIveN and sErvice oRiented framework for the
continuous business processes improVement &
relAted tools." Work. on Engineering Service-Oriented
Applications (WESOA’09), with ICSOC.
Huan, Z. and A. Kumar (2008). "New quality metrics for
evaluating process models." Business Process
Intelligence workshop.
ISO/IEC (2001). "9126-1, Software engineering - product
quality - Part 1: Quality Model."
Jung, J. Y. (2008). "Measuring entropy in business process
models." International Conference on Innovative
Computing, Information and Control 0: 246-252.
Krogstie, J., G. Sindre, et al. (2006). "Process models
representing knowledge for action: a revised quality
framework." Eur. J. Inf. Syst. 15(1): 91-102.
Laue, R. and J. Mendling (2009). "Structuredness and its
Significance for Correctness of Process Models."
Information Systems and E-Business Management.
Linstone, H. A. and M. Turoff (2002). "The Delphi
Method: Techniques and Applications." Addison-
Wesley.
McCabe, T. J. (1976). "A Complexity Measure." IEEE
Transactions on Software Engineering SE-2(4): 308-
320.
Meimandi Parizi, R. and A. A. A. Ghani (2008). "An
Ensemble of Complexity Metrics for BPEL Web
Processes." Ninth ACIS International Conference on
Software Engineering, Artificial Intelligence,
Networking, and Parallel/Distributed Computing:
753-758.
Mendling, J. (2008). Metrics for Process Models:
Empirical Foundations of Verification, Error
Prediction, and Guidelines for Correctness, Springer
Publishing Company, Incorporated.
Mendling, J., H. A. Reijers, et al. (2010). "Seven Process
Modeling Guidelines (7PMG)." Information and
Software Technology 52(2): 127-136.
Nejmeh, B. A. (1988). "NPATH: a Measure of Execution
Path Complexity and its Applications." ACM 31(2):
188-200.
OMG. (2006). "Business Process Modeling Notation
(BPMN), Final Adopted Specification." from
http://www.omg.org/bpm.
Park, R. E., W. B. Goethert, et al. (1996). "Goal-Driven
software Measurement: A Guidebook." HANDBOOK
CMU/SEI-96-HB-002.
Rolón, E., J. Cardoso, et al. (2009). "Analysis and
Validation of Control-Flow Complexity Measures
with BPMN Process Models." The 10th Workshop on
Business Process Modeling, Development, and
Support.
Rolón, E., F. García, et al. (2006). "Evaluation Measures
for Business Process Models." Simposioum in Applied
Computing SAC06.
Rolon, E., L. Sanchez, et al. (2009). "Prediction Models
for BPMN Usability and Maintainability." BPMN
2009 - 1st International Workshop on BPMN: 383-
390.
Sánchez-González, L., F. García, et al. (2010a).
"Assessent and Prediction of Business Process Model
Quality." CoopIS 2010 - 18th International conference
on Cooperative Information Systems: 78-95.
Sánchez-González, L., F. García, et al. (2010b).
"Measurement in Business Processes: a Systematic
Review." Business process Management Journal
16(1): 114-134.
Sánchez-González, L., F. Ruiz, et al. (2011). "Towards
Thresholds of Control Flow Complexity Measures for
BPMN Models." 26th Symposium On Applied
Computing SAC 10: in press.
Sánchez González, L., F. García, et al. (2010). "Assessent
and Prediction of Business Process Model Quality."
CoopIS 2010 - 18th International conference on
Cooperative Information Systems: 78-95.
Shatnawi, R. (2010). "A Quantitative Investigation of the
Acceptable Risk levels of Object-Oriented Metrics in
Open-Source Systems." IEEE Transactions on
Software Engineering 36(2): 216-225.
Sparks, G. (2000). "An Introduction to UML, The
Business Process Model." Enterprise Architect.
Vanderfeesten, I., J. Cardoso, et al. (2007). Quality
Metrics for Business Process Models. BPM and
Workflow Handbook 2007.
Vanderfeesten, I., H. A. Reijers, et al. (2008). "On a Quest
for Good Process models: the Cross Conectivity
Metric." International Conference on Advanced
Information Systems Engineering.
Wand, Y. and C. Weber (2002). "Research commentary:
Information systems and conceptual modeling–a
research agenda." Info. Sys. Research 13(4): 363--376.
Weske, M. (2007). Business Process Management:
Concepts, Languages, Architectures, Springer Verlag.
BUSINESS PROCESS MODEL IMPROVEMENT BASED ON MEASUREMENT ACTIVITIES
113
