
DEVELOPING A PRICE MANAGEMENT DECISION SUPPORT
SYSTEM FOR HOTEL BROKERS USING FREE
AND OPEN SOURCE TOOLS
Slava Kisilevich, Daniel Keim, Roman Byshko
Department of Computer and Information Science
University of Konstanz, Konstanz, Germany
Michael Tsibelman*, Lior Rokach
HP Software, Yehud, Israel*
Department of Information Systems Engineering and The Deutsche Telekom Laboratories
Ben-Gurion University of the Negev, Beer-Sheva, Israel
Keywords:
Pricing management, Decision support, Hotels, Hedonic pricing model.
Abstract:
In the Internet age, e-commerce provides customers global reach to a wide variety of products and plays a
dominant role in business activity and competition. Competition is especially aggressive in the online travel
domain where wholesalers, e.g. brokerage companies, contract through their contract managers with thou-
sands of hotel brands and trade hotel products (usually hotel nights) for travel businesses or end customers.
In order to conclude a profitable contract, a contract manager should be able to compare all the particulars
of the prospective partner hotel with those of the competing hotels in the target city. Given that the number
of contract managers is comparatively small compared to the large number of hotels, the possible knowledge
base is limited. Thus, the hotel brokerage companies are only able to bargain with a relatively limited number
of hotels, and the contract profitability relies heavily on the contract managers’ expertise and communication
skills. In this paper we present a price management decision support system (DSS) for hotel brokers that
allows analysis of hotel prices using spatial and non-spatial characteristics, estimation of the objective relative
hotel prices, and determination of the profitability of the existing or future contracts. We built our system
using free and open source tools including geographic information system and data mining frameworks that
allow companies with limited money resources or manpower to implement such a prototype. We show the ef-
fectiveness of our tool by covering all the major components of the DSS such as data selection and integration,
model management and user interface. We demonstrate our tool on the area of Barcelona, Spain using a real
data of 168 hotels provided by one of the travel service providers.
1 INTRODUCTION
Hospitality business is an industry with two levels
of competition. On the first level, hotels compete
among each other for travelers. At the second level,
various travel intermediates (travel agencies, travel
wholesalers) compete for the most profitable discount
rate contracts proposed by hotels. Profitability of
any travel intermediate is directly related to the dis-
count rate contracts that are acquired and to the inter-
mediate’s ability of selling the product to customers.
Travel intermediates are dependent on their staff of
professional and highly paid hotel contract managers
to negotiate the best contract. Since the number of ho-
tels in the world is large and the negotiation process
is long, any particular travel intermediate has a rela-
tively small amount of contractors it can assign to any
of available destinations. Consequently, a contractor
is faced with two challenges: (1) to identify hotels
that fit the profile of their end customers, and (2) to
identify hotels in which managers would be inclined
to give better rates during negotiations.
Hotels employ revenue management systems (for
an overview, see Chiang et al. 2007) to determine the
future pricing based on the capacity and demand fore-
cast. Therefore, hotel managers who negotiate the
deal with contractors propose contracts that are prof-
147
Kisilevich S., Keim D., Byshko R., Tsibelman M. and Rokach L..
DEVELOPING A PRICE MANAGEMENT DECISION SUPPORT SYSTEM FOR HOTEL BROKERS USING FREE AND OPEN SOURCE TOOLS.
DOI: 10.5220/0003460701470156
In Proceedings of the 13th International Conference on Enterprise Information Systems (ICEIS-2011), pages 147-156
ISBN: 978-989-8425-54-6
Copyright
c
2011 SCITEPRESS (Science and Technology Publications, Lda.)

itable for the hotel. However, contract managers usu-
ally lack detailed knowledge about the particular ho-
tel and rely more on the local market understanding
and their communication skills. One of the questions
that travel wholesalers ask is whether there is a pos-
sibility to determine the objective market price of a
hotel before the negotiation is started such that this
knowledge can be used by contractors in leveraging
the deal. And if such a possibility exists, then what
is the solution. A naive solution would be to use
the openness and power of the Internet to check for
the prices of the same hotel at competitors’ websites.
However, this apparently simple approach is deemed
impractical since hotels require their dealers to adver-
tise the same price as it is shown on the hotel’s web
page . A practical solution is to use hedonic pricing
theory (Rosen, 1974) to identify hotels with the same
characteristics. Hedonic pricing theory states that the
price of the product is determined by the individual
characteristics of the product. Therefore, by finding
the hotels with the same characteristics or factors that
affect hotel prices, it will be possible to compare price
rates between similar hotels.
Understanding the factors that affect hotel prices
using the hedonic pricing theory, received much atten-
tion in the research (e.g., Monty and Skidmore 2003;
Thrane 2007; Li et al. 2008; Hung et al. 2010; Chen
and Rothschild 2010; Lee and Jang 2010). The re-
sults show that there is no universal solution to the
factors that affect prices. Moreover, results were af-
fected by many factors such as empirical methods
selected for the analysis, data quality and complete-
ness, and hotel characteristics. The problem of hotel
price estimation using hotel characteristics is an ill-
structured problem since it may have many answers
that depend on the selected parameters. Additionally,
hotel characteristics are of two types: non-spatial, like
room amenities and hotel facilities, and spatial, like
proximity to waterfront or to a business center. It is
easier to answer the question about non-spatial char-
acteristics like Is there a hairdryer in the room then
answering the question How many points of interest
are around the hotel since around is not precisely de-
fined in terms of distance. Therefore, a completely
automated solution process as was demonstrated by
Li et al. (2008) is not feasible in this case since the
guidance of the expert is paramount in the case of
ill-structured problems. Clearly, there is a need for
an interactive decision-support system (DSS) (Shim
et al., 2002; Arnott and Pervan, 2005; Karacapilidis,
2006) that would help the analyst in testing different
hypotheses regarding price factors on selected hotels.
In this system, the analyst can select the region of
investigation by fetching all the necessary data from
his/her corporate database. It should allow him/her to
add additional data that he/she thinks is important in
the analysis. Such data, for example, could be points
of interest around hotels, transportation points, histor-
ical places or information about the proximity of a ho-
tel to waterfront, etc. The analyst can build different
models and apply different algorithms using this sys-
tem and the system should help the analyst in the final
decision about the desirability of a hotel and its objec-
tive price. As was mentioned above, the hotel charac-
teristics and model components have spatial charac-
teristics (hotel location, location of points of interest,
etc.). In previous research it was shown (Crossland
et al., 1995) that addition of Geographic Informa-
tion Systems (GIS) technology to a business decision-
making environment improves the performance of the
decision-maker. Therefore, we argue that the hotel
price management system should at least provide sup-
port to input spatial data, to represent complex spatial
relations, to analyze spatial data, and to output spatial
data in the forms of maps, as discussed in Densham
(1991).
The travel intermediates that are interested in the
development of the outlined hotel price management
decision support system will inevitably face at least
two difficulties. The first difficulty is technical and
relates to high costs pertinent to the development it-
self. Usually, such companies employ a staff of web
programmers that develop web infrastructure of their
corporate website and they do not have spare re-
sources for developing complex analytical GIS-based
systems. One of our goals is to show that by using
the right free and open source tools, it is possible to
save development time by extending existing appli-
cations concentrating on the development of compo-
nents related to the price estimation problem only. We
achieve this by extending Java OpenStreetMap Edi-
tor
1
, a cross-platform editor of OpenStreetMap (Hak-
lay and Weber, 2008) data with a GIS-based interface,
using R Project
2
, a suit for statistical computing and
Weka (Hall et al., 2009), data mining and machine
learning software. The second difficulty is how to ob-
tain the external data that is essential for price esti-
mations, such as points of interest, transportation lo-
cations (buses, trains). These data is originally out
of the scope of wholesalers who generally have only
data about hotel amenities and facilities, and room
prices. There are different free services available
(e.g., GeoNames
3
) to collect the data but these ap-
proaches work best only for some small predefined
areas and require manual preprocessing. In case of
1
http://josm.openstreetmap.de/
2
http://www.r-project.org/
3
http://www.geonames.org/
ICEIS 2011 - 13th International Conference on Enterprise Information Systems
148

a decision support system that is to be applied vir-
tually on every part of the world, there is a need in
a simple process for retrieving the needed data. We
show that this is achieved by using OpenStreetMap
data, which is contributed by thousands of people. Al-
though, some data like the proximity of a hotel to the
seafront is not available through OpenStreetMap, the
analyst is able to decide for this feature and annotate
the hotel under investigation with this information by
using a simple user interface.
The contribution of the paper can be summarized
as follows:
(1) We propose a general all-in-one hotel price man-
agement solution for hotel wholesalers using free and
open source tools.
(2) We simplify considerably the external data acqui-
sition by using OpenStreetMap data.
(3) We enrich the price management process with ge-
ographic information system.
(4) We embed a data mining framework that allows
applying different algorithms on the created models.
(5) The analyst decides on features that are included
into the model.
(6) The analyst applies the desired properties to fea-
tures if needed (for example if a hotel faces water-
front).
2 RELATED WORK
Room rate characteristics for 74 hotels in and around
Oslo were studied by Thrane (2007) using log-linear
regression. Such factors as availability of mini-bars
and hairdryers in a room, and parking near the ho-
tel, significantly influenced the hotel price. However,
room rates were lower in hotels that offer room ser-
vice. In addition, hotels associated with chains are
more expensive than non-chain hotels.
In the study about hotels in Taiwan (Hung et al.,
2010), it was shown by applying quantile regression
analysis, that the age of hotels is negatively related
to the hotel price, while there is no significant dif-
ference between chain and non-chain hotels. Yet in
another study that included 73 hotels in Taipei (Chen
and Rothschild, 2010), it was found that such factors
as breakfast, business centers or swimming pools do
not influence the room price, while the hotel location,
TV, Internet access, and availability of the fitness cen-
ter, have significant influence on room rates.
Lee and Jang (2010) showed that hotel prices are
affected by the proximity of a hotel to an airport or to
central business districts.
Li et al. (2008) applied econometric modeling to
estimate the “objective” economic value of different
hotel characteristics such as proximity to the beach,
distance to the downtown, neighborhood safeness, ho-
tel class, customer reviews, etc. The econometric
model predicts the actual price for a hotel and esti-
mates its overall ranking (overpriced, underpriced) by
calculating the difference between the averaged pre-
dicted price and the averaged real price.
3 PROBLEM DOMAIN
Hotel
A
Hotel
B
Hotel
Broker
a
Hotel
Broker
b
Sells
Sells
Sells
Sells
Website
Website
Owns
Owns
Consumer Website
Consumer Website
Offline Travel Agents
Offline Travel Agents
Owns
Owns
Owns
Owns
Figure 1: Interaction between hotels and hotel intermedi-
ates.
The interaction between hotels and hotel intermedi-
ates is schematically depicted in Figure 1. A hotel
usually has its own website where it promotes room
nights sales directly. The website is the most prof-
itable selling channel because no intermediates are in-
volved. However, the exposure of a hotel web page to
a vast audience is limited because customers prefer
to see the price list of hotels to compare using one
or two travel sites, rather than searching for individ-
ual hotels. Therefore, hotels are interested in being
advertised by other channels with higher probability
of being exposed to end customers. As depicted in
Figure 1, Hotel A is exposed through the Hotel Bro-
ker a channel, while Hotel B is exposed through the
Hotel Borker b channel. Similarly, hotel brokers pro-
mote their products through consumer websites and
offline travel agents. The hotel intermediate may also
sell hotel nights to other intermediates if that inter-
mediate does not have a direct contract with the ho-
tel. It is clear that the hotel intermediate can reach
the best price by working directly with the hotel. As
was already explained in Section 1, the hotels sell
room nights to the hotel brokers in the form of dis-
count rate contracts. Hotel brokers are committed (as
part of the contract) to keep the prices at their on-
line channels similar to the prices provided by hotels
through their own websites. Therefore, the revenue of
the travel intermediates is the difference between the
final hotel price and the contract cost. Consequently,
DEVELOPING A PRICE MANAGEMENT DECISION SUPPORT SYSTEM FOR HOTEL BROKERS USING FREE
AND OPEN SOURCE TOOLS
149

the travel intermediates are highly interested in con-
cluding the contract at the maximally lowest price and
deal with the hotels directly rather than buying rooms
from other hotel brokers. If a Hotel Broker b knows
that Hotel A is identical to Hotel B (whose contract
they already acquired) in terms of characteristics that
determine the hotel prices, then this knowledge will
provide the leverage power in negotiating the prof-
itable deal with Hotel A. The proposed price manage-
ment decision support system is designed to help the
hotel broker company acquire the needed knowledge
about Hotel A. In addition, the same approach can also
help in analyzing the profitability of existing deals by
finding hotels similar in terms of their characteristics
but different in terms of the prices they advertise.
4 SYSTEM REQUIREMENTS
Figure 2: Use case diagram of system usage and behavioral
requirements.
In the previous chapter we have introduced the prob-
lem that hotel brokerage companies face. In this sec-
tion we outline a number of key attributes that the
decision support system has to have to successfully
aid in the decision process. Figure 2 shows the use
case diagram of the system usage and behavioral re-
quirements. The system supports three user types:
data manager, business intelligence analyst (BIA),
and contract manager. The responsibility of the data
manager is to retrieve the required data that are essen-
tial for the decision process. If the roles of the con-
tract manager and the business intelligent analyst are
separated, then the BIA is responsible for selecting
the needed hotel characteristics like location-based
and non-spatial attributes, building of spatial models
and building of the pricing models for hotels under in-
vestigation. BIA is also responsible for generating the
reports in the clear form that the contract manager can
use during his/her deal negotiation. In this paper we
concentrate only on behavioral requirements of data
managers and business intelligence analysts covering
data handling, model construction and price estima-
tion.
In addition, we took into consideration the fol-
lowing key characteristics during the development by
following the general guidelines of DSS and Spatial-
DSS planning (Densham, 1991):
1. The user interface is powerful and easy to use.
2. The system allows to combine analytical models
and data in a flexible manner.
3. The system allows to explore the solution space by
using the models and generating feasible solutions.
4. The system allows to input, represent, and output
spatial data.
5. The system allows output in different forms (maps,
non-spatial statistics).
5 DATA AND PREPROCESSING
The data about hotels was provided by Travel Global
Systems (TGS)
4
, a travel service provider, and the ho-
tel brokerage company. The data are divided into a
static and dynamic components. The static data in-
cludes the names of hotels, their internal ids, loca-
tion coordinates in World Geodetic System (WGS84),
hotel facilities, room amenities, and hotel categories.
The dynamic component includes the room prices for
one night that customers received during their search
for accommodation, the date of search, and the date of
order. The type of a desired room was not specified in
the data. Therefore, we assume that the average price
of a hotel is related to a standard room type which
is the most common room type in most of the hotels.
Consequently, we selected only those room amenities
that corresponded to a standard room.
Every amenity and facility types have an internal
identification number. However, preprocessing was
required since some of the amenities and facilities that
referred to the same entity were represented by differ-
ent ids and names. For example, Wireless Internet that
was indicated in one hotel referred to High-speed In-
ternet in another hotel. We manually processed all the
amenities and facilities and merged those that referred
to the same entity providing a mapping between the
corporate ids and the ids used in our system.
4
http://www.travelholdings.com/
ICEIS 2011 - 13th International Conference on Enterprise Information Systems
150
6 SYSTEM ARCHITECTURE
The following sections describe the main components
of the system.
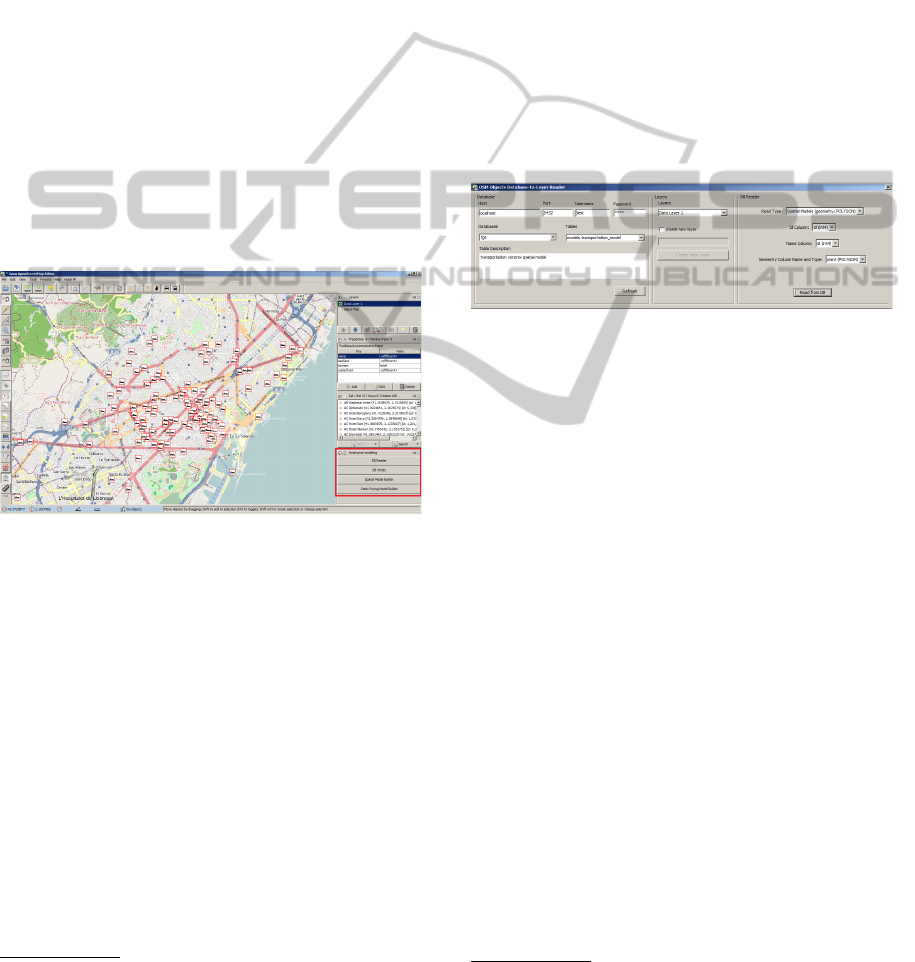
6.1 Java OpenStreetMap Editor
Java OpenStreetMap Editor (JOSM) is a convenient
tool for editing the OpenStreetMap data. However,
its interface (see Figure 3) and functionality is com-
parable to general purpose GIS packages like Open-
Jump
5
, UDig
6
or MapWindow GIS
7
. It can present
the spatial data in different layers and it is an extensi-
ble plug-in based framework. The primary advantage
of JOSM over other general purpose frameworks is
its ability to handle OpenStreetMap data, which is the
primary source of external data for the price manage-
ment decision support system. The provided control
panel (bottom right corner in Figure 3) is our interface
to the decision support system.
Figure 3: Java OpenStreetMap Editor Main View.
6.2 External Data Collection
The data collection process is an integral part of
JOSM. JOSM reads the data from the OpenStreetMap
database by selecting the boundary of the area, and
can save and load the data locally in the propri-
etary OSM XML format. Therefore, in order to
obtain data for a desired region the data manager
uses the functionality provided by JOSM. The Open-
StreetMap data exist in two different types: (1) point
data (nodes), which have coordinates expressed in
longitude and latitude, and (2) ways, which express
areal features that themselves are referenced through
nodes. The geographical features have a list of at-
tributes that come in a key=value form and determine
different characteristics of the feature. The majority
5
http://www.openjump.org/
6
http://udig.refractions.net/
7
http://www.mapwindow.org/
of widely used attributes are officially accepted, while
some attributes can be used internally by an applica-
tion. JOSM differentiate between types of features
and attaches a specific icon to a feature that was rec-
ognized. This is extremely helpful when the user pre-
pares the data for modeling since different types of the
data will be depicted by different icons, which will fa-
cilitate the data management. For example, hotels are
tagged by a key named tourism with the value hotel,
while restaurants are tagged by a key named amenity
and a value restaurant
8
. An example of how hotels
are represented in JOSM can be seen in Figure 3.
We have introduced our own attribute waterfront
that is assigned to a hotel by the domain expert in case
when the hotel is near a waterfront.
6.3 Data Integration
Figure 4: Data Reader Component.
The data reader component shown in Figure 4 consists
of three parts: (1) Database connection, (2) Layer se-
lection, and (3) Data type selection. The database
connection component allows the user to connect to
the database and select the corresponding database ta-
ble to read the data from. The layer selection allows
the user to select the existing layer or to create a new
layer where the data will be read. The data type se-
lection allows the user to select one of three types of
data supported by the system: (1) General points -
any data that has longitude and latitude coordinates,
(2) OSM points - it is similar to general points but
this data contains an additional field for attributes in
a key=value form, and (3) Spatial Models data - the
aerial data that consists of polygons and created by a
spatial model builder (see below). The component fa-
cilitates the data retrieval by asking the user to select
the right column (e.g., id or geometry column) that is
essential during the reading of the data from a table.
After the general spatial data is read and presented in
one of the layers, the user can annotate it with the offi-
cial or custom attributes thus turning the general data
into the form recognizable by JOSM.
The user can write the data back to the table by
using data writer component shown in Figure 5. The
data will be read from the currently active layer. First,
8
For a complete list of official attributes please
see http://wiki.openstreetmap.org/wiki/Map_
Features
DEVELOPING A PRICE MANAGEMENT DECISION SUPPORT SYSTEM FOR HOTEL BROKERS USING FREE
AND OPEN SOURCE TOOLS
151
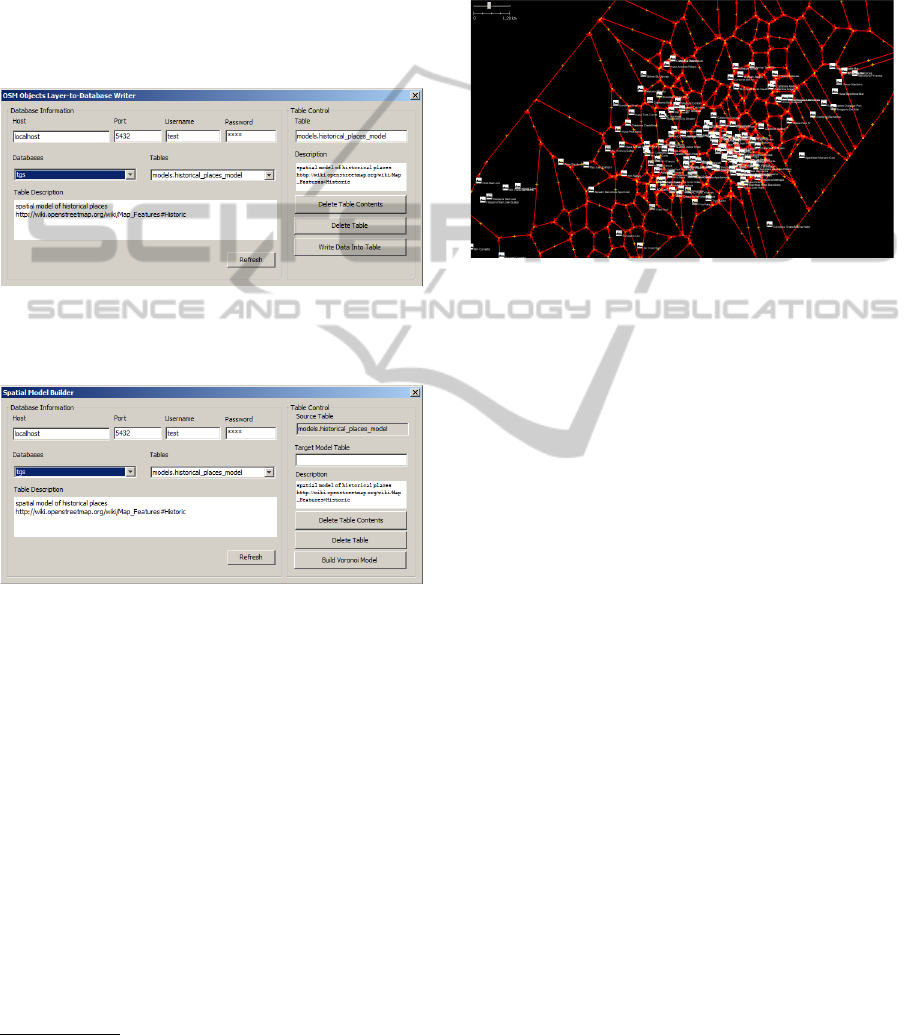
the user selects the database. The data can be written
to an already existing table or to a new table by pro-
viding a name of a table. The user can also provide
the description of the table that will be stored along
with the data. Additional controls are available for
table management, which allow deletion of an exist-
ing table and deletion of contents in an existing table.
This component is useful during external data selec-
tion as described in Section 6.2 or when the subset of
a corporate hotel data is selected for analysis from the
corporate database.
Figure 5: Data Writer Component.
6.4 Spatial Model Builder
Figure 6: Spatial Model Builder Component.
Figure 6 shows the spatial model builder component.
Like the data writer component, it is composed of
two parts. First, the user selects the database and the
source table where the point data is located. Next,
the user provides the name of the model table where
the spatial model will be stored. We decided to sim-
plify the process of spatial model creation by com-
bining a model generation and table write in one step.
To achieve this, we call the database stored procedure
that invokes the spatial model creation algorithm in R
framework using PL/R procedural language for Post-
greSQL
9
. When the model is generated, it is writ-
ten directly to a table provided in the spatial model
builder component. Spatial model generates spa-
tial clusters using Voronoi tessellation (Okabe et al.,
2000). The Voronoi tessellation decomposes the met-
ric space into regions of equal nearest neighbors using
9
http://www.joeconway.com/plr/
the set of generating points. This set of points can in
our case be any external data important for determi-
nation of hotel prices (e.g., points of interest, trans-
portation locations). The example of a transportation
model generated by Voronoi tessellation is presented
in Figure 7 using red lines, which are overlaid by the
corresponding hotels shown as white rectangles.
Figure 7: Transportation Model using Voronoi Tessellation.
The size of the cluster may indicate the relative
density of the generating points located around.
Thus, we may answer the following questions using
the spatial model:
(1) How many hotels are located in every region?
(2) What is the area of a region?
(3) Is the hotel located inside one of the regions?
6.5 Price Modeling
The price modeling component shown in Figure 8 is
the most important component available for the ana-
lyst. It allows the analyst to select the hotel features
that would build up the pricing model. The compo-
nent consists of eight parts. First, the analyst connects
to the database (this part is labeled as 1) that holds all
the required information about hotels, prices, ameni-
ties, facilities, and spatial models. Second, the ana-
lyst retrieves the list of hotels he/she is interested in
(labeled as 2) and selects the hotels that would be part
of a model and hotels that would be used for price
estimation (they will not be part of a model). The
parts labeled as 3 and 6 are responsible for retrieval
of amenities and facilities of the selected hotels. The
analyst has the complete control over the final list of
amenities and facilities that will be included into the
model. If the hotel category (stars) is important for in-
clusion into the model, the analyst controls this in the
part labeled 4. The part labeled 5 is called Point and
Spatial Model and it is the most versatile part in the
whole price modeling component. The analyst selects
the spatial characteristics using two types of data. The
ICEIS 2011 - 13th International Conference on Enterprise Information Systems
152
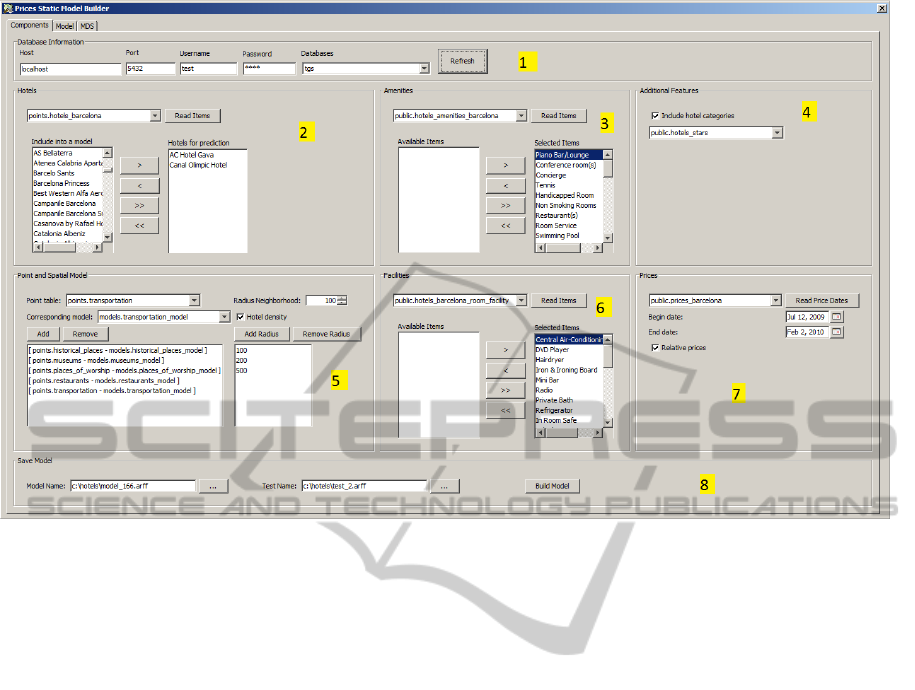
Figure 8: Price Modeling.
point data that was used for generating the spatial
model as explained in Section 6.4 and the spatial mod-
els stored in the corresponding tables. Next, the ana-
lyst selects the desired radius size(s). The definition
of radius sizes allows the analyst to answer such ques-
tions as: How many points of interest/museums/bus
stops are in the radius of 200 meters around the ho-
tel. The hotel density in the specified radius can also
be calculated. In the part labeled as 7, the analyst
retrieves the hotel prices and specifies the period for
which the pricing model has to be built. Finally, the
analyst saves the generated model and the hotel test
set (if provided) in files (labeled as 8) with the format
recognized by Weka, the data mining package embed-
ded into the system.
7 USE CASE
In this section we present one of the possible explo-
rative scenarios of the system usage, which may fit
the situation when the contract manager would like to
understand if already concluded contracts with partic-
ular hotels match the objective price of those hotels.
As an examples, we used 168 hotels in the area of
Barcelona, Spain. Exploration is the common way to
understand the data under investigation. Therefore,
the first and foremost step is to visualize the locations
of hotels to understand where hotels are situated in
order to decide which hotels are not important for the
inclusion into a model. This step is shown in Fig-
ure 3. Let us suppose that all the hotels were selected
and the pricing model was built using the price mod-
eling component described in Section 6.5. Our prob-
lem is to identify hotels that are similar in terms of
their characteristics, but differ considerably in price.
Hundreds of attributes can be part of a model and the
analyst may use different methods to find groups of
hotels with similar attributes. For the sake of sim-
plicity, we implemented a multidimensional scaling
(MDS) (Kruskal and Wish, 1978), which is a power-
ful technique to investigate multivariate data by trans-
forming the multidimensional data into two dimen-
sions by preserving the relative distance between ob-
jects (hotels in our case). MDS allows for observing
similarities of objects using graphical representation.
The analyst can therefore determine what hotels are
similar in terms of their characteristics and also check
their average relative market price as presented in Fig-
ure 9. Let us focus on two hotels that are enclosed in
the red rectangle. They are located far enough from
the majority of other hotels but relatively close to each
other. However, the inspection of their relative market
price (the average of their price divided by the aver-
age of all other hotels) shows that Canal Olympic Ho-
tel price is 0.57 (43% lower than the average relative
market price in the area) having the absolute price of
75.02 euro, while the price of AC Hotel Gava is 1.11
(11% higher than the average relative market price in
the area) with the absolute price of 144.31 euro. The
DEVELOPING A PRICE MANAGEMENT DECISION SUPPORT SYSTEM FOR HOTEL BROKERS USING FREE
AND OPEN SOURCE TOOLS
153
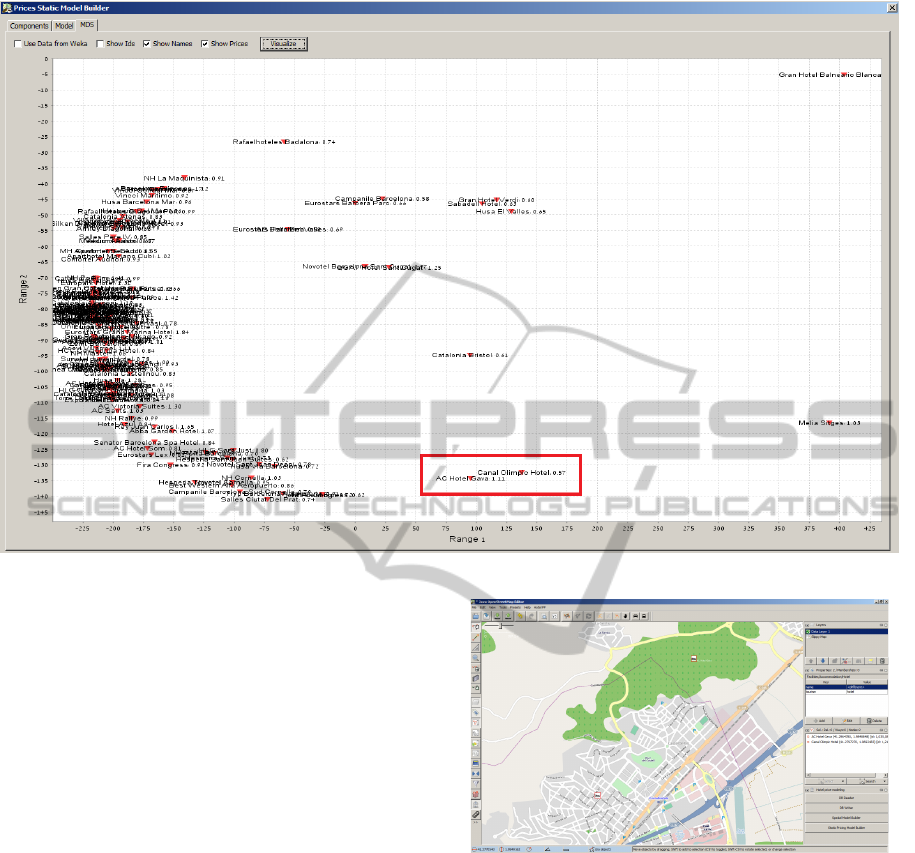
Figure 9: Similarity of hotel characteristics using Multidimensional Scaling.
difference of 69 euro is very substantial and the an-
alyst is interested in further analysis. By inspecting
the hotels’ location we discover that these two hotels
are also located close to each other geographically as
shown in Figure 10. The analyst decides to use re-
gression analysis to estimate the real prices of these
hotels using all other hotels as a price model (train-
ing data). After selecting the best estimator using 10-
fold cross validation on the training data, we apply
Additive Regression with Isotonic Regression on the
two hotels. The results are presented in Figure 11 and
outlined with red rectangles. The price predicted for
the AC Hotel Gava is 90 euro, lower then the original
price, while the price Canal Olympic Hotel is 78.62,
not significantly higher than its original price. Based
on these findings, the analyst should revise the con-
tract with the hotel AC Hotel Gava if the contract
rate is much more higher than the contract of Canal
Olympic Hotel.
8 DISCUSSION
The proposed price management decision support
system stands out by adding three essential features:
(1) the use of JOSM, a GIS-based tool that was ini-
tially designed to support a very narrow task of cre-
ating and editing OpenStreetMap data, (2) the use of
Figure 10: Locating the hotels on the map.
the OpenStreetMap data as an external data in the pro-
cess of determination of hotel prices, and (3) the use
of data mining framework instead of pure statistical
approaches for price analysis. The advantage of us-
ing JOSM over other general purpose GIS tools was
discussed in Section 6.1. However, the other two fea-
tures require further discussion.
Since OpenStreetMap data retrieval is naturally
supported by JOSM, it simplifies the process of data
acquisition. In comparison, Li et al. (2008) applied a
complex process of data collection. The authors used
Virtual Earth Interactive SDK to measure the number
of restaurants and shopping destinations in proxim-
ity to the hotels. To answer the question whether the
ICEIS 2011 - 13th International Conference on Enterprise Information Systems
154
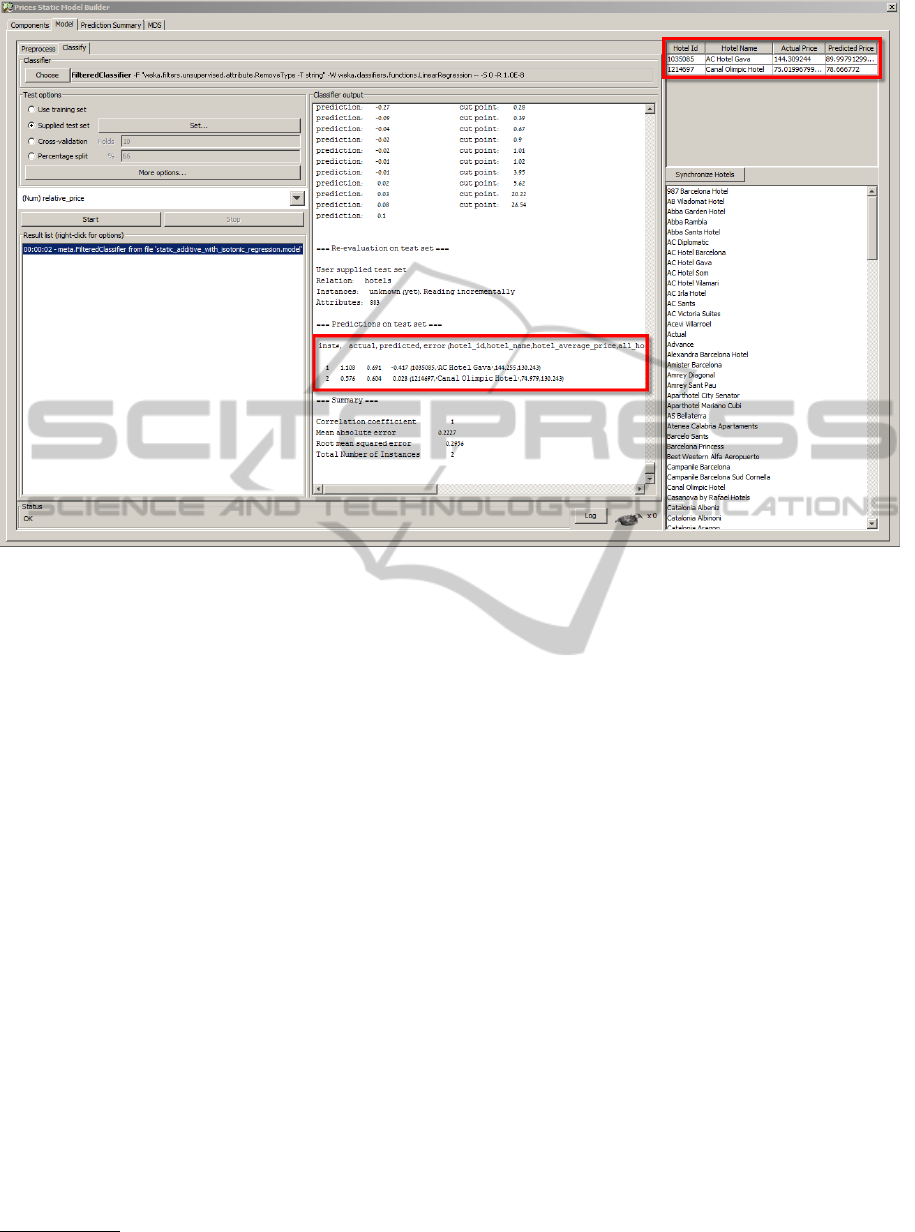
Figure 11: Price estimation using Weka.
hotel is located near the beach, Li et al. (2008) used
image classification of satellite data and manually val-
idated the results by using on-demand human anno-
tators through the Amazon Mechanical Turk
10
paid
service. The advantages of using only one source of
data are clear. First, OpenStreetMap data is reach in
content. It contains information about transportation
such as buses and trains, points of interest, restau-
rants and pubs, places of worship and historical sites.
All this is useful for the hotel price estimation. Sec-
ond, the data can be visualized in the system such
that the analyst can decide which parts are relevant
for the analysis. Third, the absence of some func-
tionality such as determining whether the hotel is lo-
cated near a waterfront, is substituted by the domain
expert himself without the need for applying costly
image classification methods and paid human anno-
tators. However, the completeness and correctness
of the OpenStreetMap data still need to be closely
examined because the data is contributed by volun-
teers, and because the project was only recently es-
tablished. A recent study (Zielstra and Zipf, 2010)
conducted on Germany data showed that there is a dif-
ference in terms of data completeness between cities
and rural areas. However, the difference has been
decreased extremely in recent years due to the in-
crease in new members willing to participate in the
10
http://www.mturk.com/
project (the number of participants doubled within
one year and stands for over 200,000 members in
January 2010). Moreover, the data in large cities is
rich enough. In fact, OpenStreetMap data has been
already used in place of proprietary and commercial
data sets (Zielstra and Zipf, 2010).
The advantage of using data mining over pure sta-
tistical analysis is explained by the type of the prob-
lem we deal with. Statistical analysis usually deals
with well structured problems, small data sets, ho-
mogeneity of data, and a confirmatory type of analy-
sis (Hand, 1998). Recall from Section 1, the problem
of hotel price estimation is an ill-structured problem
with different types of data (spatial and non-spatial)
and input parameters. Here, the use of heteroge-
neous data and exploratory analysis using different
algorithms for price estimation are more appropriate.
This is due to the fact that data mining approaches
can handle high-dimensional data with high degree
of sparseness, multicollinearity, outliers and missing
values that statistical approaches cannot easily han-
dle (Brusilovsky and Brusilovskiy, 2008).
DEVELOPING A PRICE MANAGEMENT DECISION SUPPORT SYSTEM FOR HOTEL BROKERS USING FREE
AND OPEN SOURCE TOOLS
155

9 CONCLUSIONS
In this paper, we presented a practical approach for
implementing a price management decision support
system for hotel brokers and hotel intermediates. We
discussed the problem that hotel brokers face and the
requirements for implementing the decision support
system. The solution was simplified considerably by
using free and open source tools such as Java Open-
StreetMap Editor (JOSM), R statistical package and
Weka data mining framework. We also simplified the
process of external spatial data acquisition by using
OpenStreetMap data. In our future work, we plan to
enrich the system with other analytical components,
and we will closely work with the hotel domain ex-
perts to identify problems that have not been yet cov-
ered by the current prototype.
ACKNOWLEDGEMENTS
This work was partially funded by the German Re-
search Society (DFG) under grant GK-1042 (Re-
search Training Group “Explorative Analysis and Vi-
sualization of Large Information Spaces”), and by
the Priority Program (SPP) 1335 (“Visual Spatio-
temporal Pattern Analysis of Movement and Event
Data”).
REFERENCES
Arnott, D. and Pervan, G. (2005). A critical analysis of de-
cision support systems research. Journal of Information
Technology, 20(2):67–87.
Brusilovsky, D. and Brusilovskiy, E. (2008). White pa-
per: Data mining: The means to competitive ad-
vantage. http://www.connectis.ca/download/bis/
bis_data_mining_whitepaper.pdf.
Chen, C. and Rothschild, R. (2010). An application of hedo-
nic pricing analysis to the case of hotel rooms in Taipei.
Tourism Economics, 16(3):685–694.
Chiang, W., Chen, J., and Xu, X. (2007). An overview of re-
search on revenue management: current issues and future
research. International Journal of Revenue Management,
1(1):97–128.
Crossland, M., Wynne, B., and Perkins, W. (1995). Spa-
tial decision support systems: An overview of technol-
ogy and a test of efficacy. Decision Support Systems,
14(3):219–235.
Densham, P. (1991). Spatial decision support systems. Ge-
ographical information systems: Principles and applica-
tions, 1:403–412.
Haklay, M. and Weber, P. (2008). OpenStreetMap: user-
generated street maps. IEEE Pervasive Computing,
pages 12–18.
Hall, M., Frank, E., Holmes, G., Pfahringer, B., Reutemann,
P., and Witten, I. (2009). The WEKA data mining soft-
ware: An update. ACM SIGKDD Explorations Newslet-
ter, 11(1):10–18.
Hand, D. (1998). Data mining: statistics and more? The
American Statistician, 52(2).
Hung, W., Shang, J., and Wang, F. (2010). Pricing determi-
nants in the hotel industry: Quantile regression analysis.
Hospitality Management, 29(3):378–384.
Karacapilidis, N. (2006). An overview of future challenges
of decision support technologies. Intelligent Decision-
making Support Systems, pages 385–399.
Kruskal, J. and Wish, M. (1978). Multidimensional scaling.
Sage Publications, Inc.
Lee, S. and Jang, S. (2010). Room Rates of US Airport Ho-
tels: Examining the Dual Effects of Proximities. Journal
of Travel Research.
Li, B., Ghose, A., and Ipeirotis, P. G. (2008). Stay else-
where? improving local search for hotels using econo-
metric modeling and image classification. In 11th Inter-
national Workshop on Web and Databases (WebDB).
Monty, B. and Skidmore, M. (2003). Hedonic pricing
and willingness to pay for bed and breakfast amenities
in Southeast Wisconsin. Journal of Travel Research,
42(2):195.
Okabe, A., Boots, B., Sugihara, K., and Chiu, S. (2000).
Spatial tessellations: Concepts and applications of
Voronoi diagrams. New York: John Wiley & Sons.
Rosen, S. (1974). Hedonic prices and implicit markets:
product differentiation in pure competition. The Journal
of Political Economy, 82(1):34–55.
Shim, J., Warkentin, M., Courtney, J., Power, D., Sharda,
R., and Carlsson, C. (2002). Past, present, and future of
decision support technology. Decision support systems,
33(2):111–126.
Thrane, C. (2007). Examining the determinants of room
rates for hotels in capital cities: The Oslo experience.
Revenue & Pricing Management, 5(4):315–323.
Zielstra, D. and Zipf, A. (2010). A Comparative Study of
Proprietary Geodata and Volunteered Geographic Infor-
mation for Germany. In 13th AGILE International Con-
ference on Geographic Information Science. Guimaraes,
Portugal.
ICEIS 2011 - 13th International Conference on Enterprise Information Systems
156
