
PERFORMANCE EVALUATION OF QUERY TRIMMING
STRATEGIES IN SEMANTIC CACHING ENVIRONMENT
S. Kami Makki, Stefan Andrei, Yanwen Guan
Department of Computer Science, Lamar University, Beaumont, Texas, U.S.A.
Mattie Sue Judd
Department of Mathematics and Computer Science, Oral Roberts University, Tulsa, Oklahoma, U.S.A.
Keywords: Boolean logic, Query Optimization, Query Containment, Semantic caching.
Abstract: The Semantic caching is an efficient caching strategy for client-side processing of queries. This strategy
involves comparing user queries with previously cached queries and finding the similarities between these
queries. These similarities constitute the partial answer to the user query and therefore they would be
extracted from the user query. Then only the remainder of the user query would be sent to the server.
Therefore, this can reduce significantly not only the communication between client and server and as a
result free network bandwidth, but also improves the speed of query processing in a distributed
environment. This paper presents simulations for manipulation of multi-table queries and provides extensive
simulations for single-table queries in comparison with previous methods.
1 INTRODUCTION
The semantic model for client side caching was first
proposed by Dar et al. (Dar
et al., 1996). Their study
demonstrated the significant improvements in
efficiency of semantic caching over traditional page
and tuple caching methods. They also explored
several of the most important benefits of semantic
caching, including a reduction in network traffic and
the ability to partially or fully answer some queries
without contacting the server.
Ren et al. (Ren et al., 2003) presented a query
splitting method which has direct application of
Boolean logic. However, their method is very
computationally complex and ineffective for queries
with medium to large numbers of predicate clauses
in the queries. This inefficiency is due to the use of
satisfiability concepts which are necessary to
generate the probe and remainder queries.
Guo et al. (Guo et al., 1996) analyzed the
question of satisfiability-based methods for database
query processing. They demonstrated that a method
based on restricted satisfiability concepts is
potentially solvable in linear time. Also, the authors
in (Hao, et al., 2005) and (Li, et al., 2008) used
extensive logical rules to restrict the satisfiability
problem to a more manageable size. Although these
methods make the actual comparison simpler, the
introduction of other logical computations largely
obviate the improvements in efficiency that they
offer.
Makki et al. (Makki, and Rockey, 2010)
presented a novel method for semantic caching
which sidestepped the complexity of the
satisfiability problem by visualizing the data in the
user query and cache data as materialized “layers.”
This visualization method allows for a direct
comparison of the upper and lower bounds of the
respective semantic segments and should be much
more efficient for query processing. However, they
did a very limited experiment to compare their
visualization method with the Ren et al.’s method.
2 GENERAL TERMS
AND DEFINITIONS
The following terms and definitions are derived
from those used by previous works Ren et al. (Ren et
al., 2003) and Guo et al. (Guo et al., 1996).
A database D, consists of a set of relations R
i,
…,
169
Kami Makki S., Andrei S., Guan Y. and Sue Judd M..
PERFORMANCE EVALUATION OF QUERY TRIMMING STRATEGIES IN SEMANTIC CACHING ENVIRONMENT.
DOI: 10.5220/0003446001690176
In Proceedings of the 13th International Conference on Enterprise Information Systems (ICEIS-2011), pages 169-176
ISBN: 978-989-8425-53-9
Copyright
c
2011 SCITEPRESS (Science and Technology Publications, Lda.)

R
n
, so that D = {R
i
, 1≤ i ≤n}. Each relation R
i
is
associated with an attribute set, denoted A
Ri
, and we
may represent the attribute set of the entire database
by A, where A = ∪A
Ri,
1≤ i ≤n. A compare
predicate, P, is defined by P = a op c, where a ϵ A,
op ϵ {≤, <, ≥, >, =}, and c is a real constant bound.
The authors in (Rosenkrantz and Hunt, 1980) and
Guo et al., 1996) have demonstrated that
introduction of the comparison operator ≠ makes this
problem NP-hard over the integer domain. Since we
are primarily interested in comparing the efficiency
of two query processing methods, we follow both
(Ren et al., 2003) and (Makki and Rockey, 2010) in
ignoring ≠ comparison in this simulation.
The primary unit with which semantic caching is
concerned is the semantic segment or region. A
semantic segment is an earlier (either original or
decomposed) query, which is stored together with its
result in the cache. Formally, a semantic segment is
defined as a tuple <S
R
, S
A
, S
P
, S
C
>, where S
R
ϵ D, S
A
⊆ A, S
C
=π
Sa
σ
Sp
S
R
, and S
P
= T
1
∨T
2
∨...∨T
n
, where
each T
j
is a disjunctive of predicates, such that T
j
=
P
1
∧P
2
∧...∧P
k
. Each a in P
k
, or each predicate term, is
such that a ϵ A of S
R
.
A user query Q is a semantic segment <Q
R
, Q
A
,
Q
P
, Q
C
> which is introduced into the cache for
comparison. Semantic caching methods split Q into
two new, discrete queries: the probe query Q
PQ,
and
the remainder query Q
RQ
, such that Q
PQ
∪ Q
RQ
= Q
C
and Q
PQ
∩ Q
RQ
= Ø. Here, Q
C
is equivalent to
directly querying the server without consulting the
cache; while Q
PQ
retrieves the data which is
available in the semantic regions of the cache, since
it is the intersection of the data sets of S and Q. And
we may define the probe query formally as Q
PQ
= Q
P
∧ S
P
. The remainder query requests the data not
available in the cache, and can thus be considered
Q
RQ
= Q
P
∧ ¬S
P
.
3 RELATED WORK
Query trimming, the mechanism of splitting the user
query into the probe and remainder queries, is one of
the most computationally intensive sections of any
semantic caching method. As mentioned above, the
method proposed by (Ren, et al., 2003) uses
satisfiability concepts. The visualization method of
(Makki and Rockey, 2010) on the other hand, seems
to adopt a much simpler approach to the issue of
query trimming. In this Section, we will outline first
the method used by (Ren, et al., 2003) and then the
visualization method of (Makki and Rockey, 2010)
for query processing, concluding with complexity
analysis of the two methods.
3.1 Ren et al.’s Method
The method proposed by (Ren, et al., 2003) for
query trimming follows directly from the formal
definitions, explained in Section 2, for the probe and
remainder query. This method uses Boolean logic to
compare the predicate clauses of the user query with
those of the semantic regions in order to generate
equations of similar form for sending to the cache
and server. Recall that we define the probe query as
Q
PQ
= Q
P
∧ S
P
and the remainder query as Q
RQ
= Q
P
∧ ¬S
P
. By solving these two satisfiability problems,
the Ren et al.’s method locates the intersections
between the user query (Q
P
) and the semantic
sections in the cache (S
P
). This method is intuitively
straightforward and consistently generates an
accurate description of Q
PQ
and Q
RQ
.
Though the details of implementation differ
among the previous proposed algorithms, the general
model is consistent in its use of two separate
subroutines to compute Q
PQ
and Q
RQ
. Further,
though different methods of solving the satisfiability
problem have been proposed, all of them seek to
solve the same definitions of the probe and
remainder queries. These overriding similarities
enable general analysis of the Ren et al.’s method to
proceed without detailed implementation of each
individual algorithm.
Let us consider below an example of calculating
Q
PQ
and Q
RQ
based on S
P
and Q
P
(Notice the
complexity introduced by the negation of S
P
in the
Q
RQ
term.)
S
P
= (x ≥ 10 ∧ x ≤ 15 ∧ y ≥ 5 ∧ y ≤ 20) ∨ (x ≥ 5 ∧ x ≤ 20 ∧ y ≥ 2
∧ y ≤ 10)
Q
P
= (x ≥ 8 ∧ x ≤ 17 ∧ y ≥ 3 ∧ y ≤ 8)
Probe Query:
Q
PQ
= Q
P
∧ S
P
= (x ≥ 8 ∧ x ≤17 ∧ y ≥ 3 ∧ y ≤ 8) ∧ ( (x ≥10 ∧ x ≤
15 ∧ y ≥ 5 ∧ y ≤ 20) ∨ (x ≥ 5 ∧ x ≤ 20 ∧ y ≥ 2 ∧ y ≤ 10) )
Remainder Query:
Q
RQ
= Q
P
∧ ¬S
P
=
(x ≥ 8 ∧ x ≤ 17 ∧ y ≥ 3 ∧ y ≤ 8) ∧ ¬ ((x ≥ 10 ∧ x ≤ 15 ∧ y ≥ 5 ∧ y
≤ 20) ∨ (x ≥ 5 ∧ x ≤ 20 ∧ y ≥ 2 ∧ y >10) ) ≡ (x ≥ 8 ∧ x ≤ 17 ∧ y ≥
3 ∧ y ≤ 8) ∧ (¬ (x ≥ 10) ∨ ¬ (x ≤ 15) ∨ ¬ (y ≥ 5) ∨ ¬ (y ≤ 20)) ∧
(¬ (x ≥ 5) ∨ ¬(x ≤ 20) ∨ ¬ (y ≥ 2) ∨ ¬ (y > 10)) ≡ (x ≥ 8 ∧ x ≤
17
∧ y ≥ 3 ∧ y ≤ 8) ∧ (x < 10 ∨ x >15 ∨ y < 5 ∨ y > 20) ∧ (x < 5 ∨ x
> 20 ∨ y < 2 ∨ y ≤ 10) ≡ (x ≥ 8 ∧ x ≤ 17 ∧ y ≥ 3 ∧ y ≤ 8) ∧ (x < 5
∨ (x < 10 ∧ y < 2) ∨ (x < 10 ∧ y < 10) ∨ x > 20 ∨ (x > 15 ∧ y < 2)
∨ (x > 15 ∧ y > 10) ∨ (x < 5 ∧ y < 5) ∨ (x < 20 ∧ y < 5) ∨ y < 2 ∨
(x < 5 ∧ y > 20) ∨ (x > 20 ∧ y > 20) ∨ y > 20)
Figure 1: A sample query processed using the Ren et al.’s
method.
ICEIS 2011 - 13th International Conference on Enterprise Information Systems
170

Despite its accuracy, a significant disadvantage
is posed by the logical derivation of the Ren et al.’s
method from the formal definitions of Q
PQ
and Q
RQ
.
Because of the negation of S
P
involved in generating
the remainder query, the calculations that this
method requires often become very intense quickly.
Since the Boolean negation operations exponentially
increase the number of clauses in the problems to
which they are applied, the Ren et al.’s method often
spends most of its execution time calculating Q
RQ.
This is particularly the case when there is a large
number of compare predicates to begin with in the
user query or a large number of semantic sections in
the cache. The efficiency of the Ren et al.’s method
is thus unfortunately dependent on the complexity
involved in solving Q
PQ
= Q
P
∧ S
P
and Q
RQ
= Q
P
∧
¬S
P
. In addition, previous algorithms’ consideration
of the attributes x and y as coordinates of the
semantic regions in a two-dimensional plane is not
compatible with the reality of database tables.
3.2 Visualization Method
The visualization method for query trimming
proposed by (Makki and Rockey, 2010) was
intended to avoid the complexity of the satisfiability
problem involved in the Ren et al.’s method. The
method’s most important difference from previous
algorithms rests in its use of relation pointers to
represent each compare predicate. In other words,
each segment S will be presented by k relation
pointers, where k is the number of compare
predicates in S. We can call the set of all the relation
pointers in the user query Q
RP
and the set of those in
the cache C
RP
= k
S1
∨ k
S2
∨...∨ k
Sm
, where S
1,
..., S
m
are
the semantic segments stored in the cache.
By sorting the compare predicates of both Q
RP
and C
RP
by means of these relation pointers, the
method is able to process the predicates as
individual units and thus directly find areas of
intersection between them. The visualization
algorithm details a method of comparison of upper
and lower bounds to do this comparison;
importantly, this operation is identical to the bounds’
comparison employed in the final stage of many
satisfiability based methods.
Given the formal definitions of Q
PQ
and Q
RQ
, we
recognize that the visualization method must have a
description in the language of satisfiability. In fact,
this method essentially reframes the satisfiability
problem of the Ren et al.’s method into a much
simpler form. By directly comparing the relation
pointers, the method implicitly finds the area of
intersection between the user query and the cached
segments, or Q
PQ
≈ Q
RP
∩ C
RP
≈ Q
P
∧
S
P
.
Rather than comparing some negation of the
pointers to find Q
RQ
, the visualization method
removes this set of relation pointers from the whole
set of compare predicates in the original user query:
Q
RQ
= Q
RP
- Q
PQ
. The real advantage of the use of
relation pointers in the visualization method
becomes obvious at this point, as this removal
operation in linear time would be impossible without
the use of relation pointers. With them, the
calculation of the remainder query becomes a matter
of simple subtraction, and eliminates the need for the
complex negations of the Ren et al.’s method. This
difference represents a significant improvement in
efficiency in visualization method. Finally, this
reduced set of pointers remaining in Q
RP
and the set
of overlapping pointers earlier identified between
Q
RP
and C
RP
can be easily translated back into query
form as Q
RQ
and Q
PQ
, respectively.
3.3 Complexity Analysis
Analysis of the algorithm presented by Ren et al.
suggests that their method should be of order O(n
k
),
where
2≥k
, since the computation of Q
RQ
is alone
of order O(n
2
) in many cases. Simulations of Ren et
al.’s method by (Ren, et al., 2003), (Guo, et al.,
1996), (Hao, et al., 2005) have all produced results
that can be best matched to exponential curves.
Analysis of the algorithm presented by (Makki
and Rockey, 2010) suggests that the visualization
method should be of order O(n), since the
comparisons involved occur individually to each set
of relation pointers. Previous simulations have not
included a large enough sample set to allow curve
matching.
4 SIMULATION
The previous simulations of the methods of (Ren,
Dunham, et al., 2003) and (Makki and Rockey,
2010) have been limited to queries requesting data
from only one table (Ren, et al., 2003), (Guo, et al.,
1996), (Makki and Rockey, 2010). We extended our
simulation to model join queries, where users may
request data from two or more tables joined by the
specification of a join condition. This section
provides the simulation result not only for join
queries but also for single table selection query.
PERFORMANCE EVALUATION OF QUERY TRIMMING STRATEGIES IN SEMANTIC CACHING
ENVIRONMENT
171
4.1 Join Queries
This section provides an overview of the setup, test
cases, and results of our join queries simulation.
In order to make the comparison between the
two methods as clear and fair as possible, we began
our simulation setup by identifying points of
similarity in the Ren et al. and visualization
algorithms. We developed an efficient method for
modelling a small cache and reading in user queries
and implemented the two query processing
algorithms with two programs based on this
modelling method. By using the same data structure
in both programs to contain our simulated cache,
user queries, temporary remainder query (after
processing each individual semantic region), and so
on. We were able to produce two streamlined
programs that worked in much the same way, except
for the specific methods of query trimming. This
approach allowed us to test the efficiency of the
query processing trimming methods directly. Both
programs were based on the use of an original object
class,
RelationPredicate(), which contained the
table name, primary keys, attributes, and compare
predicates for each query. Each program was written
in Java and ran on a Pentium processor running
Windows Vista with 2 GB of RAM.
4.1.1 Test Cases
Following similar simulations conducted in (Ren, et
al., 2003), (Guo, et al., 1996), (Hao, et al., 2005) and
(Li, et al., 2008), we chose to compare the two
programs on the basis of execution time. We
modelled growing query complexity by gradually
increasing the number of semantic regions to be
processed. Since this method of measuring time
sometimes produces wildly varying results because
of other operations running on the system, we ran
each simulation 15 times and computed the mean of
the middle 10 results, allowing us to discard
obviously exotic times. We selected a variety of test
cases (Table 1 lists the test queries), ranging from
full containment (no remainder query generated) to
no intersection between the user query and the
semantic region (no probe query generated).
4.1.2 Results for Join Queries
Over the 10 cases that we tested, a consistent pattern
of differing efficiencies between the Ren et al. and
visualization methods clearly emerged. The
visualization method’s execution time increases
linearly, as we predicted, while the Ren et al.
method’s execution time increases exponentially in
some cases.
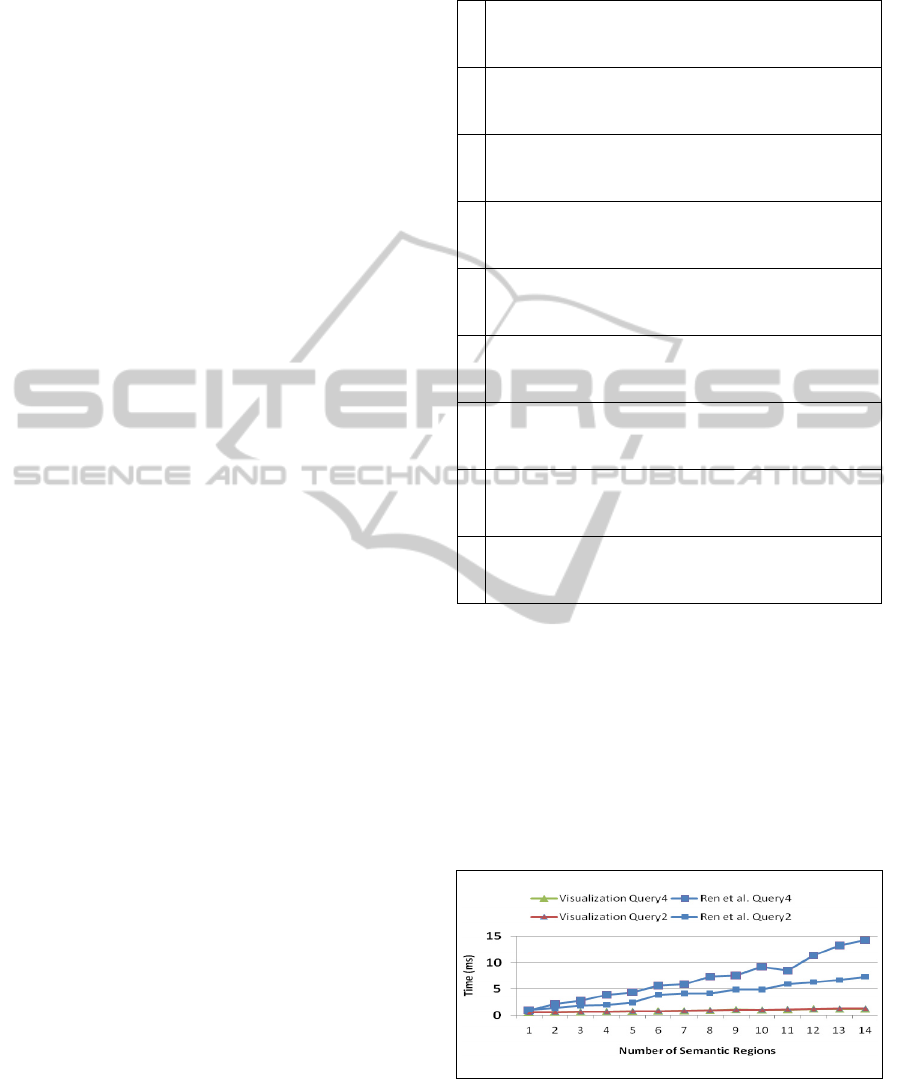
Table 1: Test queries for Case 1 through 5.
Q1
Select t1.x, t1.y, t2.x, t2.y from t1, t2 where t1.x>=3&
t1.x<=8& t1.y>=8&t1.y<=12&t2.x>=4&t2.x<=11&t2.y>=4
& t2.y<=10;
Q2
Select t1.x, t1.y, t2.x, t2.y from t1, t2 where t1.id=t2.id&
t1.x>=0&t1.x<=2&t1.y>=0&t1.y<=2&t2.x>=0&t2.x<=2&
t2.y>=0& t2.y<=2;
Q3
Select t1.x, t1.y, t2.x, t2.y from t1, t2 where t1.id>=t2.id&
t1.x>=5&t1.x<=8&t1.y>=6&t1.y<=8&t2.x>=6&t2.x<=7&
t2.y>=5&t2.y<=7;
Q4
Select t1.x, t1.y, t2.x, t2.y from t1, t2 where t1.id>=t2.id&
t1.x>=1&t1.x<=2&t1.y>=6&t1.y<=8&t2.x>=2&t2.x<=15&
t2.y>=2&t2.y<=7;
Q5
Select t1.x, t1.y, t2.x, t2.y from t1, t2 where t1.id=t2.id&
t1.x>=0&t1.x<=10&t1.y>=0&t1.y<=20&t2.x>=5&t2.x<=10
&t2.y>=2&t2.y<=7;
Q6
Select t1.x, t1.y, t2.x, t2.y from t1, t2 where t1.id=t2.id&
1.x>=3& t1.x<=11&t1.y>=9&t1.y<=14&t2.x>=8&t2.x<=13
& t2.y>=9 & t2.y<=13
Q7
Select t1.x, t1.y, t2.x, t2.y from t1, t2 where t1=t2.id&
t1.x>=3&t1.x<=8&t1.y>=8&t1.y<=12&t2.x>=4&t2.x<=11
& t2.y>=4&t2.y<=10;
Q8
Select t1.x,t1.y,t2.x,t2.y from t1,t2 where t1.id=t2.id&
t1.x>=0& t1.x <=2&t1.y>=0&t1.y<=2& t2.x>=0&t2.x<=2&
t2.y>=0&t2.y<=2;
Q9
Select t1.x,t1.y,t2.x,t2.y from t1,t2 where t1.id>=t2.id&
t1.x>=5 &t1.x<=8&t1.y>=6&t1.y<=8&t2.x>=6&t2.x<=7&
t2.y>=5&t2.y<=7;
Case 1: No Intersection
Figure 2 models the performance of the two methods
for two test queries that represent the case where
there is no probe query generated (Q
PQ
= Ø). For
both examples (Query2 and Query4), the
visualization method is clearly more efficient than
the Ren et al.’s method as the number of semantic
regions increases (Note: Query 2 and Query 4 of
visualization have completely overlapped in the
Figure 2).
Figure 2: No Containment.
Case 2: Full Containment
Figure 3 models performance for our other base
case, where there is no remainder query because the
ICEIS 2011 - 13th International Conference on Enterprise Information Systems
172
user query is fully contained within a semantic
region in cache (Q
RQ
= ∅). Because both algorithms
exit the query trimming process as soon as a null
remainder query is returned, which happens after
semantic region 5, both methods remain consistent
as further new semantic regions are added.
Figure 3: Full Containement.
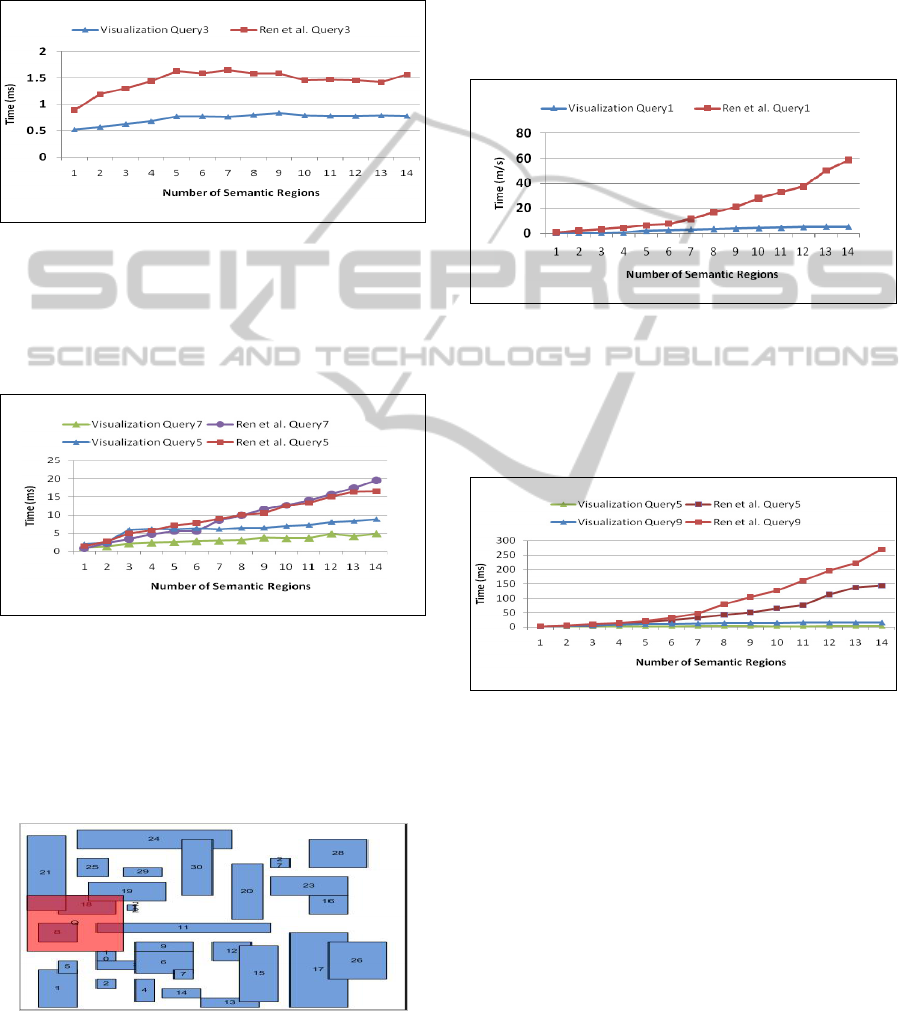
Case 3: Hybrid Query Trimming I
Figure 4 models performance for two relatively
small user queries that require hybrid query
trimming over both tables.
Figure 4: Hybrid Trimming I.
Hybrid trimming means that a semantic region
shares some columns and rows of those columns
with the query (see Figure 5). For both examples
(Query6 and Query7), the visualization method is
more efficient than the Ren et al.’s method as the
number of semantic regions increases.
Figure 5: This box models a user query (red box) that
requires hybrid trimming of the semantic regions (blue
boxes), since it needs both “vertical” and “horizontal”
trimming.
Case 4: Hybrid Query Trimming II
Figure 6 models performance for a user query that
requires the hybrid query trimming over a larger
area of the cache. It places upper and lower bounds
on every attribute selected. This increase in the
complexity of the probe and remainder query has
noticeable effects in the efficiency of the Ren et al.’s
method, which grows in execution time sharply,
while the visualization method grows consistently.
Figure 6: Hybrid Trimming II.
Case 5: Hybrid Query Trimming III
Figure 7 models performance for two user queries
that require more complex hybrid query trimming
over a larger area of cache.
Figure 7: Hybrid Trimming III.
These queries were specifically written to model
a situation in which a query intersects with many
different semantic regions. The differences in
efficiency between the Ren et al. and visualization
methods are extremely pronounced in these cases, as
the graph of the Ren et al.’s method begins to
assume an exponential shape. To offer perspective
on this figure, the Ren et al.’s method took (on
average) 17 times as long as the visualization
method to generate the probe and remainder queries
over 15 regions for Query9, and 47 times as long for
Query5, demonstrating the increased efficiency of
the visualization method for multiple-table joins.
PERFORMANCE EVALUATION OF QUERY TRIMMING STRATEGIES IN SEMANTIC CACHING
ENVIRONMENT
173
4.2 Simple Select Queries
In this section we extended (Makki and Rockey,
2010)’s simulation of single-table queries by
enlarging the number of semantic regions used,
which allowed us to obtain a better comparison of
the Ren et al. and Makki et al.’s methods. We again
made use of the
RelationPredicate() object
class for both programs. This object contains the
attributes, compare predicates, table names, and
primary keys for each query submitted by the user or
stored in cache, making comparisons on the basis of
the attributes or primary keys simple. Each program
was written in Java and ran on a Pentium processor
running Windows Vista with 2 GB of RAM.
4.2.1 Test Cases
As in our multiple-table query simulation, we
modelled an increase in query complexity by
gradually increasing the number of semantic regions
to be processed, beginning with 2 and progressing
up to 30 regions stored in the model cache. We again
chose a variety of test cases, from full containment
of the user query to no intersection between the
query and the semantic regions stored in cache
(Table 2 lists the five test queries). Since we were
interested in observing the change in efficiency of
the respective methods as the complexity of the
query increased, several of these cases represented
overlaps and expansions of each other. Again, this
large sample set allowed us to create graphs to
evaluate our complexity analysis.
Table 2: Test queries for Case1 through 5.
Q1 Select x, y from t where x>60&x<70& y>87&y<97;
Q2 Select x, y from t where x>70&x<78&y>8&y<18;
Q3 Select x, y from t where x>2&x<27&y>35&y<65;
Q4 Select x, y from t where x>22&x<52&y>2&y<77;
Q5 Select x, y from t where x>25&x<70&y>3&y<100;
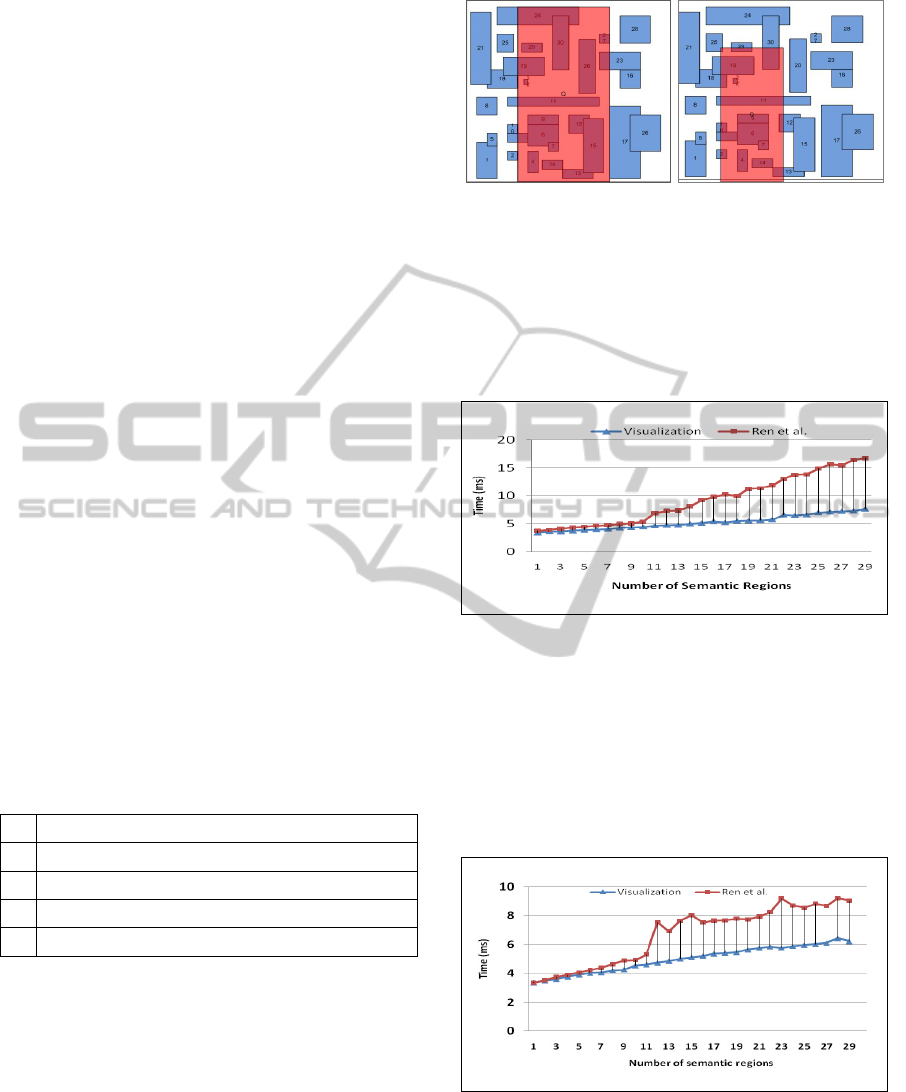
4.2.2 Results for Simple Select Queries
Over the 10 cases that we tested, a consistent pattern
of differing efficiencies between the two methods of
Ren et al. and Makki et al. quickly emerged. The
following is a sample of five specific cases that
illustrate in detail the differences between the two
methods, and serves as a fair representation of the
whole test set in general. These queries can be
modelled in the cache as shown in Figures 8a, 8b.
Figure 8a: Models Query4. Figure 8b: Models Query5.
Case 1: No Intersection
Figure 9 models the performance of the two methods
for one of our two base cases (Query1), where there
is no probe query. Visualization is clearly more
efficient than Ren et al. as the number of semantic
region increases.
Figure 9: No Intersection.
Case 2: Full Containment
Figure 10 models the performance for our other base
case, where there is no remainder query because the
user query is fully contained within a semantic
region in cache (Query2). Again, visualization
remains consistent as the Ren et al.’s method
execution time continues to rapidly grow.
Figure 10: Full Containment.
Case 3: Hybrid Query Trimming I
Figure 11 models performance for a user query that
requires hybrid query trimming over a relatively
small area in a single table (Query3).
ICEIS 2011 - 13th International Conference on Enterprise Information Systems
174
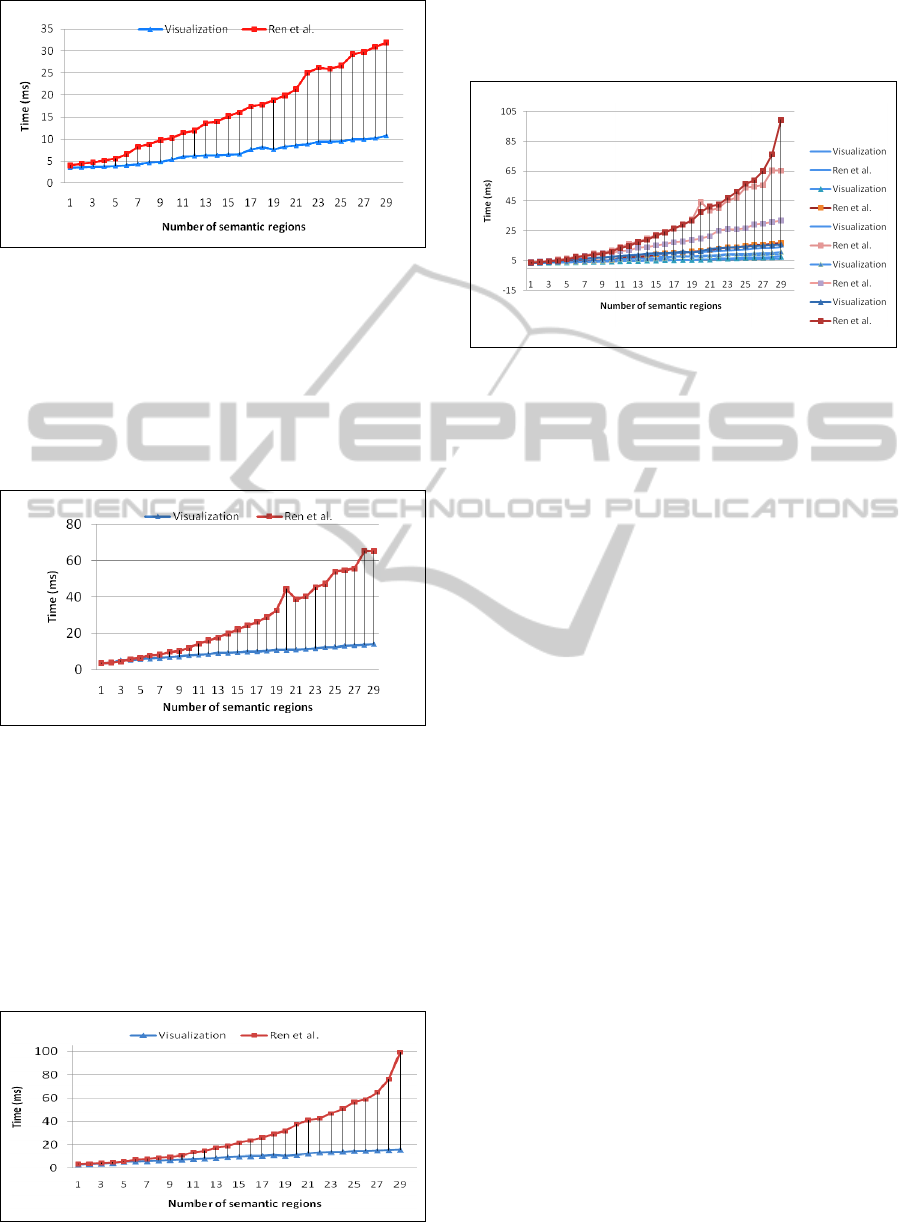
Figure 11: Hybrid Trimming I.
Case 4: Hybrid Query Trimming II
Figure 12 models the performance for a user query
that requires hybrid query trimming over a larger
area of cache (Query4; see Figure 8a). This increase
of complexity has noticeable effects in the efficiency
of the Ren et al.’s method, which grows in execution
time sharply.
Figure 12: Hybrid Trimming II.
Case 5: Hybrid Query Trimming III
Figure 13 models performance for a user query that
requires hybrid query trimming over a still larger
area of cache (Query5; see Figure 8b).
The differences in efficiency between the Ren et
al. and visualization methods are even more
pronounced in this case, as the graph for Ren et al.’s
method assumes a definitively exponential shape
while the visualization grows very slowly.
Figure 13: Hybrid Trimming III.
Figure 14 overlays the graphs of the five
previous cases over each other in order that a scalar
comparison can be made.
Figure 14: Overlay of 5 Cases.
It is immediately obvious from this figure that
the efficiency of the Ren et al.’s method varies
drastically depending on the particular query being
processed, while the visualization method is of
nearly identical efficiency and grows linearly no
matter what query is being processed. While this
variation means that in some cases (such as full
containment) Ren et al.’s method may be only
slightly less efficient than the visualization method,
visualization is consistently a much more efficient
algorithm than Ren et al. Further, it is clear that the
more complex the user query is, the more closely the
Ren et al.’s method follows an exponential growth
pattern, while visualization remains linear,
confirming our previous analysis.
5 CONCLUSIONS
This paper compared a new technique for semantic
caching, visualization, with the previous Ren et al.’s
method with regards to complexity and efficiency.
Both methods were explained and their relationships
to the problem of satisfiability were explored. Our
initial complexity analysis of the Ren et al. and
visualization algorithms was supported by our two
simulation studies of the two methods, where the
visualization method proved consistently more
efficient--O(n)--than the Ren et al.’s method as the
complexity of the query increased for both single
and multiple table queries. This finding
demonstrates that the visualization method is a faster
and simpler method for query optimization and
processing and it represents a significant
improvement over previous methods.
PERFORMANCE EVALUATION OF QUERY TRIMMING STRATEGIES IN SEMANTIC CACHING
ENVIRONMENT
175

REFERENCES
Dar, S., Franklin, M., Jónsson, B, Srivastava, D., Tan, M.
“Semantic Data Caching and Replacement.”
Proceedings of the 22
nd
VLDB Conference, 1996.
Ren, Q., Dunham, M. Kumar, H., “Semantic Caching and
Query Processing.” IEEE Transactions on Knowledge
and Data Engineering, V. 15, no. 1, 2003.
Guo, S., Sun, W., and Weiss, M. A., “Solving satisfiability
and implication problems in database systems.” ACM
Transactions on Database Systems, V. 21, no. 2, 1996.
Hao, X., Zhang, T., and Li, L., “Optimization technology
of query processing based on logic rules in semantic
caching.” Chinese Journal of Computers, vol. 28, no.
7, pp. 1096-1103, July 2005.
Li, D., Ye, Y., and Xie, F., “Optimization technology of
query trimming in semantic caching,” Application
Research of Computers. V. 25, no. 12, Dec. 2008.
Makki, S. K., Rockey, M., "Query Visualization for Query
Trimming in Semantic Caching," IEEE 24th
International Conference on Advanced Information
Networking and Applications Workshops, pp. 443-448,
2010.
Rosenkrantz, D. J. and Hunt, H. B., “Processing
Conjunctive Predicates and Queries.” Proceedings of
the 6
th
VLDB Conference, pp. 64-71, 1980.
ICEIS 2011 - 13th International Conference on Enterprise Information Systems
176
