
WIDEBAND WIRELESS PROPAGATION IN CONFINED SPACES
Asrar U. H. Sheikh, M. Imran Akram and Khurram Masood
Electrical Engineering Department, King Fahd University of Petroleum and Minerals, 31261 Dhahran, Saudi Arabia
Keywords:
Radio propagation, Indoors, Impulse response, Modeling.
Abstract:
This paper presents the results of channel sounding experiment performed in confined environment. The
swept time-delay cross-correlation technique is used as a method for sounding to measure the channel impulse
response (CIR). PDF of the envelope and power for the received CIR is presented.The path loss exponent has
been calculated. The data has been analysed for impulse response and channel parameters like average delay,
rms delay spread, number of paths and channel bandwidth. The CIR is used in calculation of total received
power.
1 INTRODUCTION
Wireless and personal communication networks
(WPCN) operating in the frequency range upto 3 GHz
proposed for wireless communications in confined
spaces have significant advantages over wired tele-
phone networks. Random distributions of reflectors,
scatterers and people movement make the confined
channel time variant. This makes the radio propaga-
tion inside such environment a complex phenomenon.
Thus, to design an efficient wireless network, it is
deemed essential to understand the nature of chan-
nel in the confined spaces. Many researchers have
studied the indoor radio propagation in 900 MHz and
1 to 2 GHz frequency bands and provided informa-
tion on channel parameters (Seidel and Rappaport,
1992),(Hawbaker and T.S.Rappaport, 1990),(U. Der-
sch and Zollinger, 1994). (A. Chandra, 1999) investi-
gates distance dependencepropagationof radio waves
at 450 MHz, 900 MHz, 1.35 GHz and 1.89 GHz in
the corridor of the second, first and ground floor of
an institute building. Measurement and characteriza-
tion of multiple antenna system has been performed
in (Poon and Ho, 2003). Reference (X. Zhao, 2002)
deals with the outdoor measurement data at 5.3 GHz.
The measurements were performed in urban, subur-
ban and rural environments. (SALOUS, 1999) deals
with the both indoor and outdoor measurements and
characterization using chirp sounder.
Path loss in an indoor environment is very severe
most of the time. It is also very dynamic, chang-
ing appreciably over short distances. Simple path
loss rules are successful in describing the mobile
channel, but not the indoor channel (Asrar Sheikh,
2010). The channels parameters have great depen-
dence on the shape, size and construction of the build-
ing (H.Hashemi, 1993).
Researchers have studied the radio propagation
in confined spaces in UWB frequency bands (Si-
mon Chiu and Michelson, 2010),(Abdellah Chehri,
) for making available information on channel pa-
rameters. Due to increase in voice and data traffic,
the channel characterization of confined environment
has become important. For this purpose, this paper
focuses on the channel characterization in confined
spaces. Experiments have been conducted and data
has been analyzed to determine key parameters for
such environments. These include the path loss ex-
ponent, path arrival time, excess delay, delay spread,
bandwidth and the diffraction loss.
The paper has been arranged in the following or-
der. Section 2 presents the details of channel sound-
ing system used. In Section 3 the details of the ex-
periments along with the analysis and results are pre-
sented. Finally Section 4 concludes the paper.
2 CHANNEL SOUNDING
SYSTEM
Channel sounders were first used for mobile radio
sounding by Young and Lacy at 450 MHz (Young
W. R., 1950) in urban New York City with a pulse
duration of 500 ns and later by Turin (Turin G. L.,
1972). De Lange (E., 1952) also used 3 ns pulses for
propagation studies at 4 GHz. The channel sounder
used here overcomes the limitations of old sounder. It
103
U. H. Sheikh A., Imran Akram M. and Masood K..
WIDEBAND WIRELESS PROPAGATION IN CONFINED SPACES.
DOI: 10.5220/0003442701030108
In Proceedings of the International Conference on Wireless Information Networks and Systems (WINSYS-2011), pages 103-108
ISBN: 978-989-8425-73-7
Copyright
c
2011 SCITEPRESS (Science and Technology Publications, Lda.)

utilizes the swept time-delay cross-correlation tech-
nique which is a very well known method of chan-
nel sounding. A pseudo-random bit sequence (PRBS)
of length 511 and a chip rate of 30 MHz is used to
phase reversal modulate an RF carrier signal at 1.8
GHz which is amplified and then transmitted. At
the receiver, the incoming signal is correlated with a
local oscillator signal which is phase-reversal mod-
ulated by a pseudo-random binary sequence identi-
cal to that at the transmitter but clocked at a slightly
slower rate. The output of the correlation process rep-
resents the impulse response of the multipath chan-
nel, scaled in time. The normalized auto-correlation
function R
c
(t), for a maximum length pseudo-random
binary sequence (PRBS) of length N is given by the
following relation:
R
c
(t) =
1+
1+(
1
N
)t
τ
0
, for −τ
0
≤ t ≤ 0
1−
1+(
1
N
)t
τ
0
, for 0 ≤ t ≤ τ
0
−
1
N
, otherwise
(1)
where τ
c
is the chip duration which equals to 33 nsec
in our case. It is easy to see that each echo will have a
base width of 2τ
c
. To record one sample per delay bin
at a chip rate of 30 MHz, the sampling rate is given
by:
sampling rate =
1sample
chip duration× scaling factor
(2)
The output of the correlation process is equivalent
to the time scaled version of the impulse response of
the channel. The scaling factor is determined by the
ratio of transmitter chip rate and slip rate (the differ-
ence in clock rate) and is given by:
sampling factor =
chip rate
slip rate
(3)
For two samples per delay bin will require a sam-
pling rate of 16 Hz and for 4 samples per delay bin the
sampling rate is doubled to 32 KHz. In our case the
sliding correlator uses a 30 MHz chip rate and 8 KHz
slip rate to give a time scaling and bandwidth com-
pression factor of 3750. Thus, for a sequence length
of 511 and sampling rate of 28 KHz, the power delay
profile length 17.1 µsec is recorded in 64.125 msec
after time scaling.
2.1 System Calibration
Calibration of the measurement system is important.
For this purpose we use back to back tests with dif-
ferent known attenuations. The receiver video output
is in the form of voltage. This means the voltage that
is received in the range from 0 - 10 V is converted
0 2 4 6 8 10
40
45
50
55
60
65
70
75
80
Voltage [v]
External RF Attenuation [dB]
Calibration Curve of the Channel Sounder
Figure 1: Calibration curve of the channel sounder system.
to power in dB using the calibration equation derived.
For the back to back tests the transmitter was con-
nected to the receiver via an external RF attenuator
having a wide range of adjustment. The tests were
performed by adjusting the setting of the attenuator
in the range from 50 to 70 dB. The corresponding re-
ceived voltages were used in obtaining the following
attenuation equation
P
l
(dB) = −2.4V + 71.7− AGC (4)
where AGC is the automatic gain control used at the
receiver side to avoid the clipping of received signal.
The corresponding calibration curve is shown in Fig-
ure 1. The absolute receivedpower is calculated using
following relations
P
r
(dBm) = P
t
(dBm) − P
l
(dB) (5)
where P
t
and P
r
are the transmitted and received
power respectively and P
l
is the corresponding atten-
uation. For the channel sounder used in experimenta-
tion the transmitted power is fixed at 10 dBm.
3 EXPERIMENTAL DATA AND
ANALYSIS
3.1 Experimental Setup
The data was collected in the car park (B3) and cor-
ridors of Lab (LA), Ground (G) and 1
st
floor in Elec-
trical Engineering Department building at KFUPM.
Measurements are taken at regular intervals along the
LOS path and also along the path perpendicular to the
LOS corridor in order to calculate the path loss ex-
ponent and diffraction loss as shown in Figure 2 to
Figure 4.
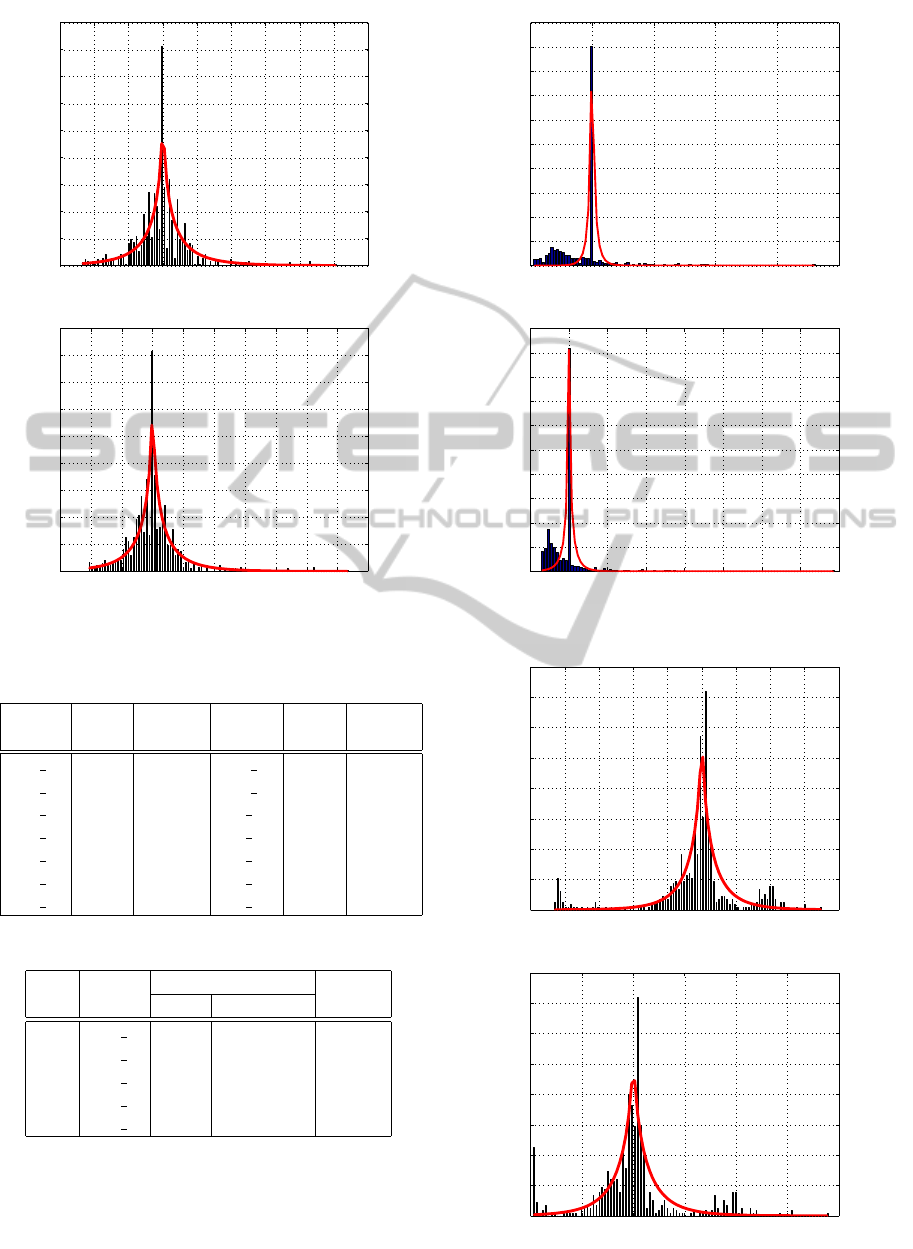
3.2 Data Analysis
The pdf of the envelop and power of 1
st
path for all
the confined spaces is given in Figure 5 to 8. Ta-
WINSYS 2011 - International Conference on Wireless Information Networks and Systems
104
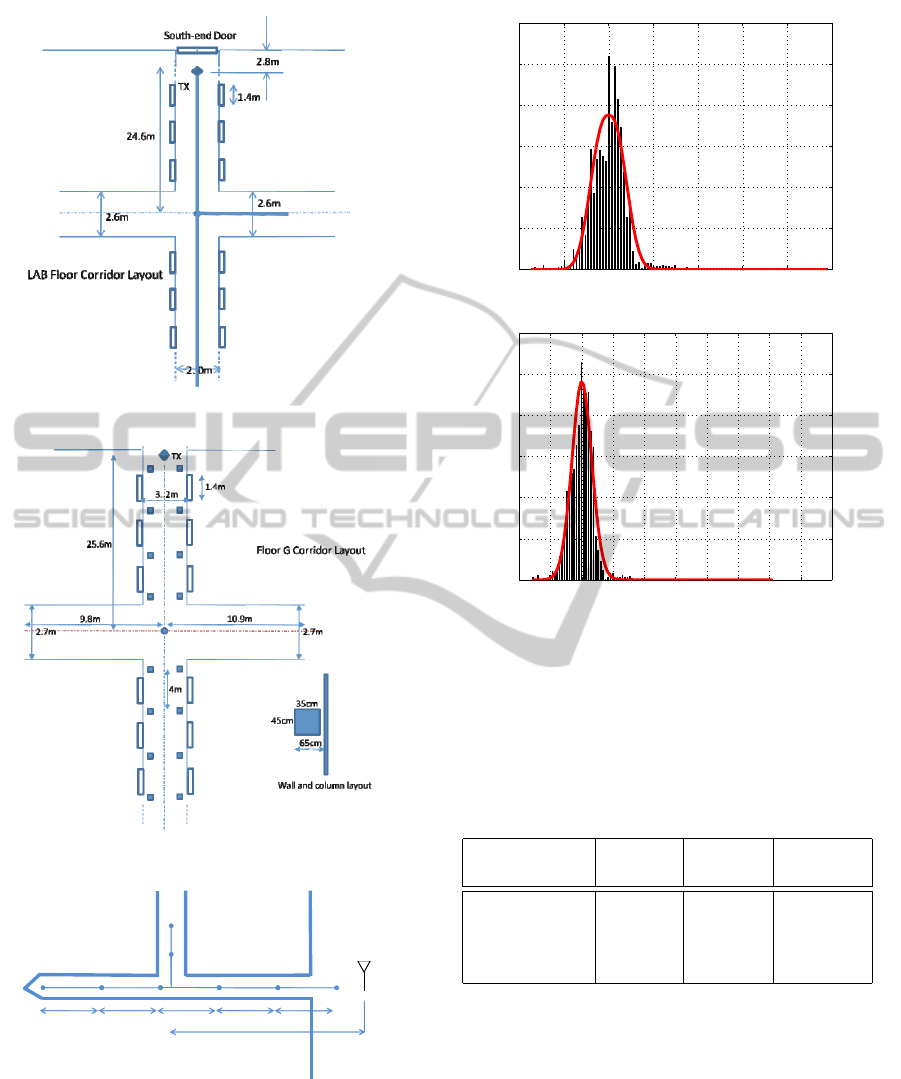
Figure 2: Layout for LA floor.
Figure 3: Layout for Ground floor.
F1X05
F1X10
F1_4
F1_3
F1_1 F1_2
F1_5
F1_6
5m
5m
31m
10m 10m 10m
10m 10m
Tx
Figure 4: Layout for 1
st
floor.
ble 1 gives the arrival time statistics for the confined
spaces. Arrival time for 3 paths has been listed for
Car park B3, Floor LA and Ground Floor whereas for
Floor 1 there are only 2 path arrival times which are
listed. Floor G has a large arrival time for the 2
nd
and 3
rd
path, which is due to the NLOS data. Also
0.8 0.9 1 1.1 1.2 1.3 1.4 1.5
0
0.02
0.04
0.06
0.08
0.1
0.12
Histogram of envelop of path 1
Amplitude, X
PDF, p(X)
0.8 1 1.2 1.4 1.6 1.8 2 2.2 2.4 2.6
0
0.02
0.04
0.06
0.08
0.1
0.12
Power, P
PDF, p(P)
Power Histogram
Figure 5: Amplitude and power PDF for B3.
for the Floor 1 we have a large arrival time for the
2
nd
path, which is due to the presence of open space
when the data is recorded (Asrar Sheikh, 2010). Ta-
ble 2 gives the received power as the sum of all the
peaks in the CIR for the car park B3. The distances
Table 1: Path arrival time for different confined spaces.
1
st
path 2
nd
path 3
rd
path
[nsec] [nsec] [nsec]
Car park B3 39.9064 92.1170 144.3275
Floor LA 31.1987 89.5895 141.7143
Floor Ground 30.858 198.62 775
Floor 1 26.5 168.6 —
between the transmitter and receiverare also given for
different observations. Similar readings are given for
other confined spaces in Table 3, 4 and 5. The calcu-
lations for the path loss exponent for these confined
spaces gives us the values as shown in Table 6.
As can be seen from the Figure 4, there is an open-
ing in the corridor at 31 meters from the transmitter.
This results in two different scenarios and hence the
2 path loss exponents as given in Table 6. Table 7
summarizes the measured channel parameters - num-
ber of paths, average access delay, rms delay spread
and the coherence bandwidth. It should be noted that
WIDEBAND WIRELESS PROPAGATION IN CONFINED SPACES
105
0.7 0.8 0.9 1 1.1 1.2 1.3 1.4 1.5 1.6
0
0.02
0.04
0.06
0.08
0.1
0.12
0.14
0.16
0.18
Histogram of envelop of path 1
Amplitude, X
PDF, p(X)
0.4 0.6 0.8 1 1.2 1.4 1.6 1.8 2 2.2
0
0.02
0.04
0.06
0.08
0.1
0.12
0.14
0.16
0.18
Power, P
PDF, p(P)
Power Histogram
Figure 6: Amplitude and power PDF for LA.
Table 2: Car park (B3) Tx and Rx distances and received
power.
Name Dist. Power Name Dist. Power
[m] [dBm] [m] [dBm]
B3 1 10 -24.83 B3 8 80 -42.22
B3 2 20 -27.34 B3 9 90 -35.29
B3 3 30 -26.00 B3 10 110 -33.25
B3 4 40 -26.40 B3 11 120 -34.97
B3 5 50 -34.17 B3 12 130 -38.03
B3 6 60 -42.71 B3 13 140 -41.29
B3 7 70 -44.08 B3 14 150 -38.02
Table 3: Floor LA Tx and Rx distances and received power.
No. Name Distance [meters] Power
LOS Lateral [dBm]
1 LA 1 16 0 -37.05
2 LA 2 18 0 -37.51
3 LA 3 25 0 -36.99
4 LA 4 25 8 -47.14
5 LA 5 16.5 5 -46.12
the maximum number of paths has been limited to 10
for the analysis. This is visible in the paths column
for Floor LA, where 10 paths are listed. Also the data
with single path received is not included in the table.
Diffraction loss is defined as that part of the re-
0.5 1 1.5 2 2.5 3
0
0.05
0.1
0.15
0.2
0.25
0.3
0.35
0.4
0.45
0.5
Histogram of envelop of path 1
Amplitude, X
PDF, p(X)
0 1 2 3 4 5 6 7 8
0
0.05
0.1
0.15
0.2
0.25
0.3
0.35
0.4
0.45
0.5
Power, P
PDF, p(P)
Power Histogram
Figure 7: Amplitude and power PDF for FG.
0 0.2 0.4 0.6 0.8 1 1.2 1.4 1.6 1.8
0
0.02
0.04
0.06
0.08
0.1
0.12
0.14
0.16
Histogram of envelop of path 1
Amplitude, X
PDF, p(X)
0 0.5 1 1.5 2 2.5 3
0
0.02
0.04
0.06
0.08
0.1
0.12
0.14
0.16
Power, P
PDF, p(P)
Power Histogram
Figure 8: Amplitude and power PDF for F1.
WINSYS 2011 - International Conference on Wireless Information Networks and Systems
106
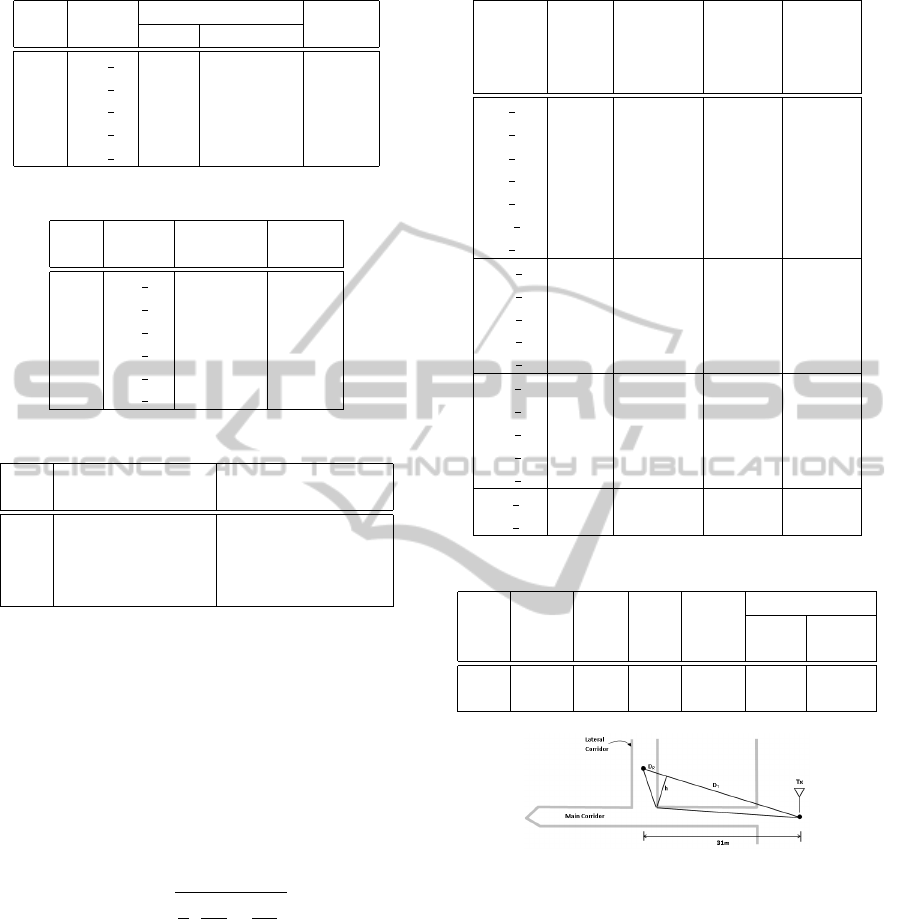
Table 4: Ground Floor Tx and Rx distances and received
power.
No. Name Distance [meters] Power
LOS Lateral [dBm]
1 FG 1 23 0 -37.04
2 FG 2 25.5 4.5 -38.10
3 FG 3 25.5 6.5 -39.86
4 FG 4 25.5 9.5 -44.53
5 FG 5 25.5 11 -39.46
Table 5: Floor 1 Tx and Rx distances and received power.
No. Name Distance Power
[meters] [dBm]
1 F1 1 54 -32.23
2 F1 2 44 -27.65
3 F1 3 34 -21.9
4 F1 4 24 -28.08
5 F1 5 14 -23.89
6 F1 6 04 -13.28
Table 6: Path loss exponent.
No. Confined Space Path loss Exponent
n
1 Car park B3 1.21
2 Lab Floor LA 2.06
3 Ground Floor FG 0.91
4 1
st
Floor F1 1.93 and 5.14
duction in power of a propagating wave or beam that
results from diffraction. The diffraction loss has been
calculated for Floor 1 with lateral distances of 5 and
10 meters. The calculated distances and power values
are tabulated in Table 8. The received power at 31.98
and 33.88 meters from the transmitter are calculated
by interpolation. The Diffraction loss can be approx-
imated using the Knife Edge diffraction model given
in (T.S.Rappaport, 2002).
P
dl
(dB) = 13 + 20log(ν) (6)
where
ν = h
r
2
λ
(
1
D
T
+
1
D
R
) (7)
Where P
dl
is the diffraction loss, ν is the Fresnel pa-
rameter, λ is the wavelength (16.7 cm) correspond-
ing to 1.8 GHz frequency. Here h, D
T
and D
R
are
the height, transmitter and receiver distances respec-
tively as shown in the Figure 9. From this, The value
of ν and P
dl
are obtained as given in Table 8. The
table shows that the measured and calculated values
are comparable. Similar approach has also been used
previously by (J. Francois, 1990) which shows the va-
lidity of this model where it has been mentioned that
on the same floor the vertical polarization has an ad-
vantage of 4 dB over horizontal polarization.
Table 7: Summary of channel parameters for Confined
Spaces.
Data Paths Average RMS B
c
File Excess Delay kHz
Name Delay Spread
µsec µsec
B3 20 2 0.0057 0.0482 4147.8
B3 30 2 0.0041 0.0400 5005.4
B3 60 2 0.0120 0.0547 3654.0
B3 70 3 0.0144 0.0507 3948.6
B3 80 2 0.0057 0.0394 5076.0
B3 9 2 0.0105 0.0437 4579.7
B3 11 2 0.0021 0.0314 6375.9
LA 1 10 0.0290 0.1641 1218.9
LA 2 10 0.0508 0.3269 611.8
LA 3 10 0.0318 0.1644 1216.4
LA 4 10 0.1028 0.1413 1415.3
LA 5 10 0.0857 0.1511 1323.3
FG 1 4 3.9195 2.4601 81.3
FG 2 9 1.1377 0.6028 331.8
FG 3 7 0.5840 0.6551 305.3
FG 4 9 1.2416 1.0256 195.0
FG 5 8 1.5303 1.1179 178.9
F1 5 2 0.0025 0.0301 6650.5
F1 6 2 0.0103 0.0436 4582.4
Table 8: Diffraction Loss.
Lat. D
T
D
R
h Fres. Diff. Loss P
dl
Dist Para. Calc. Meas.
[m] [m] [m] [m] ν [dB] [dB]
5 30.62 1.36 4.91 14.92 36.5 30.1
10 29.7 4.18 9.13 16.51 37.4 31.1
Figure 9: Diffraction Loss Knife edge model.
4 CONCLUSIONS
Channel sounding experiment conducted in confined
environment has been presented in this paper. The
path loss for the LOS has been computed using the
sum of power of all the paths received. Path loss ex-
ponent for Floor LA and Floor 1 is closer to 2 (for
free space), suggesting a line of sight (LOS) propa-
gation in these spaces. The small value of path loss
exponent for Ground Floor is due to the NLOS nature
of the data. For Car Park B3 small value of path loss
exponent is due to the slope which creates a NLOS
WIDEBAND WIRELESS PROPAGATION IN CONFINED SPACES
107

scenario.
The path arrival time for the 1
st
path is almost the
same for all the confined spaces. For Floor G and
Floor 1 the other paths arrive at a larger time because
of NLOS in Floor G and open space in Floor 1.
The channel statistics show that for Floor LA and
Floor G we have a large excess delay and rms delay
spread, resulting in a smaller coherence bandwidth.
Whereas for the Floor 1 and B3 we have a smaller
excess delay and higher coherence bandwidth.
Diffraction loss has also been computed theoreti-
cally for Floor 1 using the Knife edge geometry and
practically taking the power difference. There is a dif-
ference of 6 dB in the results which is due to the ap-
proximation in the theoretical model.
ACKNOWLEDGEMENTS
This work was carried out under SABIC Fast track
project SB-00910. The authors would like to thank
King Fahd University of Petroleum and Minerals for
this research opportunity.
REFERENCES
A. Chandra, A. Kumar, P. (1999). Comparative study of
path losses from propagation measurements at 450
mhz, 900 mhz, 1.35 ghz and 1.89 ghz in the corri-
dors of a multifloor laboratory-cum-office building. In
IEEE Vehicular Technology Conference (VTC 1999-
Fall), Amsterdam, the Netherlands.
Abdellah Chehri, Paul Fortier, P. M. T. Characterization of
the ultra-wideband channel in confined environments
with diffracting rough surfaces. In Wireless Pers Com-
mun DOI 10.1007/s11277-010-0097-2.
Asrar Sheikh, Muhammad Imran Akram, M. K. (2010).
Wireless channel characterization in an indoor en-
vironment. In The 13th International Symposium
on Wireless Personal Multimedia Communications
(WPMC 2010).
E., D. L. O. (Jan. 1952). Propagation studies at microwave
frequencies by means of very short pulses. In BSTJ,
pp. 91-103.
Hawbaker, D. and T.S.Rappaport (1990). Indoor wideband
radiowave propagation measurements at 1.3 ghz and
4.0 ghz. In Electronics Letters,Vol.26,No. 1.
H.Hashemi (July 1993). The indoor radio propagation
channe1. In Proceedings of the IEEE,Vol.81 No.7 pp.
943- 968.
J. Francois, M. L. (1990). Measurement and modeling of
propagation loses in a building at 900 mhz. In IEEE
Transaction on vehicular technology, Vol.39,No. 2.
Poon, A. S. Y. and Ho, M. (2003). Indoor multiple-antenna
channel characterization from 2 to 8 ghz. In ICommu-
nications and Interconnect Lab, Intel Corporation.
SALOUS, S. H. (1999). Wideband mobile radio channel
characterization. In Annals of Telecommunications,
Volume 54, Numbers 1-2, 103-11.
Seidel, S. and Rappaport, T. (1992). 914 mhz path loss pre-
diction models for wireless communications in multi-
floored buildings. In IEEE Trans. Antennas Propaga-
tion. Vol.40, No.2, pp.207-217.
Simon Chiu, J. C. and Michelson, D. G. (March 2010).
Characterization of uwb channel impulse responses
within the passenger cabin of a boeing 737-200 air-
craft. In IEEE Transactions on Antennas and Propa-
gation page:935 vol:58 issue:3.
T.S.Rappaport (2002). Wireless Communications: Princi-
ples and Practice. Prentice Hall, 2nd edition.
Turin G. L., Clapp E. D., J. T. L. F. S. B. L. D. (1972). A
statistical model of urban multipath propagation. In
IEEE Trans. on VT, 21, pp. 1-9.
U. Dersch, J. T. and Zollinger, E. (1994). Multiple reflec-
tions of radio waves in a corridor. In IEEE Trans.
on Antenna and Propagation,Vol. 42, No.9, pp. 157
1- 1574.
X. Zhao, J. Kivinen, P. V. K. S. (April 2002). Propagation
characteristics for wideband outdoor mobile commu-
nications at 5.3 ghz. In IEEE Journal on selected ar-
eas in communications, vol. 20, NO. 3.
Young W. R., L. L. Y. (March 1950). Echoes in transmission
at 450 megacycles from land-to-car radio units. In
Proc. IRE, 38, pp. 255-258.
WINSYS 2011 - International Conference on Wireless Information Networks and Systems
108
