
JHYDE - THE JAVA HYBRID DEBUGGER
Christian Hermanns and Herbert Kuchen
Institute of Information Systems, University of M¨unster, Leonardo-Campus 3, M¨unster, Germany
Keywords:
Java, Debugging, Hybrid, Declarative, Omniscient, Coverage Criteria, Divide and Query.
Abstract:
We present a hybrid debugger for the Java programming language which integrates declarative and omniscient
debugging techniques. Omniscient debugging is an extension of trace debugging which is the most common
debugging method for Java programs. Declarative debugging is a technique mostly used in the area of func-
tional and logic approaches. By combining both techniques our debugger benefits from the advantages of
both techniques. We demonstrate how to use our debugger and mention important aspects of its implementa-
tion. Furthermore, we develop a declarative debugging strategy to reduce the number of questions and give
empirical evidence of its usefulness.
1 INTRODUCTION
Debugging is a complex and time-consuming task of
the software development process. Software develop-
ers spend a considerable amount of time debugging,
trying to locate bugs in software programs. Reducing
the time and effort required to detect a bug can greatly
increases the efficiency and productivity of software
development (Hailpern and Santhanam, 2002).
No matter what debugging method or tools are
used to locate a bug, the general debugging process
looks as follows (cf. (Zeller, 2005)). At first the user
notices a failure, i.e. an externally observable error in
the program behavior. The failure is caused by an in-
fection, that is a deviation of the actual program state
from the intended program state. The task of the user
is to locate the bug, i.e. the defect statement(s) in the
debuggee program which caused the initial infection.
In many cases the initial infection does not directly
result in an observable program failure. Instead, it is
propagated into later program states causing further
infections which eventually cause a program failure.
As a consequence, the user has to reason backwards
in the execution history from the failure to the bug.
Until today, the most common debuggers used for
object-oriented programming languages like Java are
program tracers which track the execution of a de-
buggee program in a step-by-step manner. A trace
debugger works on a low level of abstraction. Start-
ing at a breaking point which predates the bug in the
execution history the user has to inspect the sequence
of statements executed by the debuggee program. The
debugging process ends when the user encounters a
buggy statement, i.e. bug, which produces the initial
infection. While this method works well for a nar-
row search space, it can be very annoying and time-
consuming if there aren’t any clues about the position
of the bug.
To minimize debugging effort the starting point
should be as close to the bug as possible. However,
the defect as well as its position in the execution his-
tory are unknown. When selecting a starting point
for program tracing, we risk to select a point which
lies chronologically either far before or even after the
bug. In the first case we will have to inspect a lot of
instructions and in the second case we will have to
restart debugging with an earlier starting point.
Another severe drawback of trace debuggers is the
fact that they are only capable of executing the de-
buggee program forward in time, while the reasoning
from the program failure to the program defect natu-
rally happens backwards in time. Omniscient debug-
ging (Lewis, 2003), an extension of the trace debug-
ging technique, addresses these shortcomings. The
idea is to record the entire execution history of a de-
buggee program, making it possible to inspect the ex-
ecution history back and forth in time. Nevertheless,
even omniscient debugging takes place on a relatively
low level of abstractions where the user still has to
check single statements for validity.
A debugging method which abstracts from the de-
tails of implementation is declarative debugging. The
method was developed by E. Y. Shapiro (Shapiro,
1983) for the Logic Programming paradigm. It
was later applied to other declarative programming
paradigms such as functional (Nilsson, 2001) and
25
Hermanns C. and Kuchen H..
JHYDE - THE JAVA HYBRID DEBUGGER.
DOI: 10.5220/0003441200250035
In Proceedings of the 6th International Conference on Software and Database Technologies (ICSOFT-2011), pages 25-35
ISBN: 978-989-8425-77-5
Copyright
c
2011 SCITEPRESS (Science and Technology Publications, Lda.)

functional logic (Caballero and Rodr´ıguez-Artalejo,
2002) programming. A declarative debugger asks the
user questions about the validity of the program ex-
ecution and infers the location of the bug from the
user’s answers. The precision by which the location
of a bug can be detected depends on the level of ab-
straction of the declarative debugger. The more ab-
stract the questions, the less precise the location of
the bug can be determined. For example, a declara-
tive debugger asking questions about the validity of
method calls is able to detect a method containing a
defect, but it cannot tell which statement inside the
method is defect.
In this paper we present JHyde (Java Hybrid
Debugger), a debugger which implements a hybrid
debugging method for the object-oriented language
Java. JHyde combines omniscient and declarative de-
bugging into one debugging tool. In general, our hy-
brid debugging method looks as follows. At first the
declarative debugging method is used to locate the
method call causing the initial infection. After that
omniscient debugging functionality is used to find the
buggy statement inside the method. Thus, the user
can at first, during the declarative debugging process,
concentrate on “what” the method calls do and can
ignore “how” the calls work internally. Afterwards,
the identified call causing the initial infection pro-
vides a narrow search space for the omniscient debug-
ging method. That way, our hybrid debugging tech-
nique abstracts from the implementation details dur-
ing declarative debugging but is yet capable of iden-
tifying the exact buggy statement by means of omni-
scient debugging.
JHyde is based on a declarative debugger for the
Java programming language which we developed in
former work (Caballero et al., 2007). The main con-
tribution of this paper is to show how omniscient and
declarative debugging can be combined. We present
JHyde which is available for download (Hermanns,
2010) and show important aspects of implementation.
Furthermore, we have developed a declarative debug-
ging strategy based on coverage information which
reduces the number of method calls a user has to in-
spect. Tests show that this strategy saves up to 40
percent of the debugging effort.
The rest of the paper is organized as follows: In
the next section we present our hybrid debugging
technique for Java programs. Section 3 describes the
user interface of JHyde, a prototypical plugin for the
Eclipse IDE (Eclipse Foundation, 2010) which imple-
ments the hybrid debugging technique. To show how
our debugger behaves in practice, we debug a sam-
ple program using JHyde in Section 4. In Section 5
we provide some implementation details. Section 6
presents some test results which proof the usefulness
of the coverage-based search strategy. In section 7
we discuss how our paper is related to other works in
this field. This paper ends with section 8, where we
conclude and point out future work.
2 HYBRID DEBUGGING
TECHNIQUE
2.1 Overview
As indicated before the general idea of our hybrid de-
bugging technique is to combine elements of omni-
scient debugging and declarativedebugging. Declara-
tive debugginghasthe benefit that it works on a higher
level of abstraction relieving the user from the task
to inspect implementation details. Nevertheless, it is
somewhat imprecise. For example, a declarative de-
bugger for Java Programs is only able to identify the
method containing the bug, but not the buggy state-
ments inside the method.
This is where the omniscient debugging function-
ality of our debugger comes into play. Once the
method call causing the initial infection is found using
declarative debugging, the user can resort to the om-
niscient debugging. By tracking the execution of the
method call in a step-by-step manner back and forth in
time, the user can exactly determine the buggy state-
ment(s).
2.2 Declarative Debugging
Declarative debugging requires the execution of the
debuggee program to be represented by a computation
tree (CT). To enable the declarativedebugging of Java
programs we have defined a suitable CT data structure
in (Caballero et al., 2007). In our data structure each
node of the CT will contain information about a par-
ticular method call of the computation. Let a be a
node of the CT containing information about a call of
method m
a
. Child nodes of a correspond to calls that
have been executed during the computation of the re-
sult of a.
During the declarative debugging process the user
will be asked to classify nodes of the CT. A node has
to be classified as valid if the represented method call
produced a valid result, i.e. the return value includ-
ing all side effects and as invalid if the represented
method call produced an invalid result. Furthermore,
a method can be classified as trusted if we know that
it does not contain any defects. In this case every node
representing a call of the trusted method is automati-
ICSOFT 2011 - 6th International Conference on Software and Data Technologies
26

cally trusted. A trusted node will not cause an infec-
tion, but it can have untrusted subnodes which could
infect the program state.
The classification of the nodes is used to reduce
the set of suspicious nodes, i.e. the set of nodes that
can be buggy. We define N as the set of all nodes of
the CT and A
i
⊆ N as the set of suspicious nodes af-
ter the i-th user answer. At the beginning A
0
contains
all nodes of the CT, i.e. A
0
= N. Furthermore, let
S
a
⊆ N be the set of all nodes of the subtree rooted
at node a in the CT. If node a ∈ A
i−1
is classified, the
suspicious set A
i−1
can be reduced by the following
rules. If node a is classified as valid, all its subn-
odes are automatically valid, i.e. A
i
= A
i−1
\ S
a
. If
a method call is classified as invalid either the call it-
self or any of its sub calls must be the buggy method
call we are looking for. Hence, the debugger will
continue the search in the subtree of this method call
and we get A
i
= S
a
. If a method call is classified as
trusted, then all calls of the same method will also be-
come trusted. JHyde will not ask any questions about
trusted method calls. However, a trusted method call
can have unclassified child calls. These calls must
be considered in the further debugging process. Thus,
A
i
= A
i−1
\{b ∈ A
i−1
|m
b
= m
a
}. A method call’s state
can be set to unclassified if the user is not sure about
the classification and wants to categorize it later.
If at least one method call has been classified as
invalid, the size of the suspicious set is eventually re-
duced to 1, i.e. ∃z ∈ N : |A
z
| = 1. The only node
n remaining in A
z
is an invalid node with no invalid
children. The call represented by the buggy node pro-
duced an invalid result while its inputs, i.e. the argu-
ments provided by the parent call and the return val-
ues of the child calls, are all valid. We call this node
the buggy node. The method call associated to the
buggy node must contain a bug we are looking for.
A method call in an object-oriented language can
produce side effects which are considered to be part
of its result. These side effects must be taken into
account during classification of a method call. Hence,
the data presented to the user at each node of our CT
will be:
• The fully qualified name of the method being
called.
• All local variables of the method call, i.e. the ar-
guments of the call and all locally defined vari-
ables. In case of a call to a non-static method
the “this” reference to the object whose method
is being called is also considered as an argument.
For each local variable an entry and an exit value
will be stored. The entry value is the variable’s
value at the beginning of the method call and can
be regarded as part of the method’s input. The exit
value is the value at the end of the call and belongs
to the method’s result.
• The fields of referenced objects. For any object
directly or indirectly referenced by a local vari-
able we need to know the entry and exit values of
its fields w.r.t. the considered method call. An ar-
ray is considered as a special type of object with
all its fields of the same type. Note that the fields
of referenced objects can in turn reference further
objects, spanning a graph of referenced objects.
We call this graph the state space which is accessi-
ble by the respective method call. The accessible
state spaces spanned by the entry and exit values
are part of the method’s input and the method’s
result, respectively.
• Additionally, the entry and exit values of static
class fields should be available because they can
be part of the methods input and output as well.
• Finally, we need the return value.
The usability of the debugger will depend on a com-
pact and clear representation of the relevant (changed)
information.
2.3 Omniscient Debugging
Omniscient debugging is an extension of trace debug-
ging. During trace debugging the user directly ob-
serves the effects of executed statements on the pro-
gram state. To find a defect the first statement in the
execution history which changed the program state
from valid to infected must be identified.
A severe drawback of trace debugging is that we
have to trace statements executed before the defect,
while a defect effects the program states which occur
after its execution. Before the defect is executed the
program state is sane which is why we do not have
facts we can use to reason about the location of the
bug. Hence, the odds are that we miss the the defect
and have to start over again.
Omniscient debugging addresses these drawbacks
as it allows to track the execution of a program back
and forth in time. If we miss the execution of a de-
fect, we can now simply step back in the execution
history and do not have to restart our debugger. More
importantly, we can now reason backwards from the
program failure to the initial infection, following the
infected program states to the bug. This is a great im-
provement over ordinary trace debugging.
It is obvious that these benefits come with costs.
Omniscient debugging requires us to record the en-
tire execution history of the debuggee program. The
amount of data we have to record can be huge, espe-
cially for large and complex programs. But we have
JHYDE - THE JAVA HYBRID DEBUGGER
27

to record most of the execution information anyway
for declarative debugging. Therefore, in the case of
our hybrid debugger we get the benefits of omniscient
debugging almost for free.
2.4 Coverage based Navigation Strategy
How do the individual debugging efforts develop if
the size of the recorded execution history grows? On
average, we expect the omniscient debugging effort
to remain almost constant as we are looking for the
defect in a single method call, while we expect the
declarative debugging effort to grow as we are facing
a growing size of the CT. Especially when debugging
complex programs the number of executed method
calls can become huge. Thus, an efficient strategy for
the declarative debugging process can greatly reduce
the overall debugging effort.
One possible declarative debugging strategy is
based on the divide and query (D&Q) strategy devel-
oped by Shapiro (Shapiro, 1983). The idea of D&Q is
to halve the set of suspicious nodes A
i
with every user
answer. Let w
i
: N → N,w
i
(a) = |S
a
∩ A
i
| return the
weight of a node a in the suspicious set after i user an-
swers and let W
i
= |A
i
| be the weight of the suspicious
set.
D&Q will select the node a whose weight w
i
(a)
is closest to half of the weight of the suspicious set,
i.e. W
i
/2, for classification. After the user answer,
the weight of the remaining suspicious set W
i+1
will
be W
i
− w
i
(a) or w
i
(a) if the answer was “valid” or
“invalid”, respectively. Especially for big and un-
balanced CTs D&Q performs better than a top-down
strategy. In the worst case only O(logn),n = |N| user
answers are required.
D&Q assumes that every node of the CT has the
same probability to contain a bug. In real applica-
tions this is rarely the case as method calls can have
different complexities which result in different prob-
abilities to contain a bug. We can improve the perfor-
mance of D&Q if we take take varying error proba-
bilities into account. For this, we define a coverage
entity to be either a control-flow or data-flow element
whose coverage is monitored during program execu-
tion. To estimate the complexity of a method call we
assume that the complexity of a method call increases
with the number of entities that are covered.
Let E be the set of all entities covered during the
debuggee execution, E
a
⊆ E the covered entities of
node a, and V
i
⊂ N the subset of nodes classified as
valid after i user answers. Furthermore, the function
v
i
: E → N
0
returns the number of valid classifications
of a coverage entity after i user answers, i.e. v
i
(e) =
|{a ∈ V
i
: e ∈ E
a
}|. We compute the coverage-based
weight of a node after i answers by cbw
i
: N → R
+
as
follows:
cbw
i
(a) =
∑
b∈(S
a
∩A
i
)
∑
e∈E
b
g(v
i
(e)).
Where the function g : N
0
→ R
+
returns the weight of
a single entity e based on the number of valid classifi-
cations of e. Thus, the weight of a node a is the weight
of all covered entities of all nodes which are element
of the subtree rooted at a and the suspicious set A
i
.
In order to reduce the contribution of entities which
have been classified as valid, the function g should be
monotonically decreasing.
One possible definition of g is: g(x) = p
x
, with p ∈
[0,1]. In this case the contribution to the coverage-
based weight of an entity e which has not been clas-
sified as valid yet, i.e. v
i
(e) = 0, is p
0
= 1. The con-
tribution of e is exponentially reduced as the number
of valid classification of e increases. For example, if
p = 1/2 the contribution is halved for any additional
valid classification.
Let CBW
i
=
∑
b∈A
i
∑
e∈E
b
g(v
i
(e)) be the coverage-
based weight of the suspicious set A
i
. Similar to
D&Q, our coverage-based D&Q will select the node
a from A
i
whose coverage-based weight cbw
i
(a) is
nearest to half of the weight of the suspicious set,
CBW
i
/2, for the next classification. This way we try
to halve the coverage-based weight of the suspicious
set, CBW
i
, with every user answer. We have imple-
mented coverage-based D&Q using coverage of the
edges of the control flow graph (CFG) and def-use
chain coverage.
In a CFG each edge represents the flow of control
between two nodes, i.e. basic blocks. A basic block is
a sequence of code which has only one entry (no code
within the sequence is destination of a jump) and one
exit point (no jump statements within the sequence).
A def-use chain is a triple of a variable, a state-
ment where the variable’s value is computed, i.e. de-
fined, and a statement where the variable’s value is
used. Moreover, the variable’s value must not change
between the definition and the use.
Both metrics, edge coverage of the CFG and def-
use chain coverage, are common in the area of glass-
box testing (Pressman, 2001), where they are used to
measure the coverage of test cases. The goal is to
generate a minimal set of test cases which completely
covers a tested component w.r.t. to a certain coverage
criterion. It is assumed that the probability of a com-
ponent containing a defect is almost zero, if all test
cases pass and their coverage is complete. Similarly,
we employ coverage information during the debug-
ging process to determine which parts of the program
have the highest probability to contain a defect.
ICSOFT 2011 - 6th International Conference on Software and Data Technologies
28

Please note, that we have employed edge and def-
use chain coverage to reduce the number of questions
during the declarative debugging process before (Ca-
ballero et al., 2007). In our earlier works we avoid
questions about method calls whose covered entities
are completely covered by method calls which are
classified as valid. In other words, if E
a
⊆
S
b∈V
i
E
b
holds, a will be automatically assumed to be valid.
This approach significantly reduces the debugging ef-
fort, but it has a major drawback: if our debugger in-
fers a wrong classification, this strategy might iden-
tify a wrong buggy method call. Our new approach
does not have this shortcomingsbecause we do not in-
fer any answers but simply change the order of ques-
tions. Thus, our method always returns the correct
result.
3 USER INTERFACE
The task of the JHyde front-end is to present the ex-
ecution data of a program run in a structured and ac-
cessible way. The interface must be easy to use and
understand to find bugs quickly. The JHyde front-end
is an Eclipse (Eclipse Foundation, 2010) plugin. The
plugin enables the user to conduct the hybrid debug-
ging process for Java programs. When started JHyde
executes the selected program and records its entire
execution history. The search for the bug starts when
the debuggee’s execution is finished. The execution
data is presented to the user in four different views
shown in Figure 1. Each view is designed to present
a different aspect of the execution data.
The Computation Tree View shows the CT of the
debuggee program. Via the toolbar the user can clas-
sify the currently selected method call as valid, in-
valid, trusted or unclassified (unknown). According
to its classification a method call is highlighted by
green (valid), red (invalid), yellow (trusted), or white
(unclassified) background color. After classification
the debugger selects a new, yet unclassified method
call. JHyde supports four different navigation strate-
gies: top-down, D&Q, D&Q by edge coverage of the
CFG, and D&Q by def-use chain coverage.
In order to classify a method call we need in-
formation about the inputs and outputs of a method
call. This information is shown in the Node View of
JHyde. As described in Section 2.2 we need all lo-
cal variables, i.e. the arguments of the call, all locally
defined variables, and the “this” reference to the ob-
ject whose method is being called if the method is
not static. Furthermore, we need all static variables.
The Node View will always show these variables for
the method call selected in the CT View. The Node
View has a timestamp interval. The lower and the up-
per bound of the interval are set to the entry and exit
timestamp of the method call selected in the Compu-
tation Tree View, respectively. For each variable its
value at the lower bound (old value) and its value at
the upper bound (new value) are shown. If the vari-
able type is not a primitive but a reference type and at
least one of the variable’s values is not null then the
fields of the referenced object will be shown in the
variable’s subtree.
To validate the selected method call a user can
browse the old and new values of all relevant vari-
ables. If the method call’s actual effect matches its
intended effect the call is classified as valid. If actual
and desired effect do not match, it must be classified
as invalid. Validating the state change of the affected
variables is a complex and time-consuming task. In
the Node View every variable whose value changed
during the selected method call is marked by a certain
background color. A variable whose value changed is
marked red, e.g.
la
,
lb
,
c[0]
...
c[2]
, and
lc
. A vari-
able whose value did not change can reference an ob-
ject whose variables, i.e. fields, have changed. These
variables are marked yellow, e.g.
c
. The highlighting
of the state changes makes it much easier to evaluate
a method call. The user can directly navigate to the
changes and check their correctness.
The Event List View and the Variable History
View are used for omniscient debugging. The Event
List View shows a chronological list of all events that
occurred during the method call selected in the CT
View. It is used to track the changes step-by-step,
back and forth in time. If a user selects a specific
event from the list, the source code line which pro-
duced this event is shown in the source code editor.
Furthermore, the upper bound of the timestamp inter-
val of the Node View is set to the timestamp of the
selected event. This has the following effect: In the
Node View the new value of each variable now shows
the value the respective variable had right after the ex-
ecution of the selected event. Hence, the Node View
now shows all state changes which happened between
the execution of the first event, i.e. the beginning of
the method call, and the event selected in the Event
List View. This gives the user a summary of all state
changes performed by the events of the method call
which precede the selected event. Thus, the user can
conveniently check if the program state is still valid at
the selected event.
If we want to lookup the event which changed a
variable’s value in the Event List View, we can select
the desired variable in the Node View. Every event
which changed the value of the selected variable will
now be highlighted in the Event List View. For exam-
JHYDE - THE JAVA HYBRID DEBUGGER
29
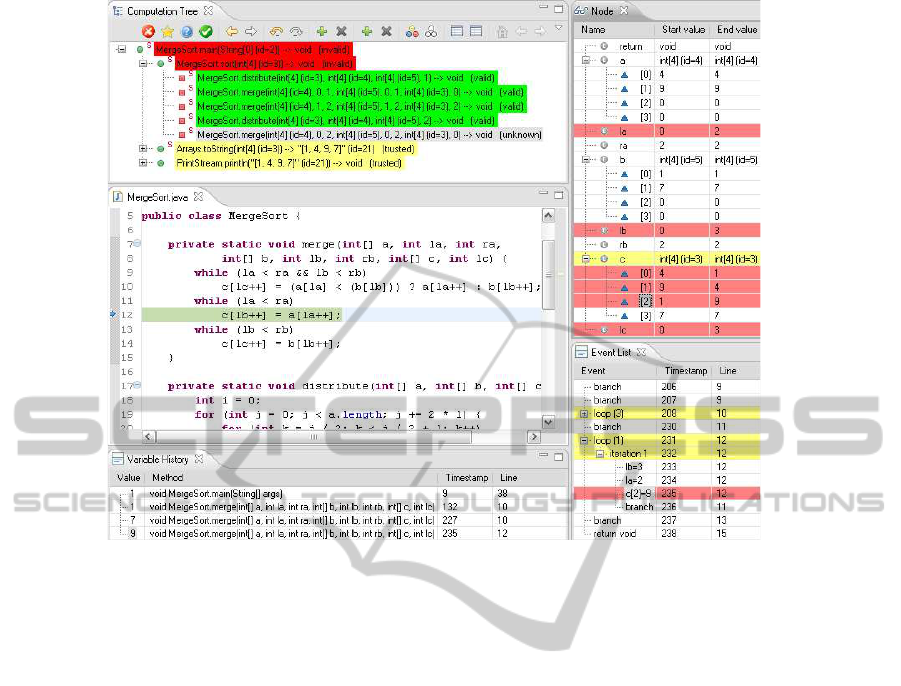
Figure 1: Screenshot of the JHyde plugin which consists of the Computation Tree View, the Node View, Event List View,
and the Variable History View, which help to navigate the execution data of a debuggee program. The views represent the
execution of the
MergeSort
program shown in Listing 1.
ple, the array field
c[2]
is selected in the Node View
in Figure 1. Thus, the events which changed
c[2]
are highlighted in the Event List View. If a changing
event is located in the subtree of an event it is marked
with yellow (light gray) background color, e.g. times-
tamps 208, 231, and 232. If the event itself changed
the value, it is marked red (dark gray), e.g. timestamp
235. The interaction between the Event List View and
the Node View offers some nice and handy features
which facilitate the search for a defect in the method
call’s execution history.
The second view which can be employed to search
for the program bug is the Variable History View. It
displays a chronological list of all events of the com-
plete execution history that changed a specific vari-
able. To assign a variable to the Event List View we
can right click on any variable in the Node View and
select “display in History View”. For example, the
History View in Figure 1 shows the value history of
c[2]
. With the help of the Variable History View we
can check the value history of a Variable for invalid
values. If we have identified an undesired value, we
can select the corresponding event, e.g. the event with
timestamp 235 which changed the value of
c[2]
to 9.
Clicking an event in the History View will cause an
update of the other views of JHyde. In the CT View
the method call which executed the selected event is
selected, the Event List View shows the events of the
method call selected in the CT View. Furthermore,
the examined event, i.e. the event with timestamp
235, is selected in the Event List View. The Node
View will show the value changes of all variables of
the corresponding method call from the beginning of
the call to the timestamp of the selected event. Figure
1 shows the state of all JHyde views after the event
with timestamp 235 has been selected in the History
View. Hence, the Variable History View is a useful
utility to navigate the execution data. By selecting
an event in the History View we can directly jump to
its location in the execution history. Thus, the His-
tory View allows us to reason backwards in the exe-
cution history. If we notice a program failure after the
execution of the debuggee program, we can use the
variable whose value caused the failure to trace back
to the point in the execution history where a wrong
value was assigned to the variable. If the wrong value
was assigned due to a defect in the program, we have
found the bug. Otherwise the wrong value must result
from another variable which has a wrong value at the
given time in the execution history. We can continue
the backward reasoning process with this new vari-
able. By this process we will eventually find the bug
causing the program failure.
ICSOFT 2011 - 6th International Conference on Software and Data Technologies
30

4 DEBUGGING SESSION
EXAMPLE
To demonstrate how JHyde is used, we will show how
to debug the Java implementation of the well-known
merge sort algorithm (Cormen et al., 2001) presented
in Listing 1. We assume that our debugger uses a top-
down declarative debugging strategy.
5 public class
MergeSort {
6
7 private static void
merge(
int
[] a,
int
la,
8 int
ra,
int
[] b,
int
lb,
int
rb,
int
[]
c,
int
lc) {
9 while
(la < ra && lb < rb)
10
c[lc++] = (a[la] < b[lb]) ? a[la++] :
b[lb++];
11 while
(la < ra)
12
c[lb++] = a[la++];
// must be: c[lc++]
=a[la++];
13 while
(lb < rb)
14
c[lc++] = b[lb++];
15
}
16
17 private static void
distribute(
int
[] a,
int
[] b,
int
[] c,
int
l) {
18 int
i = 0;
19 for
(
int
j = 0; j < a.length; j += 2 * l) {
20 for
(
int
k = j / 2; k < j / 2 + l; k++)
21
b[k] = a[i++];
22 for
(
int
k = j / 2; k < j / 2 + l; k++)
23
c[k] = a[i++];
24
}
25
}
26
27 public static void
sort(
int
[] a) {
28 int
[] b =
new int
[a.length];
29 int
[] c =
new int
[a.length];
30 for
(
int
size=1; size < a.length; size *=
2) {
31
distribute(a, b, c, size);
32 for
(
int
i = 0; i < a.length / 2; i +=
size)
33
merge(b, i, i + size, c, i, i + size ,
a, 2 * i);
34
}
35
}
36
37 public static void
main(String [] args) {
38 int
[] a =
new int
[] {4,9,1,7};
39
MergeSort.sort(a);
40
System.out.println(Arrays.
41
toString(a));
42
}
Listing 1: Java implementation of the merge sort algorithm
containing a defect in line 12. The line numbering starts at
line 5 to match the numbering in the source code editor of
Figure 1.
The semantics of the methods is straight forward.
The method
merge
merges the values of array
a
from
index
la
to index
ra
and
b
from index
lb
to
rb
into array
c
, starting at position
lc
. If
a
and
b
are sorted within the
defined intervals, the result will be a sorted sequence
of all elements of the intervals of
a
and
b
starting at
lc
in
c
.
The method
distribute
distributes the elements of
a
to
b
and
c
. Therefore,
a
is divided in subsequent
chunks of size
l
. The chunks are copied to
b
and
c
, in
turns.
The method
sort
uses
distribute
and
merge
to sort
array
a
. Therefore, the contents of
a
are distributed
to
b
and
c
and merged back into
a
. To get a
completely sorted array log
2
a.length
, distribute and
a.length
-1 merge operations must be performed. The
sequence of chunk lengths after each distribute steps
is (2
0
,... ,2
log
2
n−1
). Please note that this simple im-
plementation of merge sort does only sort arrays of
length 2
i
,i ∈ N. Finally, the method
main
calls the
sort
method to sort the array [4,9,1,7] and prints the result
to the console output.
The implementation contains a defect in line 12,
which should read “
c[lc++] = a[la++];
”. When execut-
ing the
main
method of the
MergeSort
class, the output is
the incorrectly sorted array “
[1,4,9,7]
”. We will now
show how JHyde can be used to detect the bug.
To debug the
MergeSort
program we first have to ex-
ecute it using JHyde. After the execution is finished
we can use the views of JHyde to explore the recorded
execution data and find the bug. Figure 1 shows the
state of the JHyde views at the end of the debugging
session, when the defect has been detected.
The CT View shows the CT of the
MergeSort
exe-
cution. The call of the
main
and the
sort
method have
been classified as invalid. The
main
method prints a
wrong result array and the sort does not sort the ele-
ments of the argument array correctly. The two sib-
ling calls of the
sort
call,
toString
and
println
are auto-
matically marked as trusted because they are part of
the Java API. The first 4 sub calls of
sort
are classified
as valid as they return the expected result. The last
call of the
merge
method is still unclassified. As this
method is selected in the Computation Tree View, the
Node View shows all local variables of this call. For
each variable the start value and the end value are the
variable’s value at the beginning and the end of the se-
lected method call, respectively. The variables whose
values changed during the method call, e.g.
la
,
lb
,
c[0]
...
c[2]
, and
lc
, are marked red (dark grey). The
local variable
c
is marked yellow (light grey) because
the value of
c
did not change, but some fields of
c
changed.
Due to the intended semantics of the
merge
method,
we would expect the chunks [4,9] and [1,7] stored in
JHYDE - THE JAVA HYBRID DEBUGGER
31

a
and
b
, respectively, to get merged to [1,4,7,9] in
c
. The Node View tells us that the actual result of
the
merge
call stored in
c
is [1,4, 9,7]. If we mark this
method as invalid in the Computation Tree View the
debugger informs us that the method
merge
must con-
tain a bug because its inputs were all valid, while it
produced a wrong result.
To find the exact location of the bug in the merge
source code we switch to omniscient debugging. The
field at index 2 of the array
c
is a promising entry
point. The expected value of this field is 7, while its
actual value is 9. We right click this variable in the
Node View and select “Show in History View”. The
result is the value history shown in the History View
of Figure 1. During the execution the value of the ar-
ray field
c[2]
has changed 4 times. The History View
shows the value, the full method signature, the times-
tamp, and the source code line of each value change.
If we select the last entry in the list, where the value
is changed to 9, the source code line which caused the
value change is highlighted in the source code editor.
Furthermore, the event with the timestamp 235 is se-
lected in the Event List View. At this point all views
of JHyde look exactly as shown in Figure 1. A fur-
ther look at the History View tells us that the correct
value was already assigned to the
c[2]
in line 10 by
the same method call at timestamp 227. The value
9 should have been assigned to
c[3]
. Hence, line 12
must contain the defect.
Note that we could have used the Variable History
View even at an earlier point in the debugging pro-
cess to directly jump to the bug. For example, if we
evaluate the result of the call
sort
, we notice the erro-
neous result a = [1, 4,9,7]. Via the value history for
c[2]
we can directly jump from the method call
sort
to the buggy method call
merge
, skipping the previous
children of
sort
. Thus, the value history is an excel-
lent tool if we detect a variable with a wrong value. In
this case we can easily track back to the origin of the
infected program state.
Nevertheless, there are cases where the program
state is infected but we do not have a wrong value
which we can use to track back to the program bug.
This is the case if the program state is not infected
due to wrong values, but due to missing values. For
example, consider a merge sort implementation with
a defect
merge
method which misses lines 11-12. For
the input [4,9,1,7] this implementation would return
a
=[1,4,7,7]. Although, the value of
a[3]
, which must
be 9, is not correct, we cannot use the value history
of
a[3]
to track back to the origin of incorrect value.
During the computation
a[3]
is assigned two values.
The first value (7) is assigned during the initialization
of
a
in the
main
method and the second value, which is
also 7, is assigned during the second invocation of the
merge
method. As both value assignments are correct,
the incorrect value of
a[3]
is a missing assignment and
not a wrong assignment. We cannot track missing as-
signments with the Value History. In this cases we
need the declarative debugger to identify the buggy
method.
If we use a D&Q strategy based on edge cover-
age instead of the top-down strategy for declarative
debugging, the debugger would compute the weight
of each node in the CT w.r.t. edge coverage. At the
beginning of the declarative debugging process the
weight of the nodes shown in the CT View is: 46, 45,
7, 8, 8 ,7, 10, 0, and 0 (preorder traversal). Hence, the
debugger would at first ask the user to classify the last
call of
merge
, whose weight 10 is closest to
46
2
. In this
case the buggy method call is found after the classifi-
cation of only one method call, while 6 method calls
can be skipped.
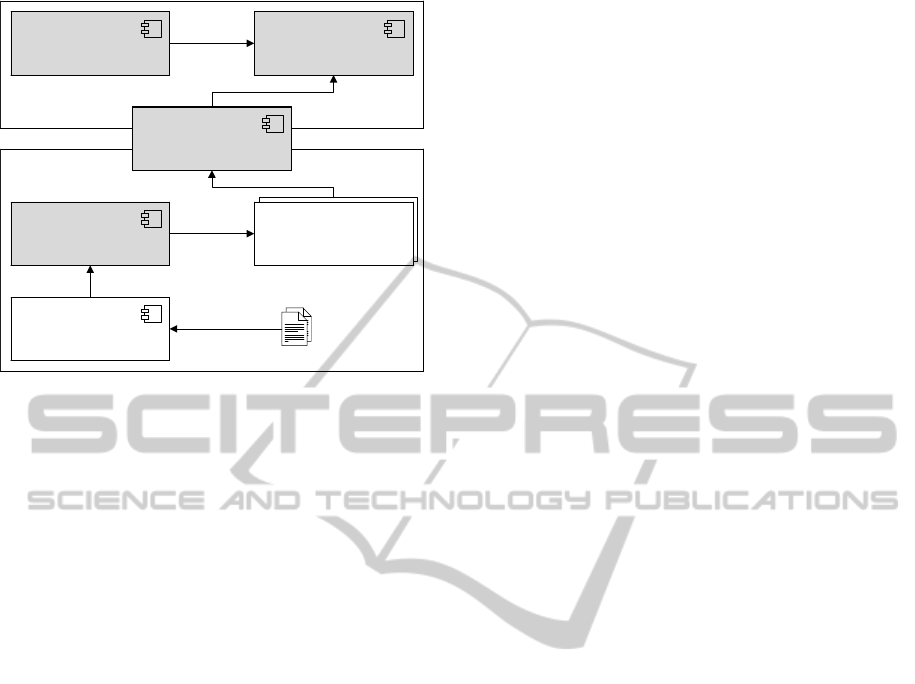
5 IMPLEMENTATION
Figure 2 shows the architecture of our declarative de-
bugger. It consists of four basic components: the In-
strumentation Engine, the Transmission Engine, the
Recording Engine, and the Debugging Engine. The
components are distributed over the Debugger JVM
which conducts the debugging process and the De-
buggee JVM which executes the debuggee program.
The distribution over two separate JVMs decouples
the execution process from the debugging process.
During the class loading process of the Debuggee
JVM the bytecode of the loaded class is manipulated
by the Instrumentation Engine. After the instrumenta-
tion process, the bytecode of the loaded class contains
additional instructions which invoke debugging event
methods of the Transmission Engine. The instrumen-
tation is done with the ASM (Object Web, 2009), a
fast bytecode manipulation framework based on the
visitor pattern (Gamma et al., 1995). The instrumen-
tation process of ASM is controlled by user-defined
visitors which inject additional bytecode into the vis-
ited class. As the instrumentation process is con-
ducted during the dynamic class loading process at
bytecode level, it is transparent from a programmers
point of view. In a debugging session a programmer
will always work with the original source code.
The Transmission Engine forwards the received
events to the Recording Engine in the Debugger JVM.
To transmit the events, they are converted to a byte
stream in the Debuggee JVM and sent to the Debug-
ger JVM via a socket connection. In the Debugger
JVM the Transmission Engine reconstructs the de-
ICSOFT 2011 - 6th International Conference on Software and Data Technologies
32
Debuggee
(instrumented
bytecode)
Instrumentation
Engine
Classloader
Recording
Engine
Debugging
Engine
class files
Transmission
Engine
Debuggee VM
Debugger VM
Figure 2: Architecture of the declarative debugger.
bugging events form the received byte stream and for-
wards them to the Recording Engine.
The Recording Engine stores the received events
in an event file on the hard disk in chronological order.
During the debugging process the execution data is
lazily loaded from the event file and transferred to the
Debugging Engine.
To reconstruct the program state of the debuggee
program at an arbitrary time in the execution history
the Recording Engine could theoretically reproduce
the effect of all events from the beginning of the ex-
ecution history to the desired point in the execution
history. Especially for larger execution histories this
would be much to slow to allow the user to navigate
the execution history and the program state in real
time. The debugging process would be unacceptably
slow.
To speedup the reconstruction of the program
states the Recording Engine constructs 3 additional
data structures which are kept in the memory of the
Debugger VM. The first data structure stores the static
structure of the debuggee program, i.e. its classes,
methods, fields, and local variables. The second
structure is the CT of the debuggee program, i.e. a
tree representing the method call history. The third
structure stores data-flow information. It stores an ar-
ray of timestamps for every variable of the debuggee
execution. Each timestamp refers to the time in the
execution history when the value of the associated
variable changed. For each timestamp the Record-
ing Engine can directly compute the position of the
associated event in the event file.
Writing the whole execution data to the event file
and keeping only three data structures in memory to
speedup the navigation, is a trade off between mem-
ory usage and requiredeffort to navigate the execution
data.
The user interface of JHyde, i.e. the set of views as
described in section 3, is implemented by the Debug-
ging Engine. Hence, the Debugging Engine’s task is
to present the execution data to the user in a accessible
way and conduct the interactive debugging process.
6 TEST RESULTS
To test the benefit of the coverage-based D&Q strat-
egy, we have conducted the declarative debugging
process with a set of selected test programs. For each
of the programs which originally contained no errors
we created several test samples. Each sample was
generated from the original program by changing one
distinct line of the source code such that the resulting
test sample would contain a common programming
error. This way we have created a set of 32 test sam-
ples out of 5 different programs. Using the declarative
debugger component of JHyde we have determined
the number of questions a user would have to answer,
i.e. how many method calls he has to evaluate, be-
fore the erroneous method is found. The debugging
process has been conducted four times for each error
sample using top-down (TD), ordinary D&Q, D&Q
by def-use chain coverage (DUC), and D&Q by edge
coverage (Edge) strategies. DUC and Edge have been
conducted with p = 0.6 and p = 0.5, respectively.
These values minimize the number of questions w.r.t.
the set of test cases. The number of questions we have
to answer for each of strategy allows us to evaluate the
efficiency of the different strategies.
Table 1 shows the test results. Column one indi-
cates the name of the program which was subject to
debugging. For each program we have manually con-
structed several test cases as described before. The
number of test cases we created is shown in column
two. The values in column 3 indicate the average size
of the generated CT. Column 4 shows the average
number of trusted method calls in the CT. Columns
5-8 contain the average number of answers neces-
sary to find the buggy method. Each column corre-
sponds to one of the above mentioned strategies. On
average D&Q by edge coverage performs best, ask-
ing 7.66 questions, while the other strategies yield
8.25 (D&Q by def-use chain coverage), 10 (D&Q),
and 12.84 (top-down). The ratio of classified method
calls in columns 9-12 is calculated by dividing the av-
erage number of answers by the average number of
untrusted method calls in the computation. On av-
erage we have to validate 23% of the CT using top-
down, 18% using D&Q, 15% using D&Q by def-use
chain coverage, and 14% using D&Q by edge cov-
JHYDE - THE JAVA HYBRID DEBUGGER
33

Table 1: Results of test cases processed with the declarative debugger of JHyde.
# of Avg. # of Avg. number of Classified Savings [%]
Test method calls answers method calls[%]
Program Cases Total Trusted TD D&Q DUC Edge TD D&Q DUC Edge D&Q DUC Edge
Avl 10 132.80 65.30 13.90 9.10 7.70 6.60 0.21 0.13 0.11 0.10 0.35 0.45 0.53
Binary Tree 5 128.00 84.00 11.80 10.20 7.40 7.80 0.27 0.23 0.17 0.18 0.14 0.37 0.34
B Tree 7 195.86 118.86 15.57 13.43 8.57 9.43 0.20 0.17 0.11 0.12 0.14 0.45 0.39
Heap sort 5 68.00 25.80 9.60 7.20 9.00 9.00 0.23 0.17 0.21 0.21 0.25 0.06 0.06
Hash table 5 73.40 22.40 11.20 9.60 9.00 5.80 0.22 0.19 0.18 0.11 0.14 0.20 0.48
Total Avg. 32 119.61 63.27 12.84 10.00 8.25 7.66 0.23 0.18 0.15 0.14 0.22 0.36 0.40
erage. Columns 13-15 show the relative savings, i.e.
the percentage of questions that is saved w.r.t. a top-
down strategy. On average we save 22% with D&Q
and 36% with D&Q by de-use chain coverage. D&Q
by edge coverage performs best saving 40% percent
of questions on average. The number of saved ques-
tions is nearly doubled w.r.t. ordinary D&Q.
7 RELATED WORK
The idea to apply declarative debugging outside the
declarative programming paradigm is not new. In
1998 Shahmehri and Fritzson presented an approach
for declarative debugging of the imperative language
Pascal (Shahmehri and Fritzson, 1991) which was
further developed by the same authors in (Fritzson
et al., 1992). The main difference of our approach
w.r.t. these earlier proposals is that Java is a lan-
guage much more complex than Pascal. The declara-
tive debugging of programs including objects and ob-
ject states introduces new difficulties.
There are several approaches which use an execu-
tion history to locate bugs in Java programs. In a first
step these methods trace and record the complete ex-
ecution of the debuggee program. In a second step
the recorded information is used to identify errors in
the debuggee program. For example, JavaDD (Gir-
gis and Jayaraman, 2006) follows a query-based ap-
proach, storing events occurring during the debuggee
execution in a deductive database. The database can
be queried to retrieve the states of different program
entities (variables, threads, etc.) at different moments
of the computation history to infer where the bug is
located. Another approach is omniscient debugging
(Lewis, 2003) which can trace the executionof the de-
buggee program back and forth in time. Our debugger
does also record the entire execution of a debuggee
program before the debugging process is started and
it supports omniscient debugging as well. But in con-
trast to these approaches, our debugger does also sup-
port declarative debugging, which concentrates on the
logic of method calls, storing them in a structured
way, i.e. the CT. The declarative debugging compo-
nent allows our debugger to guide the debugging pro-
cess, deducing the wrong method from user answers.
Hoon-Joon Kouh et al. (Kouh et al., 2004) pro-
pose a debugging technique for Java which combines
algorithmic and step-wise debugging. In contrast to
our work they neither present a tool implementation
nor do they present a solution to display side effects
in an accessible form. Furthermore, they use slicing
techniques to reduce the size of the CT, while our tool
uses enhanced D&Q strategies.
JHyde is based on a declarative debugger we
have developed for the Java programming language
(Caballero et al., 2007). In this paper we extend
our declarative debugger to a hybrid debugging tool
which supports declarative and omniscient debug-
ging. Furthermore, we have developed and tested
new declarative debugging strategies which enhance
the D&Q strategy by def-use chain and edge cover-
age information. These strategies improve our previ-
ous answer-inference based approach. First our new
optimization is guaranteed to be correct and cannot
infer any wrong answers, second the reduction of the
debugging effort is slightly more efficient.
As described by Silva (Silva, 2007) a lot of differ-
ent strategies have been developed to reduce the num-
ber of questions asked during declarative debugging.
Like our approach some of the more advanced strate-
gies estimate the error probability of CT nodes based
on previous user answers. However, none of these
approaches is based on coverage information. To the
best of our knowledge, there exists no strategy which
is based on data-flow and/or control-flow coverage to
calculate the error probability of nodes of the CT.
8 CONCLUSIONS AND FUTURE
WORK
We have presented a tool which enables the hybrid de-
bugging of Java programs combining declarative and
omniscient debugging methods. The major advantage
of declarative debugging compared to conventional
debugging is that it works on a higher level of abstrac-
tion. The tester is relieved from the task to inspect the
state space after each instruction starting from some
ICSOFT 2011 - 6th International Conference on Software and Data Technologies
34

break point. By answering questions about the sound-
ness of some method calls the user can concentrate
on the semantics. A major drawback of declarative
debugging is the fact, that we can only determine a
buggy method call but not the buggy statements in-
side a method. This downside is cured by the fact
that JHyde does also support omniscient debugging.
With omniscient debugging the user can track the ex-
ecution of a debuggee program statement-wise back
and forth in time. The combination of both debug-
ging techniques JHyde can profit from the advantages
both methods, the abstraction of the declarative de-
bugging method and the precision of the omniscient
debugging method.
The JHyde user interface consists of four views
which allow the user to inspect and navigate the exe-
cution history of a debuggee program effectively. At
any point in the debugging process the user is free
to choose the most suitable views and/or debugging
method.
A particular novelty of our approach is the us-
age of code-coverage criteria such as def-use chain
coverage and coverage of the edges of the control-
flow graph to calculate the error probability of method
calls. The error probability increases with the num-
ber of covered entities, i.e. def-use chains or edges
of the CFG. Furthermore, our strategy takes previous
user answers into account. The more often an entity
is classified as valid the lesser its contribution to the
error probability of a method call.
We have conducted a number of tests, using dif-
ferent declarative debugging strategies to debug a set
of buggy Java programs. The results show that up
to 40% of the questions asked can be saved with our
coverage-based D&Q strategy w.r.t. the ordinary top-
down strategy. Furthermore, our strategy is an effi-
cient improvement to the ordinary D&Q strategy. In
our test scenario the number of questions saved could
be nearly doubled if D&Q is enhanced by coverage-
based error probability. The improved reduction of
the debugging effort makes our debugger more suit-
able for real-world applications where the debugging
effort has great influences on the costs of the software
development process.
In the future we plan to investigate how our hybrid
debugging method can be extended to multi-threaded
program executions. Although, our debugger is al-
ready capable of recording multi-threaded programs,
there are still some problems to be tackled regarding a
multi-threaded hybrid debugging method. For exam-
ple, it is much harder to check the validity of method
calls if their execution is interleaved.
REFERENCES
Caballero, R., Hermanns, C., and Kuchen, H. (2007). Al-
gorithmic Debugging of Java Programs. Electronic
Notes in Theoretical Computer Science, 177:75–89.
Caballero, R. and Rodr´ıguez-Artalejo, M. (2002). A Declar-
ative Debugging System for Lazy Functional Logic
Programs. Electronic Notes in Theoretical Computer
Science, 64.
Cormen, T. H., Leiserson, C. E., Rivest, R. L., and Stein, C.
(2001). Introduction to Algorithms. The MIT Press,
2nd edition.
Eclipse Foundation (2010). Eclipse IDE. http://
www.eclipse.org/.
Fritzson, P., Shahmehri, N., Kamkar, M., and Gyimothy, T.
(1992). Generalized algorithmic debugging and test-
ing. ACM Letters on Programming Languages and
Systems, 1(4):303–322.
Gamma, E., Helm, R., Johnson, R., and Vlissides, J. (1995).
Design Patterns. Addison-Wesley, Boston, MA.
Girgis, H. Z. and Jayaraman, B. (2006). JavaDD: a Declara-
tive Debugger for Java. Technical report, Department
of Computer Science and Engineering, University at
Buffalo.
Hailpern, B. and Santhanam, P. (2002). Software debug-
ging, testing, and verification. IBM Systems Journal,
41(1):4–12.
Hermanns, C. (2010). JHyde - Eclipse plugin. http://
www.wi.uni-muenster.de/pi/personal/hermanns.php.
Kouh, H.-J., Kim, K.-T., Jo, S.-M., and Yoo, W.-H. (2004).
Computational Science and Its Applications - ICCSA
2004, volume 3046 of Lecture Notes in Computer
Science, chapter Debugging of Java Programs Using
HDT with Program Slicing, pages 524–533. Springer.
Lewis, B. (2003). Debugging Backwards in Time. CoRR,
cs.SE/0310016.
Nilsson, H. (2001). How to look busy while being as lazy as
ever: the Implementation of a lazy functional debug-
ger. Journal of Functional Programming, 11(6):629–
671.
Object Web (2009). Asm. http://asm.ow2.org/.
Pressman, R. S. (2001). Software Engineering: A Practi-
tioner’s Approach. McGrap-Hill, fifth edition.
Shahmehri, N. and Fritzson, P. (1991). Compiler Compil-
ers, volume 477 of Lecture Notes in Computer Sci-
ence, chapter Algorithmic debugging for imperative
languages with side-effects, pages 226–227. Springer.
Shapiro, E. Y. (1983). Algorithmic Program DeBugging.
MIT Press.
Silva, J. (2007). Logic-Based Program Synthesis and Trans-
formation, volume 4407 of Lecture Notes in Computer
Science, chapter A Comparative Study of Algorithmic
Debugging Strategies, pages 143–159. Springer.
Zeller, A. (2005). Why Programs Fail: A Guide to System-
atic Debugging, chapter How Failures Come to Be,
pages 1–26. Morgan Kaufmann.
JHYDE - THE JAVA HYBRID DEBUGGER
35
