
A STUDY FOR MANUFACTURING CELL FORMATION
APPROACH CONSIDERING SETUP
Arthur Tórgo Gómez, Cristiano Galafassi
Universidade do Vale do Rio dos Sinos, Av. Unisinos - 950, São Leopoldo, Brazil
Iris Corrêa das Chagas Linck
Universidade do Vale do Rio dos Sinos, Av. Unisinos - 950, São Leopoldo, Brazil
Toni Ismael Wickert
Universidade do Vale do Rio dos Sinos, Av. Unisinos - 950, São Leopoldo, Brazil
Keywords: Manufacturing cell formation, Setup, Meta-heuristic, Tabu search, Genetic algorithm.
Abstract: This paper proposes a comparison among the exact methods Rank Ordered Cluster, Single Linkage
Clustering and the metaheuristics Tabu Search and Genetic Algorithm for Manufacturing Cell Formation
Problem. The Manufacturing Cell Formation consists of group machines for processing similar parts or
components in order to minimize setup time. Setup time can be defined as the period of downtime between
the processing of two consecutive batches. To validate the algorithms results, a metric, group efficacy, is
applied to determine the result quality, moreover, the results are compared with examples in the literature.
1 INTRODUCTION
Nowadays, customers increasingly want
personalized products, which forces suppliers to
produce a wide variety of products in smaller
amounts. In this context, the Group Technology
(GT) provides an important contribution in
managing the conflict between productivity and
flexibility in a production line (James et. al., 2007;
Papaioannou et al., 2008). The GT is a philosophy of
manufacturing in which parts are identified and
grouped according to some similarity in design or
manufacturing, called Parts Families (PFs) (James et
al, 2007).
The Manufacturing Cell Formation Problem
(MCFP) consists in determining how the machines
should be grouped (James et. al., 2007). The set of
parts with similar processing needs to be completely
manufactured in the same cell.
This paper approaches the manufacturing cell
formation problem using four algorithms: ROC,
SLC, the meta-heuristics Genetic Algorithm and
Tabu Search. To make the comparison between the
quality of the Manufacturing Cells (MC) generated
by each algorithm is used the grouping effectiveness
metric, proposed by Kumar and Chandrasekharan
(1990) and also applied by James et al. (2007).
This paper is divided as follows. Section 2
presents the basic concepts about the manufacturing
cells formation problem and the metrics that will be
used to evaluate the efficiency of the groups that will
be generated. Section 3 presents the techniques that
will be used to generate clusters. Section 4 describes
the model proposed in this paper. Section 5 presents
the results obtained from the experiments and
Section 6 presents the conclusions.
2 MANUFACTURING CELL
FORMATION PROBLEM
The Manufacturing Cell can be characterized as a
grouping of two or more machines which can
manufacture a parts family with little or no
intercellular movement (James et. al., 2007),
providing benefits such as reduced costs with
43
Tórgo Gómez A., Galafassi C., Corrêa das Chagas Linck I. and Ismael Wickert T..
A STUDY FOR MANUFACTURING CELL FORMATION APPROACH CONSIDERING SETUP.
DOI: 10.5220/0003439200430048
In Proceedings of the 8th International Conference on Informatics in Control, Automation and Robotics (ICINCO-2011), pages 43-48
ISBN: 978-989-8425-74-4
Copyright
c
2011 SCITEPRESS (Science and Technology Publications, Lda.)
movement of materials and setup stops. The MCFP
is considered NP - hard (James et al., 2007;
Spiliopoulos and Sofianopoulou, 2008).
To solve this problem different methods have
been proposed like, exact methods (King, 1980;
King and Nakornchai, 1982; Kusiak and Chow,
1987), heuristics (Chan et al., 2002), metaheuristics
(Dimopoulos and Mort, 2001; Bajestani et al., 2009),
neural networks (Saidi-Mehrabad and Safaei, 2007)
and fuzzy theories (Safaei et al., 2008; Papaioannou
et al. 2008).
The MCFP can be formulated as a problem of
diagonalizing blocks which aims to group the largest
number of shares in the same cell, considering the
limited size of the magazine, where the matrix A =
[a
ij
] is defined by: a
ij
= 1 if the j
th
component visits
the i
th
machine and a
ij
= 0 otherwise (King, 1980).
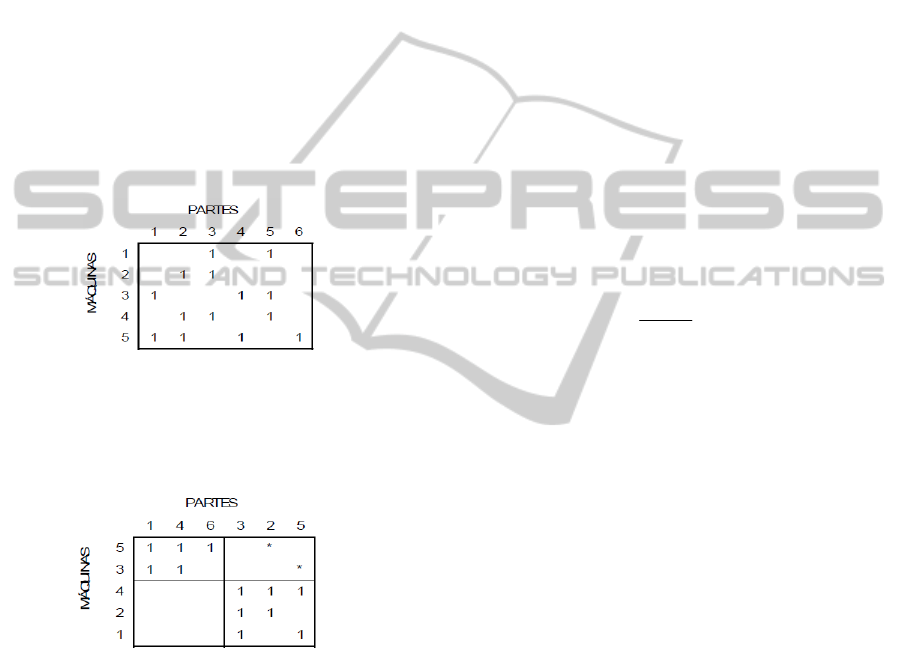
Figure 1 illustrates an incidence matrix.
Figure 1: Incidence Matrix.
Figure 2 shows the result obtained after applying
the Cluster Identification Algorithm (Kusiak and
Chow, 1987).
Figure 2: Incidence Matrix after processing by CIA.
In Figure 2, we can see that two MC were
generated; MC1 with machines 5 and 3 and cell 2
with machines 4, 2 and 1. The asterisk (*) indicates
the parts 2 and 5 which need the MC 1 and 2 to be
processed. This resource sharing can be interpreted
as exceptional elements (King, 1980). In the
formulation of Parts Families, the bottlenecks can be
represented by machines that are claimed by two or
more Parts Families or by parts that must be
processed in two or more manufacturing cells.
To quantify the efficiency of the generated
clusters, several metrics have been proposed (Sarker,
2001). In the literature, there are two measures
frequently used to evaluate the quality of solutions.
The first one is called grouping efficiency that was
proposed by Chandrasekharan and Rajagopolan
(1989) and given by equation (1).
n = qn
1
+ (1
–
q) n
2
(1)
As such, q is the weighting factor, n
1
is the
relationship between the number of 1s in the
diagonal blocks and the total number of 0s and 1s on
the diagonal blocks, n
2
is the ratio between the
number of 0s outside the diagonal blocks and the
total number of 0s and 1s outside the diagonal
blocks (Chandrasekharan and Rajagopolan, 1989).
Grouping efficiency ranges from 0 to 1 and the
higher it is, the better the solution. As the q factor is
increased, an important relationship between the use
of machines and intercellular movement can be
obtained, but this metric has a low discriminatory
power as the array size increases (Sarker, 2001;
James et. al., 2007).
Kumar and Chandrasekharan (1990) proposed a
metric called effective clustering that overcomes the
matrix size problem (Sarker, 2001). This metric is
given by the equation (2).
=
τ
vee
ee
+
−
0
(2)
In this equation, e is the total number of 1s in the
incidence matrix, e
v
is the number of 0s in the blocks
diagonal and e
0
is the number of exceptional items.
3 METHODS TO SOLVE THE
MANUFACTURING CELL
FORMATION PROBLEM
Below it is presented the methods that will be
implemented to generate the Parts Families.
3.1 Rank Order Clustering
The Rank Order Clustering (ROC) was proposed by
King (King, 1980), this algorithm aims to calculate
the weight of each row and each column in the
incidence matrix and to reorder the incidence matrix
as these values.
Considering n = number of parts, m = number of
machines and a variable k, the weights for each row i
and column j are calculated by the equations 3 and 4
respectively.
Row i =
∑
=
−
n
K
kn
ik
a
1
2.
(3)
Column j =
km
m
k
jk
a
−
=
∑
2.
1
(4)
ICINCO 2011 - 8th International Conference on Informatics in Control, Automation and Robotics
44

The equation (3) defines the calculation used to
find the total weight of each line. The equation (4)
means calculation used to find the total weight of
each column. After applying ROC to the incidence
matrices, the Cluster Identification Algorithm
(Kusiak and Chow, 1987) was applied in order to
identify the clusters so that the metrics calculation
could be possible.
3.2 Single Linkage Clustering
The Single Linkage Clustering (SLC) is a
hierarchical method for the formation of MC. The
similarity coefficient between the parts is calculated
using the Jaccard Similarity Coefficient (JSC) giving
by
JSC
jk
= (5)
Where JSC
jk
is the Jaccard Similarity Coefficient
between j and k. N
jk
is the number of machines that
the component j and k have in common in their
manufacturing and N
jj
is the number of machines
that the component j must be manufactured. In this
case, the number of Parts Families is directly linked
to the similarity coefficient, limiting the space
search process.
3.3 Genetic Algorithm
The expression Genetic Algorithm (GA) was
presented by Holland (1975) and consists of a
heuristic method that simulates the evolutionary
process of natural selection and survival of the fittest
(James et al., 2007). Genetic algorithm has been
applied in a number of fields; e.g.: mathematics,
engineering, biology, and social science (Reeves,
2003).
The majority of the studies applying GA to the
MCFP use an integer code to represent solutions.
The objective function (OF), also known as
evaluation function or fitness, has the goal of
evaluating the actual solution quality. In the GA
case, each chromosome or individual represents a
solution, therefore, the OF calculation is done for
each chromosome. The objective function used in
this paper consists of the evaluation of the clustering
efficiency given by the equation below.
Minimize Z = (6)
Where:
P
j
= sum of the number of exceptional parts;
K= number of individual’s cells and it is defined
by GA as a random integer variable chosen in the
interval [2, m/2], being m the total number of matrix
tools.
The metric given by equation (6) will be applied
to the set of solutions generated by the GA.
3.4 Tabu Search
The heuristic method Tabu Search (TS) was
originally proposed by Glover in 1986 (Glover,
1986) for various combinatorial optimization
problems. The main ideas of TS are to avoid
recently visited area of the solution space and to
guide the search towards new and promising areas
(Glover, 1986). Non-improving moves are allowed
to escape from the local optima, and attributes of
recently performed moves are stored in a tabu list
and may be forbidden for a number of iterations to
avoid cycling (Glover, 1986).
The initial solution is obtained by a random
method, which draws random values for the clusters
of machines and parts. The neighbourhood structure
consists of two movements. The first movement
remove a machine or part from its cluster and inserts
it in another, since in the removed cluster remains, at
least, one machine or part. The second movement
swaps two machines or parts from different clusters.
A list of the five best solutions found is stored in a
candidate list. The intensification is applied every 20
consecutive iterations without improvement and
consists of taking the best solution of the candidate
list and generating a larger number of neighbours,
providing a robust search in a promising area. Every
time a candidate solution is used, it’s removed from
the candidate list. The tabu list applied in this paper
stores the machine or part moved and its origin
cluster for 20 iterations. Even so, a tabu movement
can be used since the objective function is improved.
The objective function used to evaluate the solutions
is the group efficacy, shown in section 2. The
stopping criterion applied is the maximum iteration
number without improvement (nbmax) and its size is
200.
4 ARCHITECTURE
To demonstrate the performance of each
implemented algorithm in the MCFP, we generated
300 random incidence matrices with a uniform
distribution. 100 instances size 10 x 10 and
magazine size limited to 4 tools, 100 instances size
40 x 20 and magazine size limited to 6 tools, and 50
instances size 100 x 100 and magazine size limited
to 6 tools. The magazine limitation means that a Part
NjkNkkNjj
Njk
−+
∑
=
+
n
j
KPj
1
A STUDY FOR MANUFACTURING CELL FORMATION APPROACH CONSIDERING SETUP
45
will not have more tools than its limitations.
The tests occur in two phases. In the first phase it
will be used two exact methods, ROC and SLC, and
two metaheuristics, TS and GA, to test their group
efficacy in random matrices. The second phase will
compare the group efficacy of the 4 techniques in a
set of 35 problems found in literature. Finally, the
results of GA and TS will be compared with the best
result found with the source problems. The tests
were run on a personal computer with a Core 2 Duo
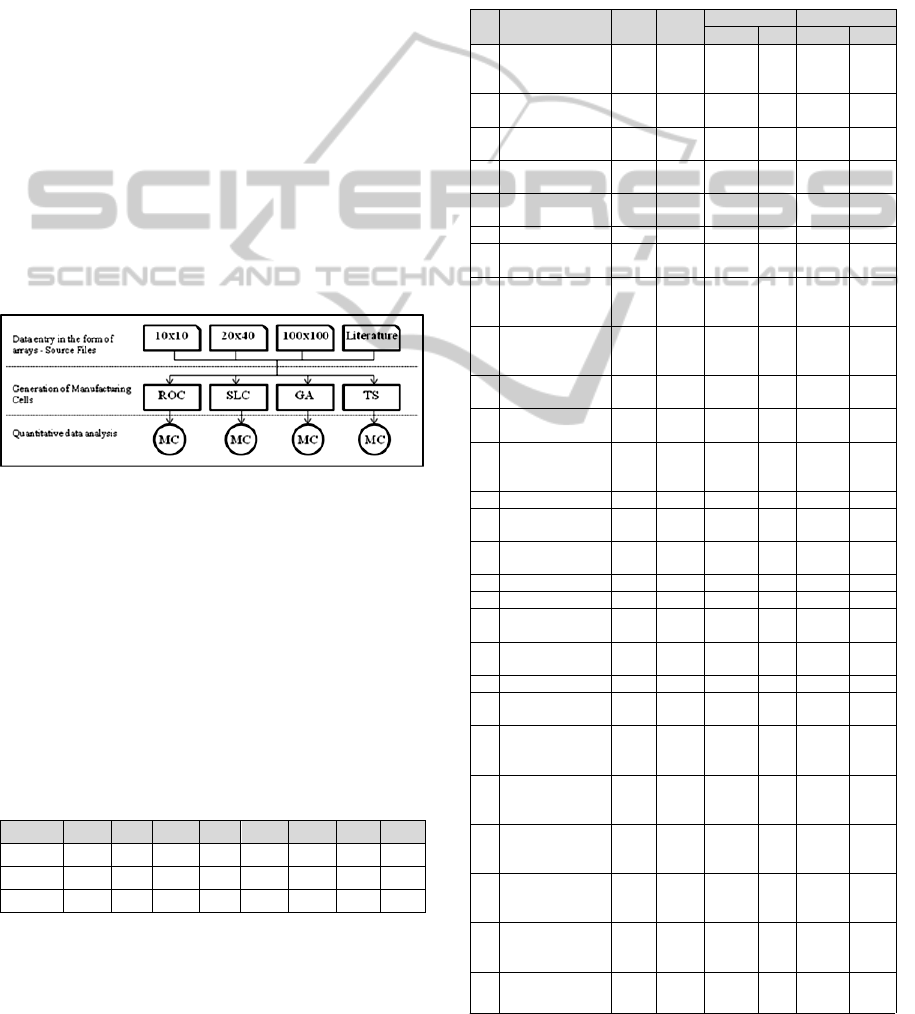
processor and 2 GB of RAM Memory. Figure 3
shows the model architecture.
In this model, it can be observed that the ROC
obtains the solutions by the diagonalizing of the
matrices and the SLC obtains the solutions by the
similarity coefficient. These two techniques do not
see the problem as a whole at every stage of their
solution procedures. However, TS and GA consider,
for each solution, the whole problem of obtaining
better solutions. In the TS solutions are evaluated
using group effectiveness, maximizing the number
of 1s in the diagonal blocks, while in GA the fitness
function tries to reduce the exceptional items.
Figure 3: Model architecture.
5 COMPUTACIONAL
EXPERIMENTS AND RESULTS
Initially, the ROC, SLC, GA and TS were applied in
3 types of matrices, 10x10, 20x40 and 100x100. The
Table 1 below shows the matrices size and for each
technique, ROC, SLC, GA and TS, shows the group
efficacy presented in section 2, and its standard
deviation.
Table 1: Random matrices analysis.
Size ROC
δ
SLC
δ
GA δ TS δ
10x10 20,21
3,50
24,36
4,44
37,10
4,87 54,37 5,68
20x40 13,98
0,99
25,00
1,74 26,88 7,65 38,69 8,27
100x100 25,81
0,29
22,73
0,79
26,89
27,69
33,95 13,55
The group efficacy of the 4 techniques studied in
this paper was compared with a set of 35 problems
from the literature. These problems were presented
in James et. al. (2007) and the results were obtained
directly from the original article they appeared.
The Table 2 below presents an ID to identify the
problem, the source problem and the group efficacy
obtained using ROC and SLC. The values shown by
the GA and TS are the average group efficacy, they
are obtained in 100 executions of each matrix, and
their standard deviation.
Table 2: Comparing studied techniques.
ID Problem source ROC SLC
GA TS
Av.
δ
Av.
δ
1
King and
Nakornchai
(1982)
82,35 30,00 82,35 0,00 82,35 0,00
2
Waghodekar and
Sahu (1984)
57,14 50,00 49,79 6,74 69,57 0,00
3
Seifoddini
(1989)
85,19 40,74 77,36 0,00 79,59 0,00
4
Kusiak and
Chow (1992)
45,83 28,21 70,13 7,86 76,92 0,00
5
Kusiak and
Chow (1987)
36,51 32,43 42,85 2,47 60,87 0,00
6 Boctor (1991) 27,27 25,00 45,08 1,53 70,83 0,00
7
Seifoddini and
Wolfe (1986)
36,46 31,11 45,34 5,88 69,44 0,00
8
Chandrasekharan
and Rajagopalan
(1986a)
38,13 30,60 49,60 9,69 85,25 0,00
9
Chandrasekharan
and Rajagopalan
(1986b)
56,88 38,02 40,96 6,17 56,70 7,15
10
Mosier and
Taube (1985)
70,59 34,29 39,41 5,72 70,35 5,34
11
Chan and Milner
(1982)
92,00 29,21 48,31 7,70 92,00 0,00
12
Askin and
Subramanian
(1987)
61,46 23,15 25,62 4,98 55,35 6,78
13 Stanfel (1985) 55,45 16,95 26,00 4,32 68,71 3,94
14
McCormick et
al. (1972)
26,88 18,45 23,75 2,62 52,75 1,55
15
Srinivasan et al.
(1990)
32,07 21,43 24,43 5,35 53,74 6,57
16 King (1980) 28,25 19,23 20,83 2,06 55,78 1,24
17 Carrie (1973) 34,52 17,02 21,80 2,00 51,35 2,12
18
Mosier and
Taube(1985)
38,54 15,20 22,69 4,36 38,12 8,61
19
Kumar et al.
(1986)
32,65 14,84 21,23 3,36 50,13 2,10
20 Carrie (1980) 85,00 18,53 22,80 3,58 70,19 4,87
21
Boe and Cheng
(1991)
24,52 17,62 21,91 2,99 54,95 7,83
22
Chandrasekharan
and Rajagopalan
(1989)
98,50 13,42 17,68 3,11 100,00 0,00
23
Chandrasekharan
and Rajagopalan
(1989)
24,53 14,34 16,23 2,91 85,11 0,00
24
Chandrasekharan
and Rajagopalan
(1989)
14,75 13,64 15,58 1,64 73,51 0,00
25
Chandrasekharan
and Rajagopalan
(1989)
14,04 17,99 14,86 1,21 53,15 1,06
26
Chandrasekharan
and Rajagopala
(1989)
15,93 17,71 15,33 1,08 48,55 0,00
28
McCormicket
(1972)
35,59 16,10 21,97 3,82 53,41 3,91
ICINCO 2011 - 8th International Conference on Informatics in Control, Automation and Robotics
46
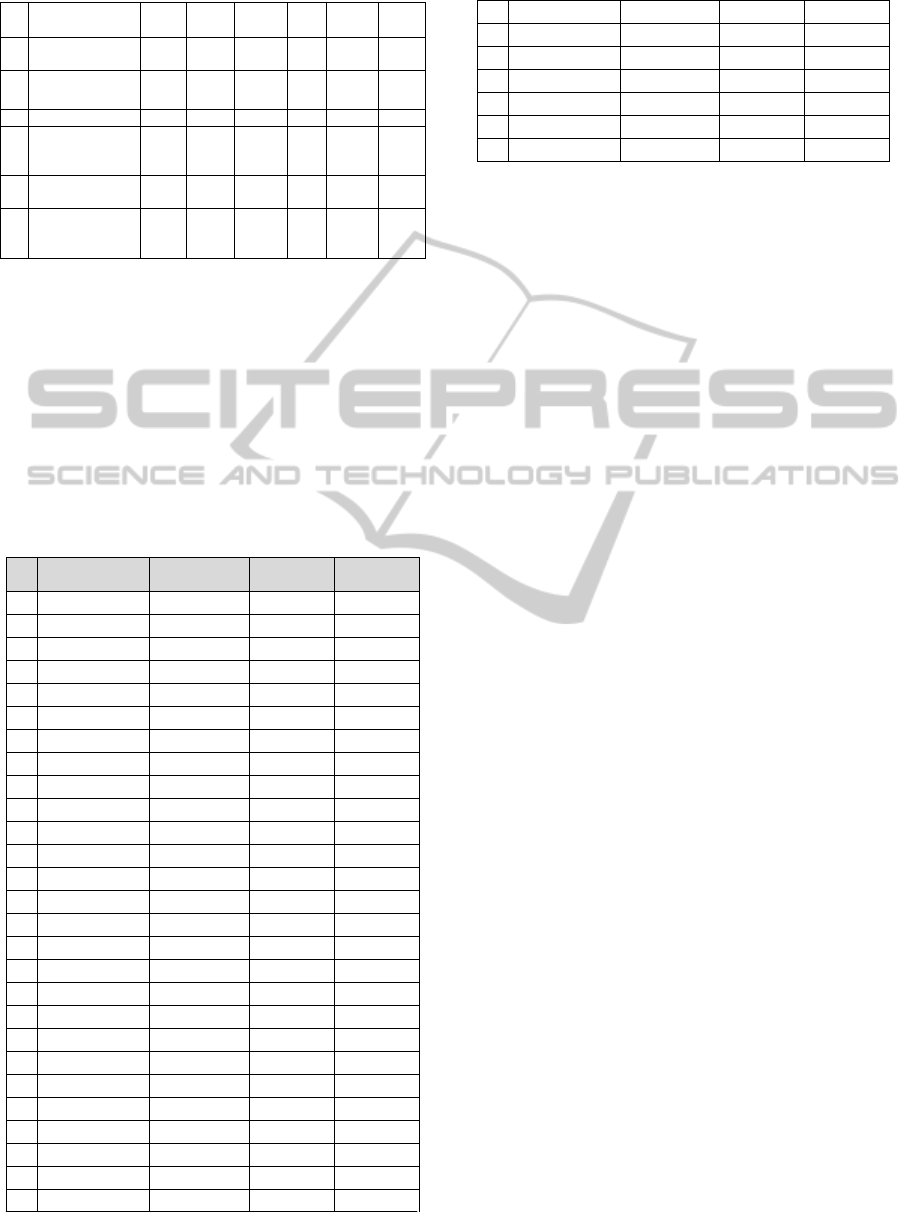
Table 2: Comparing studied techniques (Cont.).
29 Carrie (1980) 17,29 15,59 16,97 1,57 45,66 1,98
30
Kumar and
Vannelli (1987)
16,71 15,84 44,37 5,86 60,37 4,79
31 Stanfel (1985) 38,50 15,79 11,29 1,36 39,55 13,56
32 Stanfel (1985) 12,42 13,62 12,31 1,40 41,16 10,89
33
King and
Nakornchai
(1982)
13,87 12,74
9,59 1,53 43,19 3,89
34
McCormick et
al. (1972)
50,33 29,37
31,60 8,35 57,67 7,99
35
Chandrasekharan
and Rajagopalan
(1987)
27,42 10,01
12,01 1,30 83,08 0,91
In Table 2 above it can be observed that in this
set of 35 problems, ROC obtained the best solution
for the problems 1, 3 and 20, for all the other
problems, TS obtained the best average solution.
Finally, the techniques and the results found with
the source problem were compiled and analyzed.
Table 3 below shows the ID to identify the problem,
the technique which obtained the best solution in the
source problem articles and the best solutions
obtained by GA and TS.
Table 3: Comparing GA and TS with literature.
ID
Resolution
Techniques
Best Solution
Found
Best GA Best TS
1 ZODIAC 73,68
82,35
82,35
2 GATSP 68,00
62,50
69,57
3 EA 79,59
77,36
79,59
4 GATSP 76,92
76,92
76,92
5 EA 53,13
46,51
60,87
6 GATSP 70,37
46,34
70,83
7 ZODIAC 68,30
53,70
69,44
8 EA 85,25
60,23
85,25
9 MST 58,72
56,07
58,72
10 GAL 72,79
46,15
75,00
11 ZODIAC 92,00
57,50
92,00
12 EA 69,86
32,76
69,86
13 GP 71,80
35,47
71,83
14 EA 52,58
28,24
52,75
15 ZODIAC 67,83
36,33
68,99
16 GAL 86,25
26,55
57,53
17 EA 54,46
26,24
57,43
18 EA 42,94
31,78
42,74
19 EA 49,65
29,03
50,81
20 GP 76,70
22,80
77,91
21 EA 58,07
21,91
57,98
23 MST 85,11
24,49
85,11
24 GRAFICS 73,51
20,33
73,51
25 GP 53,30
18,18
53,15
26 GP 47,90
19,05
48,55
27 EA 44,75
18,05
46,90
28
EA 54,27
31,36
53,41
Table 3: Comparing GA and TS with literature (Cont.).
29 EA 44,37
20,53
46,78
30 GP 60,70
54,98
62,24
31 GP 59,40
16,16
59,77
32 EA 50,48
16,89
50,83
33 EA 42,12
12,25
44,61
34 MST 56,42
46,38
60,48
35 GATSP 84,03
16,21
84,00
The ZODIAC was obtained from
Chandrasekharan and Rajagopalan (1987),
GRAFICS was obtained from Srinivasan and
Narendran (1991), GA-Genetic Algorithm was
obtained from Onwubolu and Mutingi (2001), GP-
Genetic Programming Algorithm was obtained from
Dimopoulos and Mort (2001). The results for
ZODIAC and GRAPHICS were both obtained from
Srinivasan and Narendran (1991); otherwise the
results were taken from the original citation.
6 CONCLUSIONS
This work presents a study for manufacturing cell
formation approach considering setup with the
application and analysis of 4 techniques, ROC, SLC,
GA and TS in random matrices with different sizes
and in a set of 35 known problems. Considering the
experiments universe, SLC obtained better solutions
in matrices size 10x10 and 20x40, in matrices size
100x100 ROC obtained better solution with a lower
standard deviation.
The TS and GA obtained better solutions and a
lower standard deviation compared with ROC and
SLC. It happened because TS and GA use the search
space to look for new solutions while ROC are
limited by the sorting technique and SLC are limited
by the similarity coefficient. Analysing the
techniques, in the set of 35 problems, it can be seen
that TS obtained better solutions in about 57% of the
35 problems studied while ROC obtained better
solutions in 8% of the 35 problems. Even so, TS
proved to be robust obtaining better solutions with a
low standard deviation. Finally, using a technique
that generates a better group efficacy means that
lower number of setups and lower setup time will be
needed to process a whole Parts Family, providing a
higher production rate.
REFERENCES
Askin, R. G., Subramanian, S. P., 1987. A cost-based
heuristic for group technology configuration.
A STUDY FOR MANUFACTURING CELL FORMATION APPROACH CONSIDERING SETUP
47

International Journal of Production Research, v. 25(1),
p. 101–13.
Bajestani, M. A., Rabbani M., Rahimi-Vahed, A. R. and
Khoshkhou, G. B., 2009. A multi-objective scatter
search for a dynamic cell formation problem,
Computers and Operations Research, 36, 777-794.
Boe, W. J., Cheng, C. H., 1991. A close neighbour
algorithm for designing cellular manufacturing
systems. International Journal of Production Research,
v. 29(10), p. 2097–116.
Chan, H. M., Milner, D.A., 1982. Direct clustering
algorithm for group formation in cellular
manufacture. Journal of Manufacturing Systems, v. 1,
p. 65–75.
Chan, W. M., Chan, C. Y. and Ip, W. H., 2002. A heuristic
algorithm for machine assignment in cellular layout,
Computers and Industrial Engeneering, 44, 49-73.
Chandrasekharan, M. P., Rajagopalan, R., 1986a.
MODROC: an extension of rank order clustering for
group technology. International Journal of Production
Research, v. 24(5), p. 1221–64.
Chandrasekharan, M. P., Rajagopalan, R., 1986b. An ideal
seed non-hierarchical clustering algorithm for cellular
manufacturing.International Journal of Production
Research, v. 24(2), p. 451–64.
Chandrasekharan, M. P., Rajagopalan, R., 1987. ZODIAC:
an algorithm for concurrent formation of part-families
and machine-cells.International Journal of Production
Research, v. 25(6), p. 835–50.
Chandrasekharan, M. P., & Rajagopalan, R., 1989. Group
ability: Analysis of the properties of binary data
matrices for group technology. International Journal of
Production Research, 27(6),1035–1052.
Dimopoulos, C., Mort, N., 2001. A hierarchical clustering
methodology based on genetic programming for the
solution of simple cell-formation problems.
International Journal of Production Research, v. 39, p.
1–19.
Glover, F., 1986. Future paths for integer programming
and links to artificial intelligence. Computers and
Operations Research, 1, p. 533-549.
Holland, J. H., 1975. Adaptation in natural and artificial
systems. Ann Arbor. MI: University of Michigan
Press.
James, T. L., Brown, E. C. and Keeling, K. B., 2007. A
hybrid grouping genetic algorithm for the cell
formation problem. Computers and Operations
Research, 34, 2059-2079.
King, J. R., 1980. Machine-component grouping in
production flow analysis: an approach using a rank
order clustering algorithm. International Journal of
Production Research, v. 18, p. 213–32.
King, J. R., Nakornchai, V., 1982. Machine-component
group formation in group technology: review and
extension. International Journal of Production
Research, v. 20(2), p. 117–33.
Kumar, K. R., Kusiak, A., Vannelli, A., 1986. Grouping of
parts and components in flexible manufacturing
systems. European Journal of Operations Research, v.
24, p. 387–97.
Kumar,
K. R., Vannelli, A., 1987. Strategic subcon-
tracting for efficient disaggregated manufacturing.
International Journal of Production Research, v.
25(12), p. 1715–28.
Kumar, K. R., & Chandrasekharan, M. P., 1990. Grouping
efficacy: A quantitative criterion for goodness of block
diagonal forms of binary matrices in group
technology. International Journal of Production
Research, 28(2), 233–243.
Kusiak, A., Chow, M., 1992. Similarity coefficient
algorithm for solving the group technology problem.
International Journal of Production Research, v.
30(11), p. 2633–46.
Kusiak, A., Chow, W. S., 1987. Efficient solving of the
group technology problem. Journal of Manufacturing
Systems, v. 6(2), p. 117–24.
McCormick, W., Schweitzer, P., White, T., 1972. Problem
decomposition and data reorganization using a
clustering technique. Operations Research, v. 20, p.
993–1009.
Mosier, C. T., Taube, L., 1985. The facets of group
technology and their impact on implementation.
OMEGA, v. 13(5), p. 381–91.
Onwubolu, G. C., Mutingi, M., 2001. A genetic algorithm
approach to cellular manufacturing systems.
Computers & Industrial Engineering, v. 39, p. 125–44.
Papaioannou, G. and Wilson, J. M., 2008. Fuzzy
extensions to Integer Programming models of cell-
formation problems in machine scheduling. Annals of
Operations Research, 166, 163-182.
Saidi-Mehrabad, M. and Safaei, N., 2007. A new model of
dynamic cell formation by a neural approach,
International Journal of Advanced Manufacturing
Technology, 33, 1001-1009.
Safaei, N., Saidi-Mehrabad, M., Tavakkoli-Moghaddam,
R. and Sassani, F., 2008. A fuzzy programming
approach for a cell formation problem with dynamic
and uncertain conditions. Fuzzy Sets and Systems,
159, 215-236.
Sarker, B. R., 2001. Measures of grouping efficiency in
cellular manufacturing systems. European Journal of
Operational Research, 130(3),588–611.
Seifoddini, H., & Wolfe, P. M., 1986. Application of the
similarity coeffcient method in group technology. IIE
Transactions, 18, 3, 266-270.
Seifoddini, H., 1989. A note on the similarity coefficient
method and the problem of improper machine
assignment in group technology applications.
International Journal of Production Research, v. 27(7),
p. 1161–5.
Srinivasan, G, Narendran, T., 1991. GRAPHICS—a non-
hierarchical clustering algorithm for group
technology. International Journal of Production
Research, v. 29, p. 463–78.
Spiliopoulos, K.; Sofianopoulou S., 2008. An efficient ant
colony optimization system for the manufacturing cells
formation problem, International Journal of Advanced
Manufacturing Technology, 36, 589-597.
Waghodekar, P. H., Sahu, S., 1984. Machine-component
cell formation in group technology MACE.
International Journal of Production Research, v. 22, p.
937–48.
ICINCO 2011 - 8th International Conference on Informatics in Control, Automation and Robotics
48
