
ON THE USE OF SOFTWARE VISUALIZATION TO ANALYZE
SOFTWARE EVOLUTION
An Interactive Differential Approach
Renato Lima Novais
1,2
, Glauco de F. Carneiro
1
, Paulo R. M. Simões Júnior
1
,
Manoel Gomes Mendonça
1
1
Computer Science Department, Federal University of Bahia, Bahia, Brazil
2
Information Technology Department, Federal Institute of Bahia, Campus Santo Amaro, Bahia, Brazil
Keywords: Software visualization, Software evolution.
Abstract: Software evolution is one of the most important topics in modern software engineering research. This
activity requires the analysis of large amounts of data describing the current software system structure as
well as its previous history. Software visualization can be helpful in this scenario, as it can summarize this
complex data into easy to interpret visual scenarios. This paper presents a interactive differential approach
for visualizing software evolution. The approach builds multi-view structural descriptions of a software
system directly from its source code, and uses colors to differentiate it from any other previous version. This
differential approach is highly interactive allowing the user to quickly brush over many pairs of versions of
the system. As a proof of concept, we used the approach to analyze eight versions of an open source system
and found out it was useful to quickly identify hot spot and code smell candidates in them.
1 INTRODUCTION
Most of the software engineering costs are
associated with software evolution and maintenance
(Erlikh, 2000). Software evolution has been studied
for different purposes – reengineering, refactoring,
and maintenance – from different point of views –
process, architecture, and reuse – and it is one of the
most important topics in modern software
engineering research.
Maintenance tasks are heavily dependent on
comprehension activities. Before the programmer
can execute any maintenance, he/she has to
understand how the software works and how it is
internally structured. Researchers have pointed out
that 50% of the time spent in the maintenance phase
is devoted to software comprehension activities
(Fjeldstad and Hamlen, 1983).
Software visualization is a field of software
engineering that aims to help people to understand
software through the use of visual resources (Diehl,
2007). Most of the current software visualization
tools use the source code as its main information
source. Source code is the most formal and
unambiguous artifact developed and handled by
humans during the software development process.
One should expect that software visualization
can also be effectively used to analyze and
understand how software evolves. In fact, there are
many applications for software evolution
visualization. Some we have found in the literature
are the identification of: (1) hot-spots of design
erosion and code decay (Ratzinger, Fischer, and
Gall, 2005); (2) elements that are inducing code
decay (Eick, Graves, Karr, Marron, and Mockus,
2001); and, (3) code smells (Lanza, Marinescu, and
Ducasse, 2005) in the software. Independent of the
portrayed information, high or low level, the
common goal of these applications is to provide the
user with a natural, instinctive and easy way to
understand problems that permeate the software
evolution process.
As mentioned before, source code is a key
information source for data gathering. Current
software configuration management (SCM) systems
keep track of code releases and versions as they
evolve. For this reason, this information is readily
accessible from those systems. Notwithstanding its
appeal, visualizing software evolution through its
15
Lima Novais R., de F. Carneiro G., R. M. Simões Júnior P. and Gomes Mendonça M..
ON THE USE OF SOFTWARE VISUALIZATION TO ANALYZE SOFTWARE EVOLUTION - An Interactive Differential Approach.
DOI: 10.5220/0003430700150024
In Proceedings of the 13th International Conference on Enterprise Information Systems (ICEIS-2011), pages 15-24
ISBN: 978-989-8425-55-3
Copyright
c
2011 SCITEPRESS (Science and Technology Publications, Lda.)

source code is not a trivial task. One important
problem is the large amount of data with which one
has to cope (Voinea and Telea, 2006a).
In spite of the difficulties, many researches are
trying to identify how software visualization can
help with software evolution (Beyer and Hassan,
2006) (Voinea and Telea, 2006b) (Lanza, 2001)
(D'Ambros, Lanza, and Lungu, 2009). The majority
of them only analyze the high level information
provided by SCM systems such as CVS, SVN and
GIT. Information such as the number of changes in a
file, co-changed (or logical) coupling, the growth in
a file size, or how many authors has worked on it.
To obtain this information, one does not have to
analyze the source code itself, as it can be directly
extracted from the SCM metadata.
A few other works analyze the source code itself
(Lanza, 2001) (Collberg, Kobourov, Nagra, Pitts and
Wampler, 2003). This approach is also very
promising. Through it, one can extract precious
software evolution information – such as code size
and module dependency – that is not readily
available as SCM metadata. Unfortunately, this
approach is also more complex. In order to
understand how the code evolves, one has to extract
information over many versions of the source code
and organize it for automated or human-based data
analysis. Our work tackles this problem.
During the past three years, we have been
developing a multi-perspective software
visualization environment named SourceMiner
(Carneiro, Silva, Mara, Figueiredo, Sant'Anna,
Garcia, and Mendonça, 2010a) (Carneiro,
Sant´Anna, Mendonça, 2010b) (Carneiro,
Sant´Anna, Garcia, Chavez, and Mendonça, 2009).
This is a general purpose software visualization
environment that is integrated into an industrial
strength IDE (Eclipse). It provides several different
integrated views to visualize Java software projects.
The work presented in this paper augments
SourceMiner with a differential approach for
visualizing software evolution. Although, it is
tailored to SourceMiner, this approach is, in theory,
applicable to other source code visualization tools. It
consists of loading several code versions into the
environment and allowing the user to compare any
two versions through the visualization environment.
Upon the selection of two versions, the views of the
environment show the most recent one and use its
colors to highlight the changes on this version with
respect to the other one.
Although the approach is differential, comparing
only two versions at a given moment, it is highly
interactive. A range bar widget can be used to
dynamically select any two of the available versions.
Views are then instantaneously updated for user
analysis. This allows the user to quickly browse over
any pair of versions, from several different
visualization perspectives.
The current work uses three visualization
metaphors to present evolution from three different
perspectives: structure, inheritance and dependency.
A software layer was developed to access
information directly from the SubVersion (SVN)
configuration management system.
This paper presents the approach, describes the
resources provided by SourceMiner for its support,
and discusses ways of using them for software
evolution analysis. The remainder of the paper is
organized as follows. Section 2 introduces some
background concepts. Section 3 discusses our
approach. Section 4 shows the approach in action.
Section 5 discusses related works. And, Section 6
concludes the paper with an outlook at future work.
2 BACKGROUND
This section presents some basic concepts related to
this work. Section 2.1 focuses on software evolution
and Section 2.2 focuses on software visualization.
2.1 Software Evolution
The IEEE Standard 1219 (1993) definition for
software maintenance is “the modification of a
software product after delivery to correct faults, to
improve performance or other attributes, or to adapt
the product to a modified environment”. The term
software evolution has been used as a preferable
substitute for software maintenance (Bennett and
Rajlich, 2000). In general, software evolution is
related to why or how software changes over the
time.
According to the continuous change law stated
by Lehman in the seventies, software change is
inevitable; otherwise the software would die
(Lehman, 1980). Software needs to change for many
reasons. New requirements emerge when the
software is being used. Bugs are detected and must
be fixed. Functional and non-functional
improvements are needed to fulfill new requirements
in the business environment. The software system
must work on new hardware and software platforms.
On top of this all, the size and complexity of
modern software systems are continuously
increasing to keep up with the pace of hardware
evolution and new functionalities requested by users.
ICEIS 2011 - 13th International Conference on Enterprise Information Systems
16
This has demanded a greater concern about the
management of software evolution. Thousands of
lines of code and documentation must be kept up to
date as systems evolve, and tool support is
fundamental in this context.
Considering the importance of software
evolution and the need for software change, new
methodologies, processes and tools to efficiently
manage software evolution are urgent necessities in
modern software engineering organizations.
2.2 Software Visualization
Software visualization (SoftVis) can be defined as
the mapping from any kind of software artifact to
graphical representations (Koschke, 2003) (Roman
and Cox, 1992). SoftVis is very helpful because it
transforms intangible software entities and their
relationships into visual metaphors that are easily
interpretable by human beings. Consider coupling
among software modules as an example. Using a
graph as a visual metaphor, these modules can be
represented as nodes and the coupling information
can be represented as directed edges to build an
intuitive visual metaphor for their dependency.
Without a visual representation, the only way to
analyze this information would be to look inside the
source code or at a table of software metrics, in a
potentially labor and cognitive intensive effort.
There are several classification taxonomies for
SoftVis. Some divide SoftVis according to type of
visualized object. Diehl (2007), for example, divides
software visualization into visualizing the structure,
behavior and evolution of the software. Structure
refers to visualizing static parts of the software.
Behavior refers to visualizing the execution of the
software. Evolution refers to visualizing how
software evolves (Diehl, 2007).
Software can also be visually analyzed from
different perspectives (Carneiro et al., 2010a). In this
case, visualization can be classified according to the
point of views it provides to engineers to explore a
software system.
SoftVis can also be classified according to the
metaphors it uses to represent software. Among
others, visualizations can use iconographic, pixel-
based, matrix-based, graph-based and hierarchical
metaphors (Keim, 2002) (Ferreira de Oliveira and
Levkowitz, 2003).
This paper focuses on the static visualization of
source code of object-oriented systems using
multiple perspectives and different types of
metaphors. Multiple perspectives are needed for
analyzing the different static characteristics of the
source code. On the same token, certain types of
metaphors are best suited to certain perspectives,
and it would be confusing if the same metaphor is
used to represent two different perspectives
(Carneiro et al., 2010b).
For example, one can be interested in
investigating software according to its structure.
This structural perspective reveals how the software
is organized into packages, classes and methods. The
IDEs usually provide a hierarchical view for this
purpose. Eclipse’s package explorer is a very well
known example of such a view. It uses an
iconographic tree to represent the system’s package
and file structure.
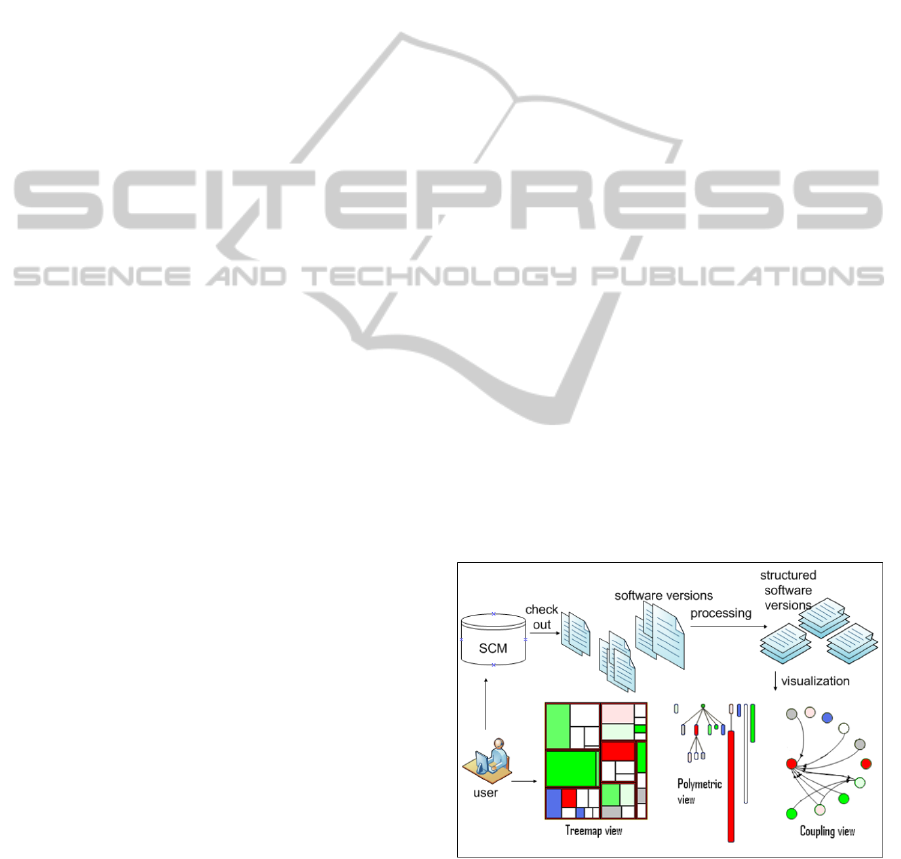
SourceMiner uses treemaps as its own visual
metaphor to represent the software from a structural
perspective, see Figure 1. A Treemap is a
hierarchical 2D visualization that maps a tree
structure into a set of nested rectangles (Johnson and
Shneiderman, 1991). In SoftVis, the nested
rectangles can represent software entities, like
packages, classes and methods. Rectangles
representing methods of the same class are drawn
together inside the rectangle of the class. Likewise,
the rectangles of the classes that belong to the same
package are drawn together inside the rectangle of
the package.
Treemaps are constructed recursively and fits
well in a reduced space. A computer screen can fit
thousands of small rectangles. This is a clear
advantage over the package explorer tree structure.
Another bonus of this approach is that the size and
the color of the rectangles can be easily associated to
metrics such as module size and complexity.
Figure 1: Views, Perspectives and Overview of the
Approach.
Another perspective of interest in OO systems is
the inheritance tree. It is important to visually show
which classes extends others or implement certain
ON THE USE OF SOFTWARE VISUALIZATION TO ANALYZE SOFTWARE EVOLUTION - An Interactive
Differential Approach
17
interfaces. In this case, it is also desirable to use a
hierarchical metaphor, but SourceMiner does not use
treemaps in order to avoid confusion. Instead, it uses
a metaphor called polymetric views for this purpose,
see Figure 1. A polymetric view uses a forest of
rectangles to represent the inheritance trees formed
by classes and interfaces in a software system
(Lanza and Ducasse, 2003). Rectangles are linked by
edges representing the inheritance relation between
them. The length and width of the rectangles can be
used to represent software attributes such as the size
and number of methods of a class.
The third perspective discussed here is the
dependency perspective. It represents the coupling
between software entities, in this case, software
modules that depends on other modules. One of the
most useful views to describe this kind of
information is interactive directed graphs (IDG), see
Figure 1. IDG’s coupling views use nodes to
represent software modules and directed edges to
represent the dependency between them. Like in the
other views, the visual attributes can be used to
express the attributes of the represented software
entities. The size of a graph node can be associated
to the size of a module, for example.
Observe that each perspective represents the
software from a different point of view. This way,
views from different perspectives can be used to
complement each other. Also, different views –
views that use different metaphors – may be used to
represent the software from the same perspective.
SourceMiner uses, for example, relationship
matrixes and egocentric graphs as complementary
views to the dependency perspective. This paper,
however, will focus only on the use of the three
views previously discussed – polymetric, treemaps
and IDGs – to represent the inheritance, structural
and dependency perspectives. Its goal is to use them
to analyze software evolution under distinct points
of view.
3 A DIFFERENTIAL APPROACH
TO UNDERSTAND SOFTWARE
EVOLUTION
This section presents the differential approach to
visualize software evolution attributes. The goal is to
use a multiple view software visualization approach
to identify hot-spots of design erosion and structural
decay in the code (Ratzinger et al., 2005).
3.1 Using Colors to Represent
Evolution Attributes
Several attributes can be used to characterize
software evolution. Size, coupling and inheritance
hierarchy are examples of these attributes and the
important issue here is how they evolve over time.
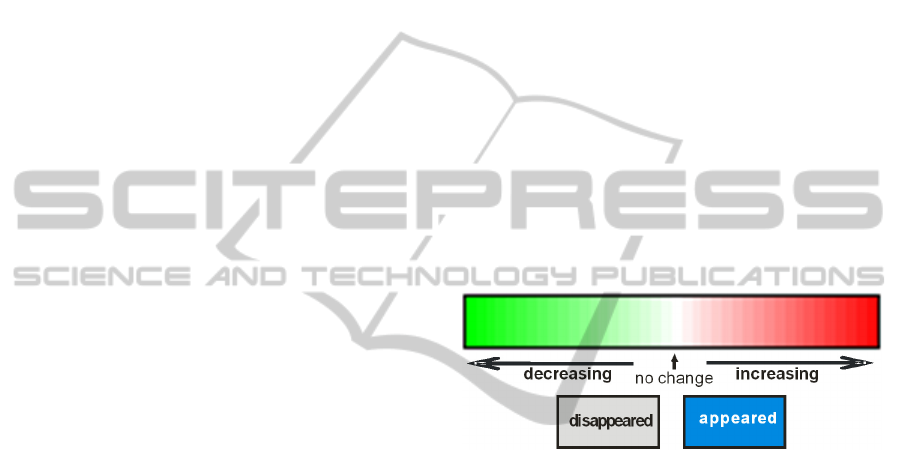
Visual elements in SourceMiner’s views are
decorated with colors to denote this scenario and
therefore support its analysis. Users can dynamically
select any two versions of a software system.
Elements that appeared from one version to the other
are painted in blue. Elements that disappeared are
painted in gray. Elements that decreased or increase
are painted in a color scale that ranges from bright
green (decreased a lot) to bright red (increased a lot),
using white to denote elements that have not
changed. Figure 2 portrays the element differential
decoration colors. As colors perception may depend
on cultural, linguistic, and physiological factors
(Mazza, 2009), the choice of colors is a configurable
item in the visualization tool.
Figure 2: Colors used to decorate changing software
elements.
Color interpolation is used to show the size
variation as follows. The greater the growth/decrease
the brighter the color used. To smoothly interpolate
a color from an initial color IC (e.g. green
representing decrease) to a final color FC (e.g. red
representing growth) going through a neutral color
ZC (e.g. white representing no variation), based on
the value of a certain metric value, SourceMiner
uses the expressions represented in (1). Where NC =
new color, FC = final color, IC = initial color, and
R,G,B
is the RGB value of that color (e.g. FC
G
is the
green RGB value of the final color FC).
NC
R
=(FC
R
* ratio) + IC
R
* (1 - ratio)
NC
G
=(FC
G
* ratio) + IC
G
* (1 - ratio)
NC
B
=(FC
B
* ratio) + IC
B
* (1 – ratio)
ratio = (itemValue - minValue)/
(maxValue - minValue)
(1)
minValue is the minimal value associated to IC.
maxValue the maximal value associated to FC.
itemValue is the value for which the color is being
ICEIS 2011 - 13th International Conference on Enterprise Information Systems
18

calculated and zeroValue is the value associated to
ZC (the neutral color).
minValue <= itemValue <= maxValue.
If itemValue < zeroValue one should use the
maxValue as zeroValue, FC as ZC, in (1). The rest of
the equation remains the same. If itemValue ≥
zeroValue, one should use minValue as zeroValue,
IC as ZC, and the rest of the equation remains the
same. At the end, the interpolated color for the item
with an itemValue value is the RGB color
represented by {NC
R
, NC
G
, NC
B
}.
All these values are positive integers, because
they are represented as RGB values. In the context
of software evolution, metrics can be either positive
or negative. So, sometimes the system will need to
shift values to a positive scale. The procedure
presented in (2) is used for that. zeroValue is set as
the module of the minValue. maxValue is added with
module of minValue, and minValue receives the
value 0. For consistency, the itemValue, for which
one wants to calculate the interpolated color, should
also be shifted by the module of minValue.
zeroValue = | minValue |
maxValue = maxValue + zeroValue
minValue = 0
(2)
3.2 A Differential Approach to
Visualize Software Evolution
Our approach, summarized on Figure 1, starts when
the user checks out the versions of the software
he/she wants to analyze from the SCM system.
SourceMiner then analyses all versions. The
analyzer reads the Eclipse’s Abstract Syntax Tree
for each system and stores the gathered information
in internal data structures for fast access and search.
This process is depicted on the top of Figure 1.
The user can now select a metric of interest and
operate a range bar widget to interactively select any
two of the analyzed versions. The system calculates
the amount of change on the selected metric (e.g.
size), between the two chosen versions, for each one
of the software elements that exist in the system.
In this differential approach, the views always
show the most recent of the selected versions of the
analyzed software. The views are decorated with the
changing colors as discussed in the previous section.
Although our approach treats elements that have
appeared and disappeared, the current
implementation does not yet display elements that
disappeared (grey elements).
The source code of the most recent of the
selected versions is readily accessible from the
views graphical elements. Clicking on any visual
element will bring forth the source code of this
element on the Eclipse Editor, so the user can obtain
details on demand directly from the source code.
One important question that emerges here, which
can be seen as a limitation of the approach, is that it
just takes into account two of the processed versions
to decorate the views. The visualization shows the
diff between these two versions, but it misses
intermediate values. Consider three versions – 1, j
and n – as an example. Consider that 1 < j < n and
some values M1 = 5, Mj = 3 and Mn = 9 for a
certain metric of a given software entity. In the
example, the system only considers the versions 1
and n, and portrays the difference Mn – M1 = 4. The
views do not explicitly show what happened
between 1 and j or between j and n.
This is in fact a limitation, but it is not a major
problem. The user can easily and quickly select any
other two versions among the analyzed ones. The
elapsed time between version selection and the
construction of new views are instantaneous for all
practical purposes. This allows for fast interactive
exploration of different versions and the differences
among them. Moreover, this can be done using all
three different perspectives of SourceMiner and the
metrics that are currently implemented in it (size,
cyclomatic complexity, number of methods, and
afferent and efferent coupling). In any case, all three
views are consistently colored with respect to the
metrics selected.
3.3 Using Multiple Perspectives
Figure 3 depicts the SourceMiner plug-in in action.
There are three views presented in this picture:
Package Explorer, an original Eclipse view, on the
top left. It is showing eight versions of a Software
Product Line (SPL). These versions were
sequentially analyzed by the SourceMiner, and data
were extracted from each project. At the left bottom,
there’s the EvolutionFilters view. Through this
view, the user can select the two versions to be
differentially analyzed, using a range bar. This
widget is highlighted on the picture. This view also
allows the user to select the metric he wants to
analyze and the colors that will be used in the views.
The right side of Figure 3 is filled by the
generated Treemap view. This view is showing the
evolution in lines of code from version 7 to version
8 of the system. The user can use it to visually
identify elements (methods, in this view) that had its
size changed, and how they are spread in the project.
It also highlights the elements with the highest
ON THE USE OF SOFTWARE VISUALIZATION TO ANALYZE SOFTWARE EVOLUTION - An Interactive
Differential Approach
19
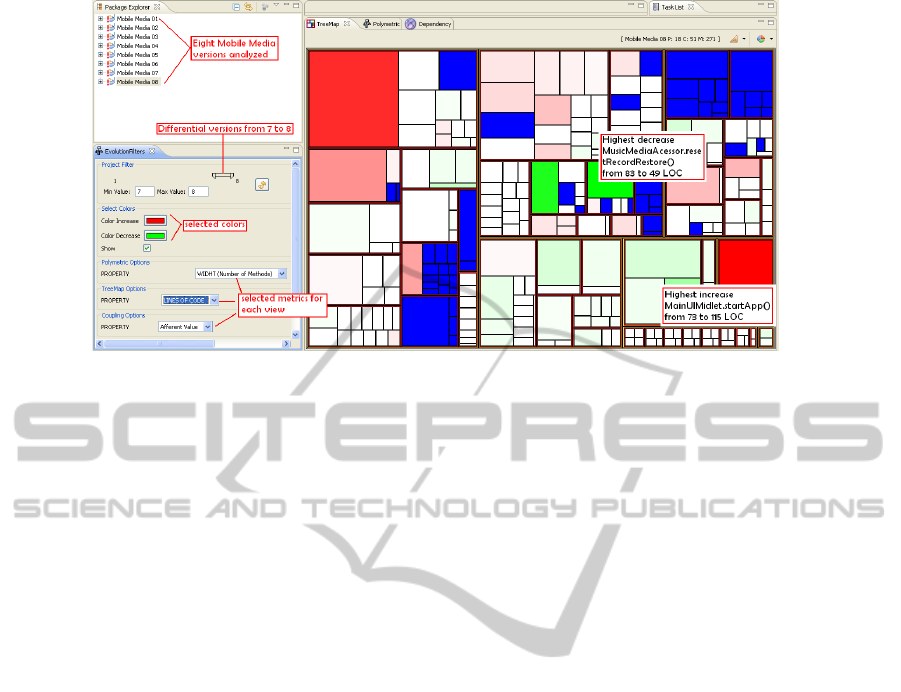
Figure 3: SourceMiner plug-in in action.
decrease – brightest green – and highest increase –
brightest red.
Mind that other metrics can be used as well. If
the selected metric is complexity, dark red show
elements that had a steep increase in complexity
with respect to the other version, and so on so forth.
Observe that the other (polymetric and
dependency) views are also present in Figure 3.
They are hidden under the treemap view to facilitate
its readability. The Eclipse environment allows for
many layouts for the views. SourceMiner views can
be configured and mingled with Eclipse views and
resources. These layouts can then be saved for
specific tasks.
As a generic data exploration strategy, we
recommend the use of the treemap view to
understand the big picture of system evolution.
Several situations can be represented in this
structural view: 1) the software is growing if the
majority of the colors are red; 2) a module is a
hotspot for decaying analysis if it is bright red for
complexity metrics when other are behaving
differently; 3) a sub-system was under refactoring or
redesign if the majority of its elements are green or
white; 4) an element is possibly losing functionality,
or reducing its role in a system, if they are bright
green.
The Polymetric view can also help with the big
picture, showing how the inheritance structure of a
system is changing over the time. In order to
illustrate some situations that can be detected
through the inheritance view, suppose that a class A
is inherited by classes B, C and D. If A grows too
much (bright red), it may be adding extraneous
functionality and have a negative impact in its
descendants. If B, C and D grows as A remains the
same this might represent a pull-up refactoring
opportunity. The opposite scenario may indicate a
push-down refactoring opportunity. If A grows as B,
C, and D decreases this might indicate the
occurrence of pull-up refactoring operation. The
opposite scenario may indicate a push-down
refactoring operation, and so on so forth.
The Coupling view shows the afferent and
efferent coupling between classes. With this
metaphor, one can analyze the impact of an element
in their dependents, or in the elements it depends on.
Consider that a class A is coupled with other
modules of the system. If there is an increasing
afferent coupling to A (more and more modules uses
resources of A), the maintenance costs of this part of
the system is increasing. If there is an increasing
efferent coupling from A (A uses more and more
resources from other modules), A is a candidate for
God Class (Lanza et al., 2005) and there might be a
class extraction refactoring opportunity.
4 SOURCEMINER IN ACTION
To test SourceMiner, we analyzed the evolution of
eight versions of a SPL called MobileMedia (MM).
This SPL manipulates photo, music, and video on
mobile devices. MM is an open source system and
has been used in many software engineering studies
(Carneiro et al., 2009) (Silva, Dantas, Honorato,
Garcia, and Lucena, 2010). Our analysis considered
the changes of MM version to version (from version
1 to 2, 2 to 3, 3 to 4, and so on so forth). Three views
and five metrics were used in the analysis process as
described on Table 1.
The combination of versions, view and metrics
generated forty two snapshots of the MM evolution
ICEIS 2011 - 13th International Conference on Enterprise Information Systems
20
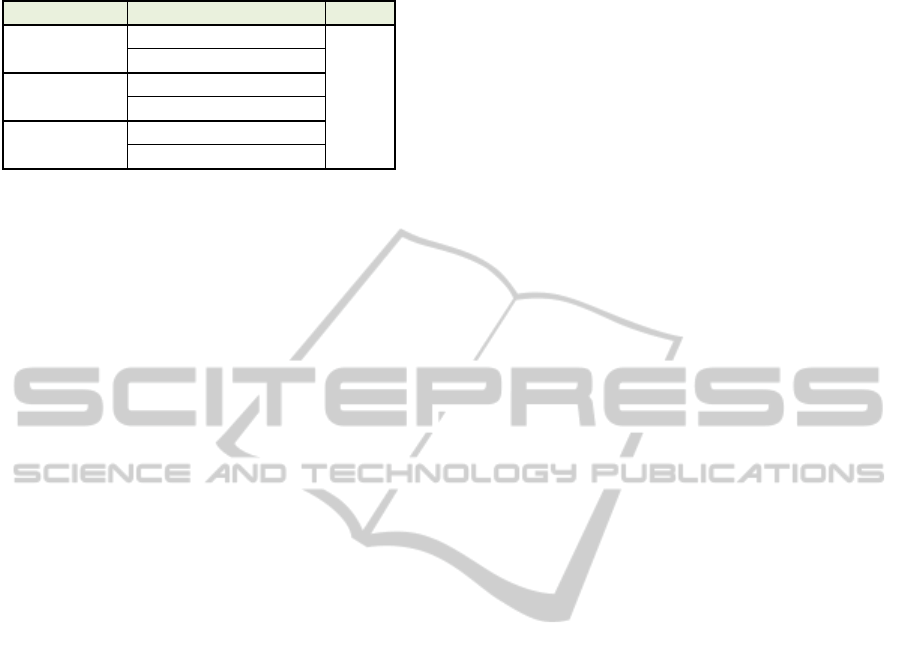
Table 1: Metrics used in each view.
View Metrics Versions
TreeMap
Complexity
1-2, 2-3,
3-4, 4-5,
5-6, 6-7,
7-8
Lines of code (LOC)
Polymetric
Number of Methods (NOM)
Lines of code (LOC)
Dependency
Afferent Coupling (AC)
Efferent Coupling (EC)
– comprising seven version differentials, three views
per differential, and two metrics per view. All these
pictures and their comments are available at the
study website (http://softvis.dcc.ufba.br/
MobileMediaEvolutionStudyJanuary2011). Due to
the space constraints of this paper, we discuss only
six analyses here.
The TreeMap-Complexity analysis showed that
the cyclomatic complexity of the software modules
evolved little from version to version. Only a few
elements showed variation in the analysis. There
was no variation in evolutions 2–3 and 3–4. Just new
elements have appeared during them. Only one
element increased in complexity in evolutions 1–2,
4–5, 5–6 and 6–7. And, as shown in Figure 4.a, two
elements increased and two decreased in complexity
in evolution 7–8.
The TreeMap-LOC analysis showed that the
evolution of this metric is easily perceived. The
majority of the elements changed along the
evolution, increasing in size. Evolution 1–2 showed
that the methods
BaseController.showImage
and
ImageUtil.getImageInfoFromBytes have
increased in size but decreased in complexity. The
element
BaseController.handleCommand(
Command c, Displayable d)
had the highest
increase (brighter red) in evolutions 1–2 , 2–3, 3–4
(see Figure 4.b). This element disappeared in version
5, and a new smaller element
BaseController.handleCommand(Command c)
appeared in its place.
The Polymetric–NOM analysis showed that from
version 1 to 2 only new elements have appeared (the
Exception package). There are elements with
increasing and decreasing behavior in almost every
analysis. It’s possible to identify variations on the
inheritance tree from version 4 on. For example, on
evolution 4–5, the element
BaseController has
decreased in number of methods (from 22 to 4). This
is the only green rectangle in Figure 4.c. This class
inherits from
AbstractController, an abstract
class created in version 5. So, one can easily infer
that some functionalities of
BaseController was
pulled-up to
AbstractController.
The Polymetric–LOC analysis confirmed that the
majority of the classes increase at each new version.
In evolution 4–5,
BaseController has decreased
from 629 to 93 lines of code. Almost all elements of
the
Controller inheritance tree showed variation
in evolution 7–8. This is shown on the third tree
from the left to the right of Figure 4.d. Three
elements in this tree showed significant a growth:
SelectMediaController (from 32 to 110),
PhotoViewController (from 119 to 153) and
MediaController (from 391 to 470). Following
our strategy, the software engineer should
investigate if there is any pull-up refactoring
opportunity in these classes.
The Dependency–AC analysis showed that the
afferent coupling metric has changed only in few
elements along the versions. There were no variation
in evolutions 1–2 and 3–4. Although there were not
many changes, the afferent coupling generally
increased when this change happened. Only two
elements have decreased their AC values:
BaseController, in evolution 4–5 and
AlbumListScreen, in evolution 6–7. The highest
growths were observed in evolution 4–5 (see Figure
4.e):
MainUIMidlet (from 1 to 6), AlbumData
(from 4 to 9) and
AlbumListScreen (from 1 to 6).
This evolution had a major impact on this
subsystem, as maintenance activities in these
elements can now impact a much larger number of
elements than before.
The Dependency–EC analysis showed that, like
the AC metric, the efferent coupling metric has also
changed only in few elements along the versions.
There were no variations in evolutions 1–2, 3–4 and
5–6. The highest growth was again observed in
evolution 4–5:
PhotoController (from 3 to 6).
The decrease behavior happened only in evolution
6–7 where the class
AbstractController has
decreased its afferent coupling value from 4 to 3 (see
Figure 4.f).
The following interesting points were observed
in the study:
The system elements increased significantly
all over the board in number of lines, but their
complexity increased only in some instances;
When compared to size, afferent and efferent
coupling changes sporadically, however it
almost always increases when it does so. This
means that the system is getting more and
more tangled along its evolution;
Some elements appeared recurrently in the
study, pointing out the hot spots of the system
with respect to evolution.
ON THE USE OF SOFTWARE VISUALIZATION TO ANALYZE SOFTWARE EVOLUTION - An Interactive
Differential Approach
21
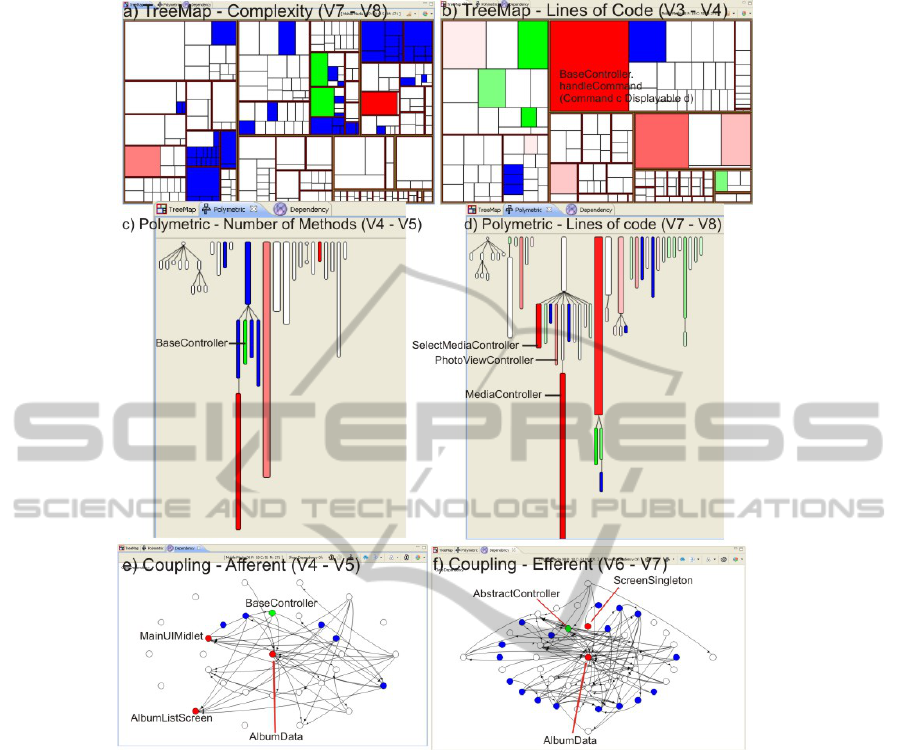
Figure 4: Six snapshots of Mobile Media evolution analysis.
All this information was gathered rather
quickly and in most part did not require any
source code inspection at all.
5 RELATED WORK
The recognition that the use of software
visualization can help software evolution is not new.
During the recent years, a growing body of relevant
work is being developed in this area. Lanza (2001)
proposed an Evolution Matrix to visualize the
software evolution. He used an astronomy metaphor
to analyze some aspects of the evolution of the
classes. D’Ambros et al. (2009) proposed Evolution
Radar, a visualization-based approach that integrates
both file-level and module-level logical coupling
information.
Ripley, Sarma and van der Hoek (2007)
proposed a visualization approach for software
project awareness and evolution. Their approach
presents an overview of the development activities
of the entire team, providing insight into the
evolution of the project based on SCM information.
On same token, the Evolution Storyboards (Beyer
and Hassan, 2006) is an animated visualization of
software history that assists developers in spotting
artifacts that are becoming more or less dependent
on others. It tries to explain decay symptoms,
highlighting refactoring candidates and spotting
good structure.
A system for graph-based visualization of the
evolution of software was proposed by Collberg et
al. (2003). This system visualizes the evolution of
software using a novel graph drawing technique for
visualizing large structures with a temporal
component. Vonea and Telea developed an open
framework for CVS repository querying, analysis
ICEIS 2011 - 13th International Conference on Enterprise Information Systems
22

and visualization (2006b). This multi-perspective
tool is an n-snapshot matrix that shows software
evolution. Each column of the matrix shows the
evolution of one metric.
Gonzalez, Theron, Telea, and Garcia (2009)
proposed an approach that presents a four-view
design visualization combined with metrics-and-
structure data for software evolution analysis. The
four views focus on different tasks and use-cases,
showing: an overview of the project commits
structure and related metrics (timeline view); a
comparison of package or class hierarchy structures
evolving over time (structure evolution view); a
trend analysis of metrics (metric view); and a
detailed code inspection (visualization of the indirect
class coupling integrating source code viewing).
Wu, Holt and Hassan (2004) used spectrographs
to explore software evolution. The evolution
spectrograph combines time, spectrum and property
measurement coded in colors to characterize
software evolution. The coloring technique used is
aimed to easily distinguish patterns in the
evolutionary data.
Considering that the evolution data is multi-
dimensional, some authors propose the use of
animated visualization. The work of Langelier,
Sahraoui and Poulin (2008) is an example of this.
They proposed an approach that uses animated
visualization to explore the evolution of software
quality.
Most of the approaches discussed in this section
analyze high level information based on commits on
the SCM. Our approach differs from the others
because it represent the evolution of metrics directly
extracted from the source code, using different
perspectives, like structure, inheritance and
dependency, to present the software through cross
referenced views focused on its basic elements
(methods, classes and packages). With them, one
can analyze information like the basic elements’
complexity, size and coupling evolution using an
interactive differential approach.
6 FINAL REMARKS
This paper presented a highly interactive differential
approach for visualizing software evolution using
SourceMiner, a multi-perspective software
visualization environment. Three of the
SourceMiner views, one for each perspective, were
augmented to deal with software evolution.
The paper discussed how to enhance a multiple
view environment with an interactive differential
approach to understand software evolution. It
showed how five different colors and a color
interpolation were used to portray the evolution of
software elements across their different versions and
from different perspectives. It also presented some
strategies to detect code evolution problems and
related issues using this differential approach.
The proposed approach has some limitations. It
currently does not control the elements that have
disappeared from one version to the other. This
requires quite a bit of extra work, as they have to be
discovered and maintained across different versions.
We plan to do that in our next version of the tool.
We believe that this will provide the user with more
accurate information about what happened during
the evolution of a system.
We are extending the system with temporal
views. Contrary to the differential views, they will
show the timeline of a set of metrics of a chosen
software element across all its versions. A parallel
coordinate visual metaphor will be used for that and
the new view will be completely integrated with the
others.
We are also planning to extend the approach
with new information. Firstly, we want to augment
the views with high level information and metadata
from the SCM. Secondly, we want to augment them
with history sensitive metrics (Silva et al., 2010).
We want to investigate how useful those metrics are
to further characterize software evolution.
Lastly, we are planning a series of experimental
studies to further investigate the usefulness of the
approach to identify code smells, refactoring
opportunities, system hot-spots and code decay.
ACKNOWLEDGEMENTS
This work was partially supported by the National
Institute of Science and Technology for Software
Engineering (INES - http://www.ines.org.br/),
funded by CNPq and FACEPE, grants 573964/2008-
4 and APQ-1037-1.03/08.
REFERENCES
Bennett, K. H., and Rajlich, V. T. (2000). Software
maintenance and evolution: a roadmap. In Proc. of the
Conference on The Future of Software Engineering
(ICSE '00). ACM, New York, NY, USA, 73-87.
Beyer, D., Hassan, A. E. (2006). Animated Visualization
of Software History using Evolution Storyboards. In
Proc. of the 13th Working Conference on Reverse
ON THE USE OF SOFTWARE VISUALIZATION TO ANALYZE SOFTWARE EVOLUTION - An Interactive
Differential Approach
23

Engineering. WCRE. IEEE Computer Society,
Washington, DC, 199-210
Carneiro, G. de F., Sant´Anna, C. N., Garcia, A. F.,
Chavez, C. von F. G., and Mendonça, M. G. (2009).
On the Use of Software Visualization to Support
Concern Modularization Analysis. Proc. of the 3rd
Workshop on Assessment of Contemporary
Modularization Techniques, Co-located with
OOPSLA, Florida, USA.
Carneiro, G. de F., Silva, M., Mara, L., Figueiredo, E.,
Sant'Anna, C., Garcia, and A., Mendonça, M. (2010a).
Identifying Code Smells with Multiple Concern
Views. Soft. Eng. Brazilian Symposium, vol., no.,
pp.128-137.
Carneiro, G. de F., Sant´Anna, C., and Mendonça, M.
(2010b). On the Design of a Multi-Perspective
Visualization Environment to Enhance Software
Comprehension Activities. Proc. of the VII Workshop
on Modern Software Maintenance, Co-located with
SBQS.
Collberg, C., Kobourov, S., Nagra, J., Pitts, J., and
Wampler, K. (2003). A system for graph-based
visualization of the evolution of software. In Proc. of
the 2003 ACM Symposium on Software Visualization.
SoftVis '03. ACM, New York, NY, 77-ff
Silva, L.M., Dantas, F., Honorato, G., Garcia, A., Lucena,
C. (2010). Detecting Modularity Flaws of Evolving
Code: What the History Can Reveal? Proc. of the 4
th
Brazilian Symposium Software Components,
Architectures and Reuse (SBCARS).
D'Ambros, M., Lanza, M., and Lungu, M. (2009). Visual-
izing Co-Change Information with the Evolution
Radar. IEEE Trans. Softw. Eng. 35, 5, 720-735.
Diehl, S. (2007). Software Visualization - Visualizing the
Structure, Behavior and Evolution of Software,
Springer Verlag
Eick, S. G., Graves, T. L., Karr, A. F., Marron, J. S., and
Mockus, A. (2001). Does Code Decay? Assessing the
Evidence from Change Management Data. IEEE
Trans. Softw. Eng. 27, 1, 1-12
Erlikh, L. (2000). Leveraging legacy system dollars for e-
business. IEEE IT Pro, pages 17–23
Ferreira de Oliveira, M.C., Levkowitz, H. (2003). From
visual data exploration to visual data mining: a survey.
IEEE Transactions on Visualization and Computer
Graphics, vol.9, no.3, pp. 378- 394
Fjeldstad, R., Hamlen, W. (1983). Application program
maintenance: Report to our respondents. Tutorial on
Software Maintenance, Parikh, G. & Zvegintzov, N.
(Eds.). IEEE Computer Soc. Press. pages 13–27.
Gonzalez, A., Theron, R., Telea, A., and Garcia, F. J.
(2009). Combined visualization of structural and
metric information for software evolution analysis. In
Proc. of the Joint international and Annual ERCIM
Workshops on Principles of Software Evolution
(Iwpse) and Software Evolution (Evol) Workshops.
IWPSE-Evol '09. ACM, New York, NY, 25-30
IEEE Std. 1219: Standard for Software Maintenance. Los
Alamitos CA., USA. IEEE Computer Society Press,
1993.
Johnson, B. Shneiderman, B. (1991). Tree-Maps: a space-
filling approach to the visualization of hierarchical
information structures. In Proc. of the 2nd conference
on Visualization '91, Gregory M. Nielson and Larry
Rosenblum (Eds.), 284-291.
Keim, D. A. (2002). Information visualization and visual
data mining. IEEE Transactions on Visualization and
Computer Graphics, 7(1):100–107
Koschke, R. (2003). Software visualization in software
maintenance, reverse engineering, and re-engineering:
a research survey. Journal of Software Maintenance
15, 2, 87-109
Langelier, G., Sahraoui, H., and Poulin, P. (2008).
Exploring the evolution of software quality with
animated visualization. In Proc. of the 2008 IEEE
Symposium on Visual Languages and Human-Centric
Computing. VLHCC, Washington, DC, 13-20.
Lanza, M. (2001). The evolution matrix: recovering
software evolution using software visualization
techniques. In Proc. of the 4th international Workshop
on Principles of Software Evolution. IWPSE '01.
ACM, New York, NY, 37-42.
Lanza, M., Ducasse, S. (2003). Polymetric Views - A
Lightweight Visual Approach to Reverse Engineering.
IEEE Trans. Softw. Eng. 29, 9, 782-795
Lanza, M., Marinescu, R., and Ducasse, S. (2005). Object-
Oriented Metrics in Practice
. Springer-Verlag New
York, Inc.
Lehman, M. M. (1980). On Understanding Laws, Evolu-
tion, and Conservation in the Large-Program Life
Cycle. Journal of Systems and Software 1: 213–221.
Mazza, R. (2009). Introduction to Information
Visualization, Springer-Verlag, London
Ratzinger, J., Fischer, M., and Gall, H. (2005). EvoLens:
Lens-view visualizations of evolution data. In Proc. of
the Int. Workshop on Principles of Software Evolution.
IEEE Comp. Soc., 2005, pp. 103–112.
Ripley, R. M., Sarma, A., van der Hoek, A. (2007). A
Visualization for Software Project Awareness and
Evolution. Visualizing Software for Understanding
and Analysis, 2007. VISSOFT 2007. 4th IEEE
International Workshop on , vol., no., pp.137-144, 24-
25 June 2007
Roman, G-C., Cox, K. C. (1992). Program visualization:
the art of mapping programs to pictures. In Proc. of
the 14th ICSE. ACM, New York, NY, USA
Voinea, L. Telea, A. (2006). An open framework for CVS
repository querying, analysis and visualization. In
Proc. of the MSR 2006. ACM, New York, NY, 33-39
Voinea, L., Telea, A. (2006). Multiscale and multivariate
visualizations of software evolution. In Proc. of the
2006 ACM Symposium on Software Visualization.
Brighton, United Kingdom
Wu, J., Holt, R. C., and Hassan, A. E. (2004). Exploring
Software Evolution Using Spectrographs. In Proc. of
the 11th Working Conference on Reverse Engineering.
WCRE. IEEE Computer Society, Washington, DC,
80-89.
ICEIS 2011 - 13th International Conference on Enterprise Information Systems
24
