
DATA MINING ON DENGUE VIRUS DISEASE
Daranee Thitiprayoonwongse
1
, Prapat Suriyaphol
2
and Nuanwan Soonthornphisaj
1
1
Department of Computer Science, Faculty of Science Kasetsart University, Bangkok, Thailand
2
Bioinformatics and Data Management for Research Unit Office for Research and Development
Siriraj Hospital Mahidol University, Bangkok, Thailand
Keywords: Data mining, Decision tree, Dengue virus disease.
Abstract: Dengue infection is an epidemic disease typically found in tropical region. Symptoms of the disease show
rapid and violent for patients in a short time. The World Health Organization (WHO) classifies the dengue
infection as Dengue Fever (DF) and Dengue Hemorrhagic Fever (DHF). Symptoms of DHF are divided into
4 types. The problem might be happen when an expert misdiagnoses dengue infection. For Example, an
expert diagnosed a patient as non dengue or DF even if a patient was a DHF patient. That might be the
cause of dead if patient did not receive treatment. Therefore, we selected data mining approach to solve this
problem. We employed decision tree algorithm to learn from data set in order to create new knowledge.
The first experimental result shows useful knowledge to classify dengue infection levels into 4 groups (DF,
DHF I, DHF II, and DHF III). An average accuracy is 96.50 %. The second experimental result shows the
tree and a set of rules to classify dengue infection levels into 2 groups followed by our assumption. An
accuracy is 96.00 %. Furthermore, we compared our performance in term of false negative values to WHO
and some researchers and found that our research outperforms those criteria, as well.
1 INTRODUCTION
Dengue Fever is an acute viral infection
characterized by fever. It is caused by a bite from
mosquitoes carrying dengue virus. The World
Health Organization (WHO) classifies the dengue
infection as DF and DHF. Symptoms of DF are
rapidly fever, headache, myalgia, loss of appetite
food, vomiting, abdominal pain and
thrombocytopenia. The severity of DHF is divided
into 4 types. First, DHF I is a DF patient who has
fever and hemorrhagic appearance. Second, DHF II
is a DHF I patient who has spontaneous bleeding.
Next, DHF III is a DHF II patient who has sign of
physiological failure such as rapid/weak pulse,
narrow pulse pressure and cold/clammy skin. Lastly,
DHF IV is a DHF III patient who shock and can’t
detect blood pressure or pulse (Faisal, et al, 2010).
The objectives of our research are as following (1).
We would like to know a set of significant attributes
that classify the type of dengue infections (2)
Physician would like to know the criteria or patterns
found in each class. We selected decision tree
learning as an approach to find knowledge in order
to classify type of dengue infection. The total
number of patients is 258 patients from Siriraj
Hospital, Bangkok, Thailand. The data set consists
of 128 DF, 65 DHF I, 52 DHF II and 13 DHF III
(There is no patient who was diagnosed as DHF IV).
We focus on patients whose ages are lower than 15
years old because the infection in children is more
severe than adults. Forty-eight attributes are selected
as a feature set for decision tree learning. These
attributes are divided into 2 groups, which are
categorical attributes and numerical attributes. The
value of categorical attributes represented the
evidence of symptom. Whereas the numerical
attributes are obtained from hematological evidence
such as percentage of hematocrit increase (HCT),
white blood cell (WBC), etc. The original data set is
high dimension and has some missing values.
Therefore, we need to preprocess data to clean up
and clarify some error. We set up 2 experiments.
The objective of the first experiment is to find
knowledge for each type of dengue infection. The
second experiment explores the hypothesis to find
the pattern of severe and non severe dengue patients.
32
Thitiprayoonwongse D., Soonthornphisaj N. and Suriyaphol P..
DATA MINING ON DENGUE VIRUS DISEASE.
DOI: 10.5220/0003422000320041
In Proceedings of the 13th International Conference on Enterprise Information Systems (ICEIS-2011), pages 32-41
ISBN: 978-989-8425-53-9
Copyright
c
2011 SCITEPRESS (Science and Technology Publications, Lda.)

2 CRITERIA OF DENGUE VIRUS
DISEASE
Dengue is the most common virus transmitted by
mosquitoes which causes up to 100 million
infections and 25,000 deaths worldwide each year.
2.1 WHO Criteria
WHO announced a set of criteria for classifying
dengue patients according to DF and DHF (see
Table 1 for details).
However, WHO criteria are not sufficient to
classify the dengue patients. Since they are just a
common criteria for dengue virus disease. We
believe that there are some different clinical
evidence and laboratory results that fit to our
regional disease. There are some researchers work in
this area such as (Tanner, et al, 2008) and (Tarig, et
al., 2010). They tried to find new criteria in order to
classify dengue patients.
2.2 Tanner’s Criteria
(Tanner, et al, 2008) employed decision tree to
classify data into 4 levels which are Probable
dengue, Likely dengue, Likely non-dengue and
Probable non-dengue. Their data set contains 1,200
patients (1,012 patients from the EDEN study and
188 patients from Vietnam). They found 6
significant features which were platelet count (PLT),
white blood cell count (WBC), body temperature
(T), hematocrit (HCT), absolute number of
lymphocytes (Lymphocyte) and absolute number of
neutrophils (Neutrophil). They got 84.7%
correctness.
2.3 Tarig’s Criteria
Research work done by Tarig Faisal (Tarig, et al.,
2010). Showed that, they can predicted the risk of
dengue patients using Self Organizing Map (SOM)
and Multilayer Feed-forward Neural Networks
(MFNN). Nevertheless, their accuracy rate was only
70 %. Their next research was to do data clustering
on patients into 2 groups as low risk and high risk
patients. They classified 195 patients using three
criteria obtained from SOM. There are 3 risk criteria
which were platelet counts (PLT) (less or equal than
40,000 cell per mm
3
, HCT (greater than or equal to
25%) and aspartate aminotransferase (AST) (rose by
fivefold the normal upper limit for AST or alanine
aminotransferase) (ALT) (rose by fivefold, the
normal upper limit for ALT) A high risk patient was
a patient who had at least 2 criteria. A low risk
patient was a patient who had less than 2 criteria.
Their finding supported the criteria of WHO. Lastly,
in June 2010, they classified the risk of dengue
patients using MLP. The accuracy only 75 %.
(Ibrahim et al.,2005) predicted the day of
defervescence of fever (day0). Their data set
consists of 252 dengue patients (4 DF and 248
DHF). They applied Multi-Layer Perceptron (MLP)
and got 90 % correctness.
3 DATA PROCESSING
Data integration is a step that integrated the data
from several sources. In this study, Siriraj Hospital
integrated patient’s data from Srinagarindra Hospital
and Songklanagarind Hospital. Next step is data
cleaning. Sometimes the data sets contained noise
data that results from human error or machine error.
Table 1: WHO criteria (World Health Organization, 1999).
Symptoms Laboratory
DF
Fever with two or more of the following
signs: headache, retro-orbital pain, myalgia,
arthralgia.
Leukopenia occasionally. Thrombocytopenia,
may be present, no evidence of plasma loss.
DHF I
Above signs plus positive tourniquet test Thrombocytopenia < 100,000, HCT rise >=20 %
DHF II
Above signs plus spontaneous bleeding Thrombocytopenia < 100,000, HCT rise >=20 %
DHF III
Above signs plus circulatory failure ( weak
pulse, hypotension, restlessness)
Thrombocytopenia < 100,000, HCT rise >=20 %
DHF IV
Profound shock with undetectable blood
pressure and pulse.
Thrombocytopenia < 100,000, HCT rise >=20 %
DATA MINING ON DENGUE VIRUS DISEASE
33

Table 2: Feature extraction obtained from the treatment period.
Attribute Meaning
Bleeding Evidence of Bleeding (Yes/No)
uri Evidence of upper respiratory infection (Yes/No)
hematocrit _max Maximum value of hematocrit concentration (%)
hematocrit _min Minimum value of hematocrit concentration (%)
AST_max Maximum value of AST (U/L)
AST_min Minimum value of AST (U/L)
AST_avg Average value of AST (U/L)
ALT_max Maximum value of ALT (U/L)
ALT _min Minimum value of ALT (U/L)
ALT _avg Average value of ALT (U/L)
temp_max Maximum temperature of patient (celsius)
temp_min Minimum temperature of patient (celsius)
sbp_minus_dbp_avg Average value of the difference between systolic blood pressure (sbp) and
diastolic blood pressure (dbp) (mm.Hg)
liver_size_average Average size of liver (cm)
hematocrit_max_dx Maximum value of hematocrit concentration (%)
hematocrit_min_dx Minimum value of hematocrit concentration (%)
hematocrit_avg_dx Average value of hematocrit concentration (%)
white_blood_cell_max Maximum number of white blood cells (x1000 cells/µl)
white_blood_cell _min Minimum number of white blood cells (x1000 cells/µl)
white_blood_cell _avg Average number of white blood cells (x1000 cells/µl)
platelet_max Maximum of platelet count (x1000 cells/µl)
platelet_min Minimum of platelet count (x1000 cells/µl)
platelet_avg Average of platelet count (x1000 cells/µl)
protein_avg Average value of protein in liver (g/dl)
albumin_avg Average value of albumin (g/dl)
globurin_avg Average value of globulin (g/dl)
ratio_albumin_avg Average value of ratio between albumin and globulin
quantity_max_found Maximize quantity obtained from tourniquet test.
pulse_pre_min_found The pulse pre min values of a patient.
rash_found Evidence of rash (Yes/No)
itching_found Evidence of itching (Yes/No)
bruising_found Evidence of bruising (Yes/No)
diarrhea_found Evidence of diarrhea (Yes/No)
uri_found Evidence of upper respiratory infection (Yes/No)
abdominal_found Evidence of abdominal (Yes/No)
dyspnea_found Evidence of dyspnea (Yes/No)
ascites_found Evidence of ascites (Yes/No)
jaundice_found Evidence of jaundice (Yes/No)
liver_tenderness Evidence of liver tenderness (Yes/No)
liver_found Evidence of Grown liver (Yes/No)
lymph_found Evidence of lymph node enlargement (Yes/No)
injected_found Evidence of injected conjunctive.
atypical_lymp_found Evidence of atypical lymphocyte.
Effusion_Result Evidence of effusion obtained from X-ray or Ultrasound test (Yes/No)
leakage Evidence of plasma leakage (Yes/No)
ICEIS 2011 - 13th International Conference on Enterprise Information Systems
34

In case of missing value found in the data set, we
will replace them with mean value. Feature selection
is a step to exclude attributes that are not important
to improve the efficiency of experimental result.
Data transformation is a step that transformed some
attribute values in order to qualify the requirement
of the algorithm. Feature extraction is an important
step to pick up suitable attributes or create new
feature set to represent some data pattern.
In this paper, we created new feature set as
shown in Table 2 and transformed some numerical
attributes to categorical attributes. During the
treatment period, we observed the clinical
information and hematological information. These
attributes were extracted, as well.
4 DECISION TREE APPROACH
Decision tree learning is a supervised learning
method. The algorithm constructs a tree which
consists of a set of selected attributes. These
attributes are qualified by the gain ratio since they
can reduce the entropy of the classes. Consider the
entropy equation (see equation 1). For the multiclass
problem, entropy equation is defined as shown in
equation 2. Finally the gain value is calculated in
equation 3.
5 PERFORMANCE
EVALUATION
We use sensitivity, specificity and accuracy as
performance measures.Three equations are defined
as following. Sensitivity (see equation 4) measures
the proportion of the positive class which are
correctly identified (e.g. the percentage of dengue
patients who are correctly identified as having the
condition). Specificity (see equation 5) measures the
proportion of the negative class which are correctly
identified (e.g. the percentage of healthy people who
are correctly identified as not having the condition).
Moreover, we apply accuracy measurement (see
equation 6) in order to evaluate the proportion of the
true results.
(1)
Where S is the training data set, P is the number of positive class and N is the number of negative class.
(2)
Note that S is the training data set, p
i
is a ratio of class i compare with all data, and c is the number of class.
(3)
Note that S is the prior data set before classified by attribute A,
|S
v
| is the number of examples those value of
attribute A are v,
|S
| is the total number of records in the data set.
Sensitivity=
number of True Positives
number of True Positives + number of False Negatives
(4)
Specificity=
number of True Negatives
number of True Negatives+ number of False Positives
(5)
Accuracy=
number of True Positives + number of True Negatives
number of True Positives + True Negatives+ False Positives + False Negatives
(6)
N
P
N
N
P
N
N
P
P
N
P
P
SEntropy
22
loglog)(
i
c
i
i
ppSEntropy
2
1
log)(
)()(),(
)(
v
AValuesv
v
SEntropy
S
S
sEntropyASGain
DATA MINING ON DENGUE VIRUS DISEASE
35

6 EXPERIMENTAL RESULTS
6.1 Data Set
The total number of patients was 258 patients that
obtained from Siriraj Hospital, Bangkok, Thailand.
The data set consists of 128 DF, 65 DHF I, 52 DHF
II and 13 DHF III. These attributes value are clinical
attributes and hematological attributes. There are 48
attributes (26 numerical attributes, 21 categorical
attributes.
Attributes in Table 3 were recorded during the
first visit of each patient. Some attributes were
preprocessed such as Bleeding. The Bleeding value
was determined from any evidences found from
spontaneous petechiae, ecchymosis, gum, nose,
vomiting, stool and others.
During the treatment period, nurses and
physicians followed the symptoms as shown in
Table 4 and 5. Temporal attributes are summarized
in terms of maximum, minimum and average values.
6.2 The First Experiment
In the first experiment, we used decision tree
learning algorithm in order to find the knowledge in
dengue patient’s data set. The data set consists of 4
classes which were DF, DHF I, DHF II and DHF III.
We obtained the decision tree as shown in Figure 1.
We found 7 significant attributes needed to classify
patients. These attributes were leakage - leakage of
plasma in blood, shock – shock evidence found
during treatment period, Bleeding – bleeding
evidence found, lymp_found – lymph node
enlargement found, quantity_max_found –
bleeding spot found under skin, platelet_avg – the
average of platelet count and AST_max – the level
of aspartate aminotransferase.
Table 3: Attributes obtained in the early phrase of treatment.
Attribute Type Meaning
JE vaccine Categorical Received JE vaccine
URI Categorical Upper respiratory tract infection
Bleeding Categorical Bleeding
Table 4: Attributes obtained during the treatment period (numerical values).
Attribute Meaning
hematocrit _max Maximum value of hematocrit concentration
hematocrit _min Minimum value of hematocrit concentration
AST_max Maximum value of AST
AST_min Minimum value of AST
AST_avg Average value of AST
ALT_max Maximum value of ALT
ALT _min Minimum value of ALT
ALT _avg Average value of ALT
temperature_max Maximum of temperature
temperature _min Minimum of temperature
sbp _dbp_avg The difference between sbp and dbp
liver_size_avg Average size of grown liver
hematocrit_max_dx Maximum value of hematocrit concentration
hematocrit_min_dx Minimum value of hematocrit concentration
hematocrit_avg_dx Average value of hematocrit concentration
white_blood_cell_max Maximum of WBC (x1000)
white_blood_cell _min Minimum of WBC (x1000)
white_blood_cell _avg Average of WBC (x1000)
platelet_max Maximum of platelet count (x1000) by machine
platelet_min Minimum of platelet count (x1000) by machine
platelet_avg Average of platelet count (x1000) by machine
protein_avg Average value of protein in liver
albumin_avg Average value of albumin
globurin_avg Average value of globulin
ratio_albumin_avg Average value of ratio between albumin and globulin
quantity_max_found Maximize quantity value of tourniquet test
ICEIS 2011 - 13th International Conference on Enterprise Information Systems
36
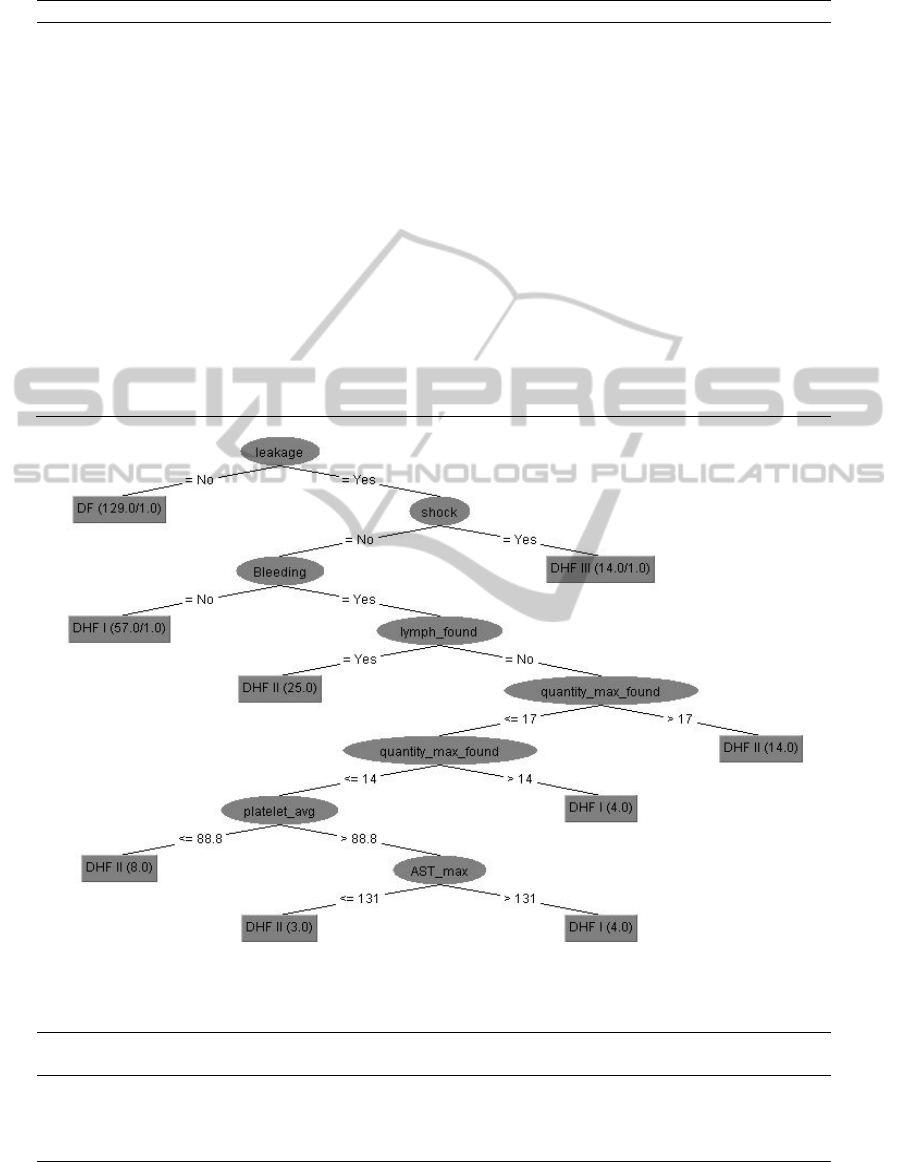
Table 5: Attributes obtained during the treatment period (categorical values).
Attributes Meaning
pulse_pre_min_found Minimum of different pressure value evidence
rash_found Rash on skin evidence
itching_found Itching related to rash evidence
bruising_found Bruising evidence
diarrhea_found Diarrhea evidence
uri_found Upper reparatory infection evidence
abdominal_found Abdominal pain
dyspnea_found Evidence of dyspnea
ascites_found Evidence of ascites
juandice_found Evidence of jaundice
liver_tenderness Evidence of liver tenderness
liver_found Evidence of grown liver
lymph_found Evidence of lymph node enlargement
injected_found Injected conjunctive evidence
atypical_lymp_found Atyp lymphocyte evidence
Effusion_Result Effusion evidence
leakage Evidence of plasma leakage
shock Evidence of shock
dx Class
Figure 1: Decision tree with 4 classes.
Table 6: Performance of the first experiment.
Class Sensitivity(%) Specificity(%) Accuracy(%)
Overall
Accuracy(%)
DF 100.00 99.13 99.59
96.50
DHF I 86.15 96.88 94.16
DHF II 86.54 96.10 94.16
DHF III 100.00 99.57 99.59
DATA MINING ON DENGUE VIRUS DISEASE
37
There was only one rule found for the DF patients. If
there was no leakage evidence found in the patient,
he/she would be diagnose as DF. There were three
rules found for the DHF I patients. If leakage
evidence was found and no shock and no bleeding
evidence were found, those patients would be
diagnose as DHF I. The second rule, if bleeding
evidence was found, no lymph node enlargement
and the tourniquet result were 14-17 bleeding spots
obtained from tourniquet test, the patients would be
diagnose as DHF I. The third rule, if the bleeding
spots were less than 14 and the average number of
platelet count was more than 88.8 cells/µl and the
maximum level of AST was more than 131 U/L,
then the patients would be diagnose as DHF I.
Consider DHF II class; there were four rules. The
patients would be diagnose as DHF II if there were
leakages evidence, no shock, bleeding evidence and
lymph node enlargement evidence. However, if
lymph node enlargement evidence was not found
and if the bleeding spots obtained from tourniquet
test were more than 17, they would be diagnose as
DHF II. The third rule of DHF II was that if the
maximum quantity of bleeding spots obtained from
tourniquet test was less than 14 and the average of
platelet count was less than 88.8 cells/µl. The fourth
rule was that if the average of platelet count was
more than 88.8 cells/µl and the maximum of AST
was less than 131 U/L, they would be diagnose as
DHF II. For DHF III class, there was only one rule
found. The patient would be diagnose as DHF III if
they found leakage evidence and shock evidence.
We found that the decision tree completely
classified patients in DF and DHF III with 100 % on
sensitivity value. For DF class, the specificity
performances of DHF II class were 86.54 %, 96.10
% and 94.16 % measured on sensitivity, specificity
and the average accuracy, respectively. The
specificity and the average accuracy of DHF III
were 99.57 % and 99.59 %, respectively. The last
column shows the overall accuracy of this model
which was 96.5 % (see Table 6 for details)value was
99.13 %. The accuracy of DF class was 99.59 %.
Consider DHF I class, we found that the sensitivity,
specificity, and average accuracy were 86.15 %,
96.88 % and 94.16 %, respectively.
Table 7: Confusion matrix of the first experiment.
a b c d classified
128 0 0 0
a = DF
0 45 6 1
b = DHF II
1 8 56 0
c = DHF I
0 0 0 13
d = DHF III
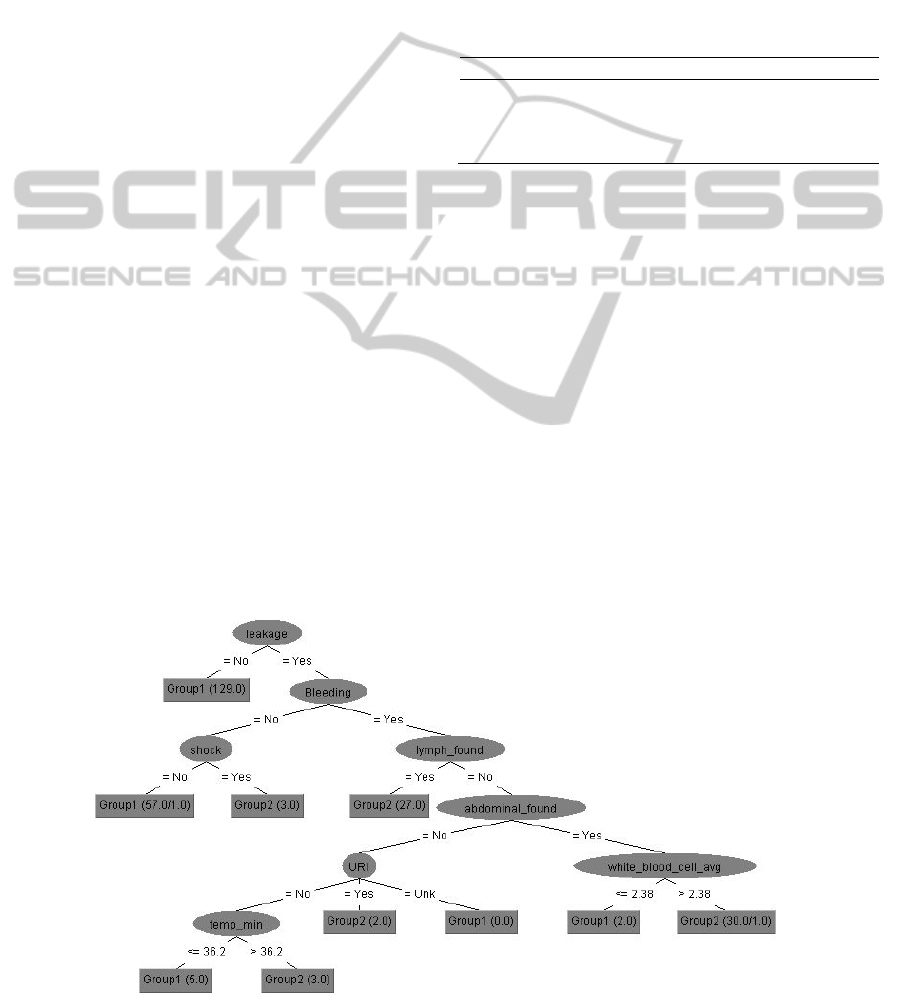
6.3 The Second Experiment
WHO has launched new criteria to classify patients
into 2 classes. Therefore, we set up the second
experiment in order to classify patients into 2
groups. We reassign DF and DHF I as Non Severe
(Group1) and reassign DHF II and DHF III as
Severe (Group2). Consider the decision tree shown
in Fig. 2, we found 8 significant attributes useful for
classifying data. Same attributes as the first
experiment were found in the tree which were
leakage evidence, shock evidence, bleeding evidence
and lymph node enlargement evidence. Different
attributes were abdominal pain, an average of white
blood cell, an upper respiratory infection and a
minimum of patient’s temperature. There were 5
rules for non-severe group and 5 rules for severe
group.
Figure 2: Decision tree with 2 classes.
ICEIS 2011 - 13th International Conference on Enterprise Information Systems
38

Table 8: Confusion matrix of the second experiment.
a b Classified as
185 8
a = Group1
5 60
b = Group2
Table 8 represented the number of correctly
classified patients performed by decision tree. We
found that 185 patients from 193 patients can be
correctly classified as a non-severe group. Sixty
patients from 65 patients were correctly classified as
a severe group.
For non-severe group, we found that the
sensitivity, specificity and the average accuracy
were 95.85 %, 92.31 % and 94.96 %, respectively.
For severe group, we found that the sensitivity,
specificity and average accuracy were 92.31 %,
95.85 % and 94.96 %, respectively. We obtained
96.00 % of the overall accuracy from ROC Area in
the second experimental result (see Table 9 for
details)
7 DISCUSSION
7.1 Experimental Result
(Tanner, et al, 2008), applied decision tree algorithm
to classify the patients into 4 levels of dengue
patients and non-dengue patients (Probable dengue,
Likely dengue, Likely non-dengue and Probable
non-dengue). The accuracy was only 84.70%. Thus
in this paper, we used decision tree algorithm in
order to learn and classify type of the patients (called
“grading”). We would like to classify the patients
into 4 classes. The first experimental result showed
new knowledge in Figure. 1. Our accuracy rate was
96.50 % in the first experiment. For the second
experiment, we would like to classify dengue
infection into 2 groups (severe and non-severe). Our
second experiment was similar to Tarig’s
experiment (Faisal, et al, 2010). They applied Self
Organization Map to characterize the low risk and
high risk dengue patients. They used three features
to cluster dengue patients which were HCT, PLT
and AST/ALT. (Faisal, et al. 2010) classified the
dengue patients using two algorithms of neural
networks. They used three features from the
research. Their best algorithm was MLPSCG. Their
accuracy was 75.00 % whereas our accuracy was
better than their result. Our experimental result
found different feature set compared to those of
Tarig Faisal. We found 8 significant features which
were leakage, bleeding evidence, shock, lymph node
enlargement, abdominal pain, upper respiratory
infection, white blood cell and body temperature.
Our accuracy of the second experiment was 96.00
%.
7.2 Result Validation with other
Criteria
As stated before that WHO has launched a set of
criteria for physician to classify dengue infection
patients. The decision tree classified the patients into
4 classes which were shown in Table 10. The false
negative values were examined for comparison
between WHO criteria and the decision tree. The
false negative of decision tree were 10.77% and
17.31% for DHF I and DHF II. We applied the
WHO criteria to compared with the first
experimental result, the patients (258 patients) were
classified by WHO criteria (see Table 11).
Table 9: Performance of second experiment.
Class
Sensitivity
(%)
Specificity
(%)
Accuracy
(%)
Overall
Accuracy
(%)
Group1 95.85 92.31 94.96
96.00
Group2 92.31 95.85 94.96
Table 10: False Negative value obtained from the first experiment.
Class Label data
Number of patients
classified by Decision tree
False Negative (%)
DF 128 129 0
DHF I 65 53 10.77
DHF II 52 62 17.31
DHF III 13 14 0
DATA MINING ON DENGUE VIRUS DISEASE
39

Table 11: Result of WHO criteria.
Class Label data
Number of patients
classified by WHO criteria
False Negative (%)
DF 128 165 5.47
DHF I 65 39 44.62
DHF II 52 35 40.38
DHF III 13 0 100
DHF IV 0 17 -
Non Dengue 0 2 -
Table 12: Our second experimental result.
Class Label Data
Number of patients
classified by decision
tree
False Negative (%)
Group1 (Low risk) 193 190 4.15
Group2 (High risk) 65 68 7.69
Table 13: Confusion Matrix using Tarig’s criteria.
a b Classified as
173 20
a = Group1
50 15
b = Group2
Table 14: The result of Tarig's criteria.
Class Label data
Number of patients
Classified by Tarig’s
criteria
False Negative (%)
Group1 (Low risk) 193 223 10.36
Group2 (High risk) 65 35 76.92
Table 15: False Negative values.
Class
Number of patients
Decision Tree
classifier
WHO criteria Tarig’s criteria
DF 0 7 -
DHF I 7 29 -
DHF II 9 21 -
DHF III 0 13 -
Group1 8 - 20
Group2 5 - 50
Consider DF class, the false negative value
obtained from WHO was 5.47 % higher than the
decision tree. Moreover the false negative value of
DHF I, DHF II, DHF III were 33.85 %, 23.07 % and
100 % higher than the decision tree. It means that
the criteria from WHO were not sufficient to classify
type of dengue patients. However, our decision tree
provides better performance in classifying patients.
We hope that the knowledge obtained from the
decision tree algorithm may help physicians in
diagnosis process.
From Table 12, we found the value of false nega-
negative were 4.15 % and 7.69 %. After that, we
considered the data using Tarig’s criteria (see Table
13). We found that a false negative value of non-
severe group was 20 and a false negative value of
severe group was 50. We calculated them in term of
percentage in Table 14. We found that the false
negatives were increased when we used Tarig’s
criteria to classify the data.
Using Tarig’s criteria, their result also gave more
false negative value than that of our experimental
result. That means their criteria were not sufficient
in classifying the data because they had much of the
ICEIS 2011 - 13th International Conference on Enterprise Information Systems
40

false negative value.
Table 15 shows the number of false negative
using WHO criteria which were greater than that of
decision tree classifier and the number of false
negative patients using Tarig’s criteria were greater
than that of decision tree classifier. Our experiment
gave better classifying result than WHO criteria and
Tarig’s criteria.
8 CONCLUSIONS
Our research work is in the framework of data
mining. We try to find new knowledge that
contributes to the more accurate classifying results.
We got an accuracy as 96.50% for classify levels
into 4 groups and 96.00 % for classify levels into 2
groups.
We create new feature set that make the learning
algorithm succeeded in classifying task. Finally, we
found some significant features such as lymph node
enlargement and upper respiratory infection that are
useful to differentiate the degree of dengue patients.
ACKNOWLEDGEMENTS
This research is supported by Faculty of Science and
Kasetsart University and Research Development
Institute, Bangkok Thailand.
REFERENCES
Ibrahim, F., Taib, M. N., Wan Abas, W. A. B., Chan, C.
and Sulaiman, S, 2005. A novel dengue fever (DF)
and dengue haemorrhagic fever (DHF) analysis using
artificial neural network (ANN), Comput. Methods
Programs Biomed. 79 pp. 273–281
Tanner, L., Schreiber, M., Low,J.G., Ong, A.,
Tolfvenstam, T., Lai, Y. L., Ng, L. C., Leo, Y. S. Thi
Puong, L., Vasudevan, S. G., Simmons, C. P.,
Hibberd, M. L., and Ooi, E. E, 2008. Decision Tree
Algorithms Predict the Diagnosis and Outcome of
Dengue Fever in the Early Phase of Illness. PLoS
Negl. Trop. Dis., 196.
Faisal, T., Ibrahim, F. and Taib, M. N., 2010. A
noninvasive intelligent approach for predicting the risk
in dengue patients. Expert Systems with Applications,
Volume 37, Issue 3, pp. 2175-2181.
Faisal, T., Taib, M. N. and Ibrahim, F., 2010.
Reexamination of risk criteria in dengue patients using
the self-organizing map. Med. Biol.Eng.Comput.48,
pp. 293-301.
Faisal, T., M. N. Taib, M. N., and F. Ibrahim, F., 2010.
Neural network diagnostic system for dengue patients
risk classification.
World Health Organization: Guideline for Treatment of
Dengue Fever/Dengue Haemorrhagic Fever, 1999.
DATA MINING ON DENGUE VIRUS DISEASE
41
