
NAVIGATION ALONG DATABASE RELATIONSHIPS
An Adaptive Framework for Presenting Database Contents as Object Graphs
Ahmet Atli, Katja Nau
Institute for Applied Computer Science, Karlsruhe Institute of Technology, P.O. box 3640, 76021 Karlsruhe, Germany
Andreas Schmidt
University of Applied Sciences Karlsruhe, P.O. box 2440, 76012 Karlsruhe, Germany
Keywords:
Multimedia and user interfaces, Usability and ergonomics, Searching and browsing.
Abstract:
In this paper, we will present an approach to visualizing arbitrary relational database contents in the form
of object graphs via the World Wide Web. The focus is on the relationships between the datasets rather
than on the data itself. The tool allows definition of different node types representing the datasets and edges
representing the foreign keys and relationship tables in the database schema. Each node type has a label,
and optionally a short description and a user definable image associated with it. The information for these
fields can be extracted 1 : 1 from the corresponding database tables or otherwise be aggregated from different
tables. Along the edges, it is possible to navigate through the content of the database. At any time, exactly
one node represents the center of the object graph. Starting from this graph, edges and other nodes down to a
user-definable depth n are visualized. The depth n may vary along different node and edge types, so that it is
possible to customize the representation of the object graph.
The graphical representation of arbitrary database contents has been of great help to us. In addition to using it
in the initial application area, we intend to use it in some other areas we had left unconsidered. From these,
we can infer a number of suggestions as to how to improve our tool and make it more universal.
1 INTRODUCTION
The starting point of the presented work is the re-
quirement to develop a web portal for the broad pub-
lic within the framework of the DaNa project (DaNa,
2010), funded by the German Federal Ministry of
Education and Research (BMBF). DaNa (Acquisi-
tion, evaluation and public-oriented presentation of
society-relevant data and findings relating to nanoma-
terials) is an umbrella project aiming at collecting and
evaluating scientific results of various projects in the
nanotechnology area along with data from literature
for interested laymen.
Nanotechnology is a key technology of the 21st
century. It makes use of the effects of very small
structures in the range of a few nanometers. A
nanometer is one billionth of a meter or one millionth
of a millimeter and, hence, corresponds roughly to
one fifty-thousandth of the thickness of a human hair.
The success of this exciting technology is based on its
versatility. On the nanolevel, both physical and che-
mical properties of materials change dramatically,
i.e. color, electrical conductivity, and melting point.
Gold, for example, becomes reddish, ceramics even
transparent, and metals become semiconductors. In
addition, nano-objects are much more reactive than
conventional particles. These modified properties
open up new technological possibilities. Therefore,
nanotechnology is an interdisciplinary technology,
which affects a number of new developments in all
consumer applications.
However, many consumers miss reliable and un-
derstandable information on nanomaterials and as-
pects of nanotechnology. In an interdisciplinary ap-
proach, the objective DaNa project team will create
this transparency and present research on nanomate-
rials and their effects on humans and the environment
in a popular way.
372
Atli A., Nau K. and Schmidt A..
NAVIGATION ALONG DATABASE RELATIONSHIPS - An Adaptive Framework for Presenting Database Contents as Object Graphs.
DOI: 10.5220/0003402703720379
In Proceedings of the 7th International Conference on Web Information Systems and Technologies (WEBIST-2011), pages 372-379
ISBN: 978-989-8425-51-5
Copyright
c
2011 SCITEPRESS (Science and Technology Publications, Lda.)

1.1 Motivation
In a first version, the results of the different projects
were condensed textually and were published via a
content management system (CMS) on the website of
the DaNa project.
Information about physico-chemical characteris-
tics, properties, use, occurrence, and production of to-
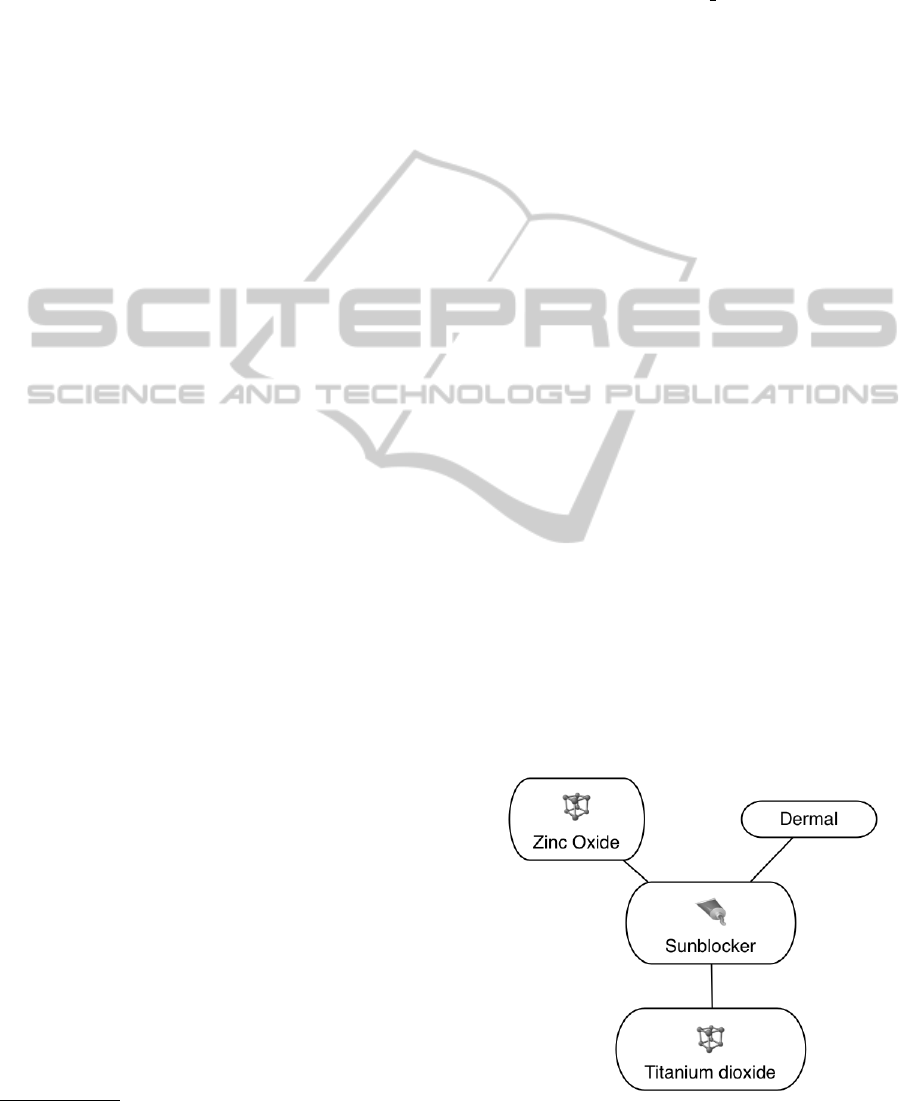
day’s nanomaterials (e. g. titanium dioxide, zinc ox-
ide as UV filters in suncreams or dyes) was compiled
in an overview. In addition, detailed descriptions were
presented of potential ways of exposure, uptake, be-
havior, and risks of nanomaterials to the human body
and to the environment.
It was found, however, that this textual form of
presenting toxicology data is not adequate for the tar-
get group (the broad public), because the public is
more interested in applications of nanomaterials than
in technical and chemical properties: Even more im-
portant are the relationships between nanomaterials in
products and the potential risk of these products to hu-
man health and the environment.
The goal, thus, was to present toxicological infor-
mation in a second version of the web page so that the
relation between application and nanomaterials would
be in the foreground instead of pure datasets them-
selves.
The main contribution of this paper is the de-
sign and development of a graphical navigation ap-
plication for arbitrary relational contents. Although
we found various great visualization applications
(in (Steele and Iliinsky, 2010)) during our investiga-
tion, none of them seems flexible enough to handle
arbitrary data. We will therefore formulate a number
of requirements that such a tool has to fulfill and build
a simple prototype. The outlook later on will discuss a
number of further requirements to make our tool more
adequate for different types of data.
The remaining of the paper is organized as fol-
lows: After collecting all requirements, we assess the
relevant existing tools, placing emphasis on stand-
alone applications and on some frameworks, espe-
cially for the visual part. Lastly, we will introduce
our concept based on our conclusion that there is no
tool available that could completely fulfill our require-
ments. We will divide the problem into the two con-
stitutive problems “mapping” and ”visualization” be-
fore we take a closer look at the configuration space of
our application and at some aspects of performance.
Then, our present prototype is shortly introduced and
we present a summary of our findings that is followed
by a discussion of possible extensions and improve-
ments to our current system.
2 REQUIREMENTS
To provide a broader basis for the application that
we intend to develop, we have chosen not to real-
ize any concrete solution for DaNa application but
to rather build a universal tool for visualization of
database contents on the World Wide Web. The tar-
gets formulated in the following thus are not only re-
lated to the concrete requirements that had been iden-
tified for DaNa application but to the more abstract
and complex level of a tool for visualization of arbi-
trary database contents.
Target Platform. The content must be displayed in-
side an actual web browser
1
without the need to
install additional plugins (Javascript is allowed).
Visualization. At every time an excerpt of the
database should be displayed graphically. The fo-
cus lies on clarification of the relationships be-
tween datasets. Hence datasets are displayed
by nodes, while relationships are represented by
edges between the nodes. Nodes can be of dif-
ferent types (node types), representing different
data types or concepts. Nodes have labels and op-
tional images. Moreover, it must be ensured that
information can be added along the edges (i.e. as
tooltips).
Visualization Range. A limited extract of the
database is always shown as an object net. In
every situation, one node represents the center
of the database extract. Starting from that
point, all nodes reachable within a number of
(configurable) edges should be displayed.
Node Types. Different node types must be definable.
In addition, it must be possible to have differ-
ent node types for the data in the same relational
table, i.e. they must be distinguishable among
the values of an attribute (i.e. normal employee,
boss).
Navigation. By clicking on a concrete node, this
item must be appear in the center of the object
net. The previously centered node is brushed
aside. Hence, by clicking on another than the cen-
tered one of the object-net, you can navigate in the
database.
Internationalization. If supported by the database
schema, the application should be able to handle
different languages (according to a user’s selec-
tion).
1
Firefox 3.5+, Internet Explorer 8, Opera 10.6, Google
Chrome 5.
NAVIGATION ALONG DATABASE RELATIONSHIPS - An Adaptive Framework for Presenting Database Contents as
Object Graphs
373

Support for All Types of Relationship. In addition
to 1 : 1 and 1 : n, also n : m relationships must be
supported.
Aggregation. In the concrete DaNa application, the
data of one node is derived from exactly one
dataset in a concrete table (with the exception of
multilingual text). Since, in general, this is not
necessarily the case, we need a mechanism to ag-
gregate data from different tables to appear in one
node (as label or tooltip).
Context-sensitive Visualisation. Depending on the
distance of the central node, the visual representa-
tion of a node should be configurable. This refers
to, e.g., the number of information to be displayed
as well as to the size of the node.
Search Functionality. In addition to the navigation
functionality, there must be possibilities to search
for concrete nodes. This could be supported, e.g.,
by a free text search that may be based on an au-
tocompletion mechanism.
Callback Functions. In the case of a click (or right
click) on a node/edge, it should be possible to
additionally execute arbitrary definable functions.
This functionality is, for example, useful to show
additional information about the selected node in-
side another window (detail view) or trigger other
actions in general.
3 STATE OF THE ART
In the context of the DaNa project, we started by look-
ing at already existing applications fullfilling our re-
quirements as mentioned in Section 2. First we take
a look at complete applications that we can use and
later, after we realized that none of the examined ap-
plications could fullfill or requirements, we take a
look at already existing libraries we could probably
use when building such a tool by ourselves.
3.1 Complete Applications
We examined a number of applications from which to
of them should shortly be described:
3.1.1 PersonalBrain
PersonalBrain is a Mind mapping software
tool (Willis and Miertschin, 2006), which allows to
organize text, pictures and URLs inside a Mind Map.
It supports 1 : 1, 1 : n and n : m relationships and also
allows a categorisation of the data (via meta-data).
The visualization is done by a special viewer but
export to HTML with Javascript is also possible. A
direct support to visualize data from databases is
not available, so you have to write a mapping to the
internal format (or supported input formats) by your
own. The search functionality supports text search
inside the node labels and the meta-tags.
PersonalBrain does not support multilinguality
and also the visualization scope can only be defined
coarse grained. Another important point that the tool
misses is the support of calling user defined callback
functions.
3.1.2 Mind Manager
MindManager is another mind mapping software.
Like PersonalBrain it has a special viewer which does
the visualization part. Beside this, you can export
a static graphic or animated flash (Adobe Creative
Team, 2008). Text search is available and also a com-
plex search which supports search into meta-data and
the position of a node inside the graph is available.
On the other side it is not possible to connect to
a relational database and also multilinguality is not
supported. n : m relations are also not supported by
this tool.
3.2 Libraries
After finding out that no tool fullfills our requirements
in visualizing arbitrary relational data, we take a look
at a number of libraries for representing graphs. In the
following section, we present processing.js and Info-
Vis.
3.2.1 processing.js
processing.js (Fry, 2007) is a library for creating
animations and graphics. It is based on a own lan-
guage called Processing which can be included inside
a HTML page. The Javascript library processing.js
converts the Processing-code to Javascript and visu-
alize it inside a HTML5 canvas element.
It offers a rich set of functions for drawing geo-
metric elements, building animations and react to user
actions.
On the downside, the library is missing a layout
algorithm for positioning the nodes.
3.2.2 Javascript InfoVis Toolkit – JIT
InfoVis (Belmonte, 2010) developed by Nicolas Bel-
monte is another Javascript library which uses the
HTML5 canvas element. In contrast to processing.js
it already contains a number of predefined elements to
visualize data. Especially it has support to visualize
WEBIST 2011 - 7th International Conference on Web Information Systems and Technologies
374

graphs (i.e. forced-directed placement (Fruchtermann
and Reingold, 1991)). The input to the visualization
core is JSON (JSON, 2010) and it has wide configu-
ration possibilities.
4 CONCEPT
After having studied the present state of the art and
having found out that none of the available applica-
tions or frameworks will fulfill our requirements, we
decided to develop an application by ourselves.
The application is divided into two main parts:
The first one is responsible for extracting the rele-
vant information from the database while the second
one is responsible for the graphical representation in
a browser. The overall architecture is shown in Fig-
ure 1.
R elational Databas e
Object-Net Database Ma pper
Object-Net R epresentation
mapping-
configuration
Mapping-Layer
Database-Layer
visualization-
conguration
Object-Net Vis ua liza tion
Visualization-Layer
Figure 1: General architecture.
The overall application is realized as a classical
multilayer architecture whose core component con-
sists of a mapping layer which, similar to an object-
relational mapping tool (i.e. Hibernate (Bauer and
King, 2006)), creates a map between the relational
database and an object net.
This information is transformed by the layer above
into a suitable graphical representation (an object
net). This upper layer may be responsible for visu-
alization which, however, may as well be performed
by a separate structure.
4.1 Mapper
Wanting to build a tool that can visualize the content
of arbitrary database schemata, we need to configure
which information should be displayed.
We must build a configurable mapper between a
relational database schema and an object representa-
tion consisting of nodes of different types and edges
between the nodes representing the relationships ex-
pressed by foreign keys or relationship tables. This
task is comparable to what is done by an object-
relational mapper, which maps a relational database
to an object-oriented representation with different
classes and relationships between them. A possible
configuration is discussed in Section 4.4. In contrast
to an OR mapper, which normally does a 1 : 1 map-
ping between database column and instance variable
of a class, we only need a short label and a slightly
more informative description (i.e. tooltip). However,
the latter obtain their information from a number of
fields from probably different tables.
For the mapping itself, there are two possibilities
of implementation:
1. Implementation as an interpreter: The mapper
reads the configuration at runtime, extracts the
specified information from the database and for-
wards it to the visual component.
2. Usage of a code generator: A generator tool
reads the configuration at build time (configura-
tion time) and generates the source code for the
concrete mapping. In the case of a compiled lan-
guage like Java, another additional compiler step
is necessary; in case of an interpreted language
like Python or PHP, the generated source can be
used immediately.
4.2 Visualization
As mentioned in the Requirements (Section 2), the
output device should be a common browser, without
additional plugins. Hence, there are two possibilities
for visualization:
1. We can generate the visual representation on the
server side and send it to the browser which is re-
sponsible for the representation. This can be done
with the help of a clickable image map. To gener-
ate the object net, we can use a number of existing
libraries (i.e. Graphviz (GVS, 2010)).
2. Another possibility is to create the visual repre-
sentation on the client side (the browser). A num-
ber of libraries like raphael (Sencha, 2010), pro-
cessings.js
,
Protovis
(ProtoVis, 2010) and
InfoVis
exist, that can represent structural information as
diagrams, especially object nets. Section 3.2 gives
a more detailed description of some of the men-
tioned libraries.
When the client is responsible for the represen-
tation of the object net, the extracted informa-
NAVIGATION ALONG DATABASE RELATIONSHIPS - An Adaptive Framework for Presenting Database Contents as
Object Graphs
375

tion from the mapper must be sent to the client
(the browser). This can be done in the form of
(a)synchronous HTTP-requests. Popular data for-
mats are XML (AJAX (Crane et al., 2005)) or
JSON (JSON, 2010).
4.3 Loading-mechanism
In the browser, small excerpts of the database are dis-
played. Clicking on an object, the object selected
is placed in the center of the displayed area. As a
rule, this requires loading of information about further
nodes and edges. The “visualization range” require-
ment discussed in Section 2 implies that all nodes
that can be reached from a central node be visual-
ized down to a depth n at any time. The respective
depth is determined by the number of relationships to
be passed through starting from the central element.
Since, as is evident, the data needed cannot simply be
loaded at one go, one has to navigate along the ob-
ject net which, depending on the level of embedding,
leads to an exponential increase in individual database
requests. Although the respective amounts of data to
be loaded are relatively small, each request is afflicted
with a constant latency that affects performance.
This performance bottleneck can be avoided
through a number of solutions discussed below.
4.3.1 Client-cache
The browser is required to visualize a certain number
of objects and edges. Clicking on a node, the node
selected will move into the center of the displayed
area. By loading additional nodes that are reachable
from the outer nodes, subsequent clicks for reload-
ing can be neglected and it suffices to display the re-
spective nodes only visually. After the object net has
been built up and visualized in the browser, nodes and
edges that are connected with the outer nodes of the
object net can be reloaded asynchronously by means
of AJAX (Crane et al., 2005). In doing so, the num-
ber of nodes to be reloaded in a user interaction can
be reduced or avoided. An adequate cache (least re-
cently used (LRU), minimal distance strategy) must
be implemented within the client in support of this.
4.3.2 Mapper-cache
Just like the client cache, the server-side mapper that
is in charge of various client requests can profit from
a cache. The cache can be realized as a simple LRU
cache or, in line with the client cache, may be so-
phisticated enough to load datasets in the “vicinity”
of those already loaded.
Any node or edge request that cannot be satisfied
by a new request from the database. As mentioned
above, several requests are as a rule required. In the
case of databases with a higher latency, large numbers
of small requests may be annoying. Different solution
strategies are introduced below:
Complete Loading of Database. Applying this
brute-force method, all the relevant information is
simply loaded from the database into the mapper.
Since all requests can be satisfied from out of
the mapper cache, reloading can be neglected.
This approach is appropriate when the database
content to be visualized can be completely stored
in the RAM.
Generating a Complex SQL Statement. To avoid
multiple sequential reloading, a complex SQL
statement which down to the desired depth n con-
tains all the datasets needed may be generated
from the configuration alternatively. This, how-
ever, requires developing a corresponding ade-
quate SQL generator.
Application of Stored Procedures. Direct reloca-
tion of the loading logics from the mapper to the
database has the advantage that a parameterized
request suffices for the mapper to obtain all
required data from the database. Since the infor-
mation obtained comes from different types of
nodes, a generic data structure must be provided
for the node and edge information.
The advantage of applying stored procedures lies
in an increased performance as compared to the
successive loading through the mapping layer.
This solution has the major drawback that the
stored procedures, unlike DML statements, are
not standardized and that, hence, different imple-
mentations must be realized for different database
systems.
There are two alternatives to implementing stored
procedures:
Stored Procedure as Interpreter. The stored
procedure has access to the mapping configu-
ration. Based on the latter and on information
about the central node, the further nodes and
edges are identified down to the specified
depth n.
Generated Stored Procedure. This approach is
similar to that of generating a complex SQL
statement but instead of generating an SQL
statement one generates the code of a stored
procedure. Unlike the previous interpretative
solution, this stored procedure is optimized to-
ward the concrete data schema and, thus, has a
higher performance.
WEBIST 2011 - 7th International Conference on Web Information Systems and Technologies
376
4.4 Configuration
Configuration serves to define the different node types
and relationships to be displayed. In addition to the
label and an optional brief description, the following
information is specified for each node type:
• The data that the node type is constituted of: The
source may be a single dataset or parts of it but
node instances may as well obtain their data from
several tables.
• The maximum distance between the central node
and the displayed related nodes: This distance can
be defined for each node type individually.
• The types and depths of relationships to be visu-
alized.
• Optionally, an alternative graphical representation
can be determined for each node type or instance.
It is possible to define as a function of the distance
of the node instance from the origin whether there
is only one type of representation for all instances
of a node type or whether each instance has a rep-
resentation of its own.
Country:
table: mondial.country
id: country(code)
label: $(country_name)+' (Area: ' + $(country_area)+' km^2)'
tooltip: "Population: " + $(country_population)
image: http://localhost/mondial/images.pl?type=country
source: select code as country_id,
name as country_name,
population as country_population,
area as country_area
from mondial.country country
where code in (select country
from mondial.encompass
where continent='Europe')
City:
table: mondial.city
id: city(country, province, name)
label: city.name
source: select name
from mondial.city
where population > (select avg(population)
from mondial.country c
where c.code=city.country)
Figure 2: Configuration of node types country and city.
Figure 2 shows an example of configuring the
node types country and city with the properties label,
tooltip, and image specifying the representation in the
object net.
The properties label and tooltip can be built out of
variable contents
2
and strings by means of a simple
syntax.
Image is optional and specifies an alternative
graphical representation. Source specifies the SQL
statement that the node type is based on. Since this
2
The alias names specified in the
select
clause enable
to access the contents (syntax:
$(columnname)
).
statement may be of any complexity, the data may be
composed of several tables.
Figure 3 shows the definition of the relationships
between the two node types. The maximum distance
from the original node (max distance) and the join
condition in SQL syntax are specified. Self-joins in
addition require alias names.
Relation: Country-City (is_in):
max_distance: 1
condition:
mondial.country.code=mondial.city.country and
mondial.country.capital!=mondial.city.name
Relation: Country-City (is_capital_from):
max_distance: 2
condition:
mondial.country.code=mondial.city.country and
mondial.country.capprov=mondial.city.province and
mondial.country.capital=mondial.city.name
Relation: Country-Country(neighbor):
max_distance: 2
condition: (alias: country other_country)
(mondial.other_country.code=mondial.border.country1 and
mondial.country.code=mondial.border.country2)
or
(mondial.other_country.code=mondial.border.country2 and
mondial.country.code=mondial.border.country1)
Figure 3: Configuration of edges between country and city.
5 IMPLEMENTATION
A first version of restricted functionality has been de-
veloped already within the DaNa project. Due to the
limited amount of data, a version loading all data into
the cache of the mapping tier at the beginning was
implemented. The implementation of the object net
in the browser was realized by means of the library
Javascript InfoVis Toolkit (Section 3.2.2). In addi-
tion, the jQuery Library (Bibeault and Katz, 2008) is
used on the client side.
Figure 4 shows a screenshot of the implemented
DaNa scenario.
Figure 4: DaNa Screenshot
NAVIGATION ALONG DATABASE RELATIONSHIPS - An Adaptive Framework for Presenting Database Contents as
Object Graphs
377

The communication between client and mapping
tier is based on asynchronous Javascript requests with
the exchange format being JSON. APIs were devel-
oped for both the client and the mapping tier sides
of communication. These APIs can support functions
for loading of all supported node types, loading of
all “neighbors” of a node, and loading of all nodes
within a defined distance to an original node. Alterna-
tive loading strategies like the ones discussed in Sec-
tion 4.3 are not yet supported by the update version.
6 CONCLUSIONS AND FURTHER
WORK
The present paper discusses a concept for visualiza-
tion of contents from relational databases placing em-
phasis on an adequate solution for representing the
relationships within the database rather than on visu-
alization of the data themselves.
Future concepts will demand that not only nodes
but also edges be placed in the center of the object
net. This requirement evolved from another project
focusing on analyzing correlated project steps.
The next version, moreover, will allow switching
on/off certain node/relationship types interactively by
means of a menu.
A similar suggestion is to formulate conditions
that determine or decide whether relationships are to
be displayed or are not displayed. This allows pro-
viding more relevant information without losing track
on account of the complexity of the object net. As
against the previous update, this version allows visu-
alizing nodes/relationships based on certain data val-
ues instead of on types of nodes/relationships alone.
In addition, the intended implementation of gener-
alizations via relationships is expected to allow com-
bining several relationships and display them by one
edge which will increase clarity within the object net.
Still another option consists in using the tool dis-
cussed for interactive similarity search: Problems can
be approached by developing and using similarity
measures based on the relationship structures of the
different complex data structures that have been con-
sidered.
Looking for a technical solution, one considers
realizing mapping of a relational database onto the
object net by means of an object-relational mapping
tool. In doing so, a broad cross-sectional functional-
ity (configuration of the representation, performance
features such as different caching mechanisms) can
be made use of and the procedure can be reduced
to mapping of the objects and relationships onto the
nodes and edges of the object net. Since the map-
ping information required by the OR mapper contains
only a subset of all configurations to be specified, it
is worth discussing whether it makes sense to divide
the configuration into two subareas (OR mapping in-
formation, special configurations for graphical visu-
alization) or whether configuration should be made a
central process followed by a transformation to the
format of the OR mapper.
Another idea is to differentiate the appearance of
a node depending on the distance to the center node.
Considering the above example of displaying infor-
mation about countries and their neighbors, the coun-
try in the center and the adjoining countries around
should be represented by a graphic, displaying the
contours of the countries. Countries which are still
displayed but are no direct neighbors of the cen-
tral country should only have a small graphic associ-
ated with them that identifies them as being countries
(in contrast to other displayed node types like, e.g.,
cities.).
The Mondial scenario (May, 1999) (countries, re-
gions, cities, rivers, mountains, ...) applied to evalu-
ate the prototype has shown that it may make sense to
control the positioning of the objects: Since Switzer-
land is expected to be positioned south of Germany,
hence is shown to be below Germany on conventional
maps, it was, for instance, found to be confusing to
see the node of Switzerland being displayed directly
above that of Germany.
REFERENCES
Adobe Creative Team (2008). Adobe Flash CS4 Profes-
sional Classroom in a Book. Adobe Press.
Bauer, C. and King, G. (2006). Java Persistence with Hi-
bernate. Manning Publications Co., Greenwich, CT,
USA.
Belmonte, N. (2010). Javascript InfoVis Toolkit.
http://thejit.org/.
Bibeault, B. and Katz, Y. (2008). jQuery in Action. Man-
ning Publications.
Crane, D., Pascarello, E., and James, D. (2005). Ajax in
Action. Manning Publications.
DaNa (2010). DaNa - KnowledgeBase Nanomaterials.
http://www.nanopartikel.info.
Fruchtermann, T. and Reingold, E. (1991). Graph drawing
by force-directed placement. Software: Practice and
Experience, 21:1129–1164.
Fry, B. (2007). Visualizing Data. O’Reilly Media, Se-
bastopol.
GVS (2010). Graphviz - Graph Visualization Software.
http://www.graphviz.org/.
JSON (2010). JSON - Introducing JSON.
http://www.json.org/index.html.
WEBIST 2011 - 7th International Conference on Web Information Systems and Technologies
378

May, W. (1999). Information extraction and integration
with FLORID: The MONDIAL case study. Techni-
cal Report 131, Universit
¨
at Freiburg, Institut f
¨
ur In-
formatik. Available from http://dbis.informatik.uni-
goettingen.de/Mondial.
ProtoVis (2010). Protovis - A graphical toolkit for visual-
ization. http://vis.stanford.edu/protovis.
Sencha (2010). Sencha - Mobile Javascript.
http://www.sencha.com.
Steele, J. and Iliinsky, N. (2010). Beautiful Visualization:
Looking at Data through the Eyes of Experts. O’Reilly
Media, Sebastopol.
Willis, C. L. and Miertschin, S. L. (2006). Mind maps as
active learning tools. J. Comput. Small Coll., 21:266–
272.
NAVIGATION ALONG DATABASE RELATIONSHIPS - An Adaptive Framework for Presenting Database Contents as
Object Graphs
379
