
DYNAMIC RESOURCE ALLOCATION AND ACTIVE PREDICTIVE
MODELS FOR ENTERPRISE APPLICATIONS
M. Al-Ghamdi, A. P. Chester, L. He and S. A. Jarvis
Performance Computing and Visualisation, Department of Computer Science, University of Warwick, Coventry, U.K.
Keywords:
Dynamic resource allocation, Enterprise applications, Switching policies, Workload prediction.
Abstract:
This work is concerned with dynamic resource allocation for multi-tiered, cluster-based web hosting environ-
ments. Dynamic resource allocation is reactive, that is, when overloading occurs in one resource pool, servers
are moved from another (quieter) pool to meet this demand. Switching servers comes with some overhead, so
it is important to weigh up the costs of the switch against possible system gains. In this paper we combine
the reactive behaviour of two well known switching policies – the Proportional Switching Policy (PSP) and
the Bottleneck Aware Switching Policy (BSP) – with the proactive properties of several workload forecasting
models. Seven forecasting models are used, including Last Observation, Simple Algorithm, Sample Moving
Average, Exponential Moving Algorithm, Low Pass Filter and Autoregressive Moving Average. As each of
the forecasting schemes has its own bias, we also develop three meta-forecasting algorithms (the Active Win-
dow Model, the Voting Model and the Selective Model) to ensure consistent and improved results. We show
that request servicing capability can be improved by as much as 40% when the right combination of dynamic
server switching and workload forecasting are used. As important is that we can generate consistently im-
proved results, even when we apply this scheme to real-world, highly-variable workload traces from several
sources.
1 INTRODUCTION
e-Business applications for on-line banking or on-line
retail are typically hosted on Internet hosting plat-
forms. These applications usually employ a multi-
tiered architecture, which provides a clear separation
of roles and allows each tier to be modified or re-
placed independently when needed. Commonly, a
multi-tier architecture consists of three tiers: a client-
facing web tier, where the request is received from
the client and from where the response is returned;
an application tier used for the application logic, and
a back-end data-persistence tier that is usually com-
prised of a relational database management system
(RDBMS).
As the use of enterprise applications becomes
more widespread, so issues concerning infrastructure
performance and dependability become more signif-
icant. Clusters of servers, consisting of multiple ho-
mogeneous or heterogeneous computers, have proven
to be a promising and cost-effective approach to meet-
ing these rapidly expanding needs (Yang and Luo,
2000). Thus, the enterprise applications described in
this work are distributed on high-availability, high-
performance clusters of servers.
In this paper, a typical enterprise system is mod-
elled using a multi-class closed queuing network to
compute the various performance metrics (such a rep-
resentation is common, as there is a limit to the
number of simultaneous customers logged into the
system (Menasc
´
e and Almeida, 2000)). Using this
analytical model it is possible to compute perfor-
mance metrics, identify potential bottlenecks and, im-
portantly, investigate a wide variety of hypothetical
scenarios, without running the actual system. One
should thus envisage such a model running alongside
a real system, where the model can react to param-
eter changes as the application is running (e.g. from
monitoring tools or system logs) and making dynamic
configuration decisions to optimise pre-defined per-
formance metrics (Xue et al., 2008); in this paper
this re-configuration is captured in the switching of
servers from one resource pool (servicing one appli-
cation) to another pool) serving a different applica-
tion.
Most e-Business applications are subject to enor-
mous variations in workload demand (Chester et al.,
2008). System overloading can cause exception-
ally long response times for requests or even er-
rors, caused by the timing out of client requests and
551
Al Ghamdi M., P. Chester A., He L. and A. Jarvis S..
DYNAMIC RESOURCE ALLOCATION AND ACTIVE PREDICTIVE MODELS FOR ENTERPRISE APPLICATIONS.
DOI: 10.5220/0003388705510562
In Proceedings of the 1st International Conference on Cloud Computing and Services Science (CLOSER-2011), pages 551-562
ISBN: 978-989-8425-52-2
Copyright
c
2011 SCITEPRESS (Science and Technology Publications, Lda.)

connections being dropped by the overloaded appli-
cation. At the same time, the throughput of the
system would decrease significantly (Cuomo, 2000).
A classic example of this was when the normally
well-provisioned Amazon.com site suffered a forty-
minute downtime due to an overload during the pop-
ular holiday season in November 2000 (Urgaonkar
et al., 2005). Another example is the failure of the
CNN.com website after the terrorist attacks on the
United States on September 11, 2001 (Faraz and Vi-
jaykumar, 2010).
As a result of these (and other) case studies, and
subsequent research, admission control is applied in
order to deal with system overloading. This scheme
is based on assigning priorities to requests and ensur-
ing that less important requests are rejected when the
system is overloaded (Xue et al., 2008).
It has been shown that assigning a fixed number
of servers to a resource pool is clearly sub-optimal:
in many cases resources lay unused and during peak
demand there are insufficient resources to service all
requests (Chester et al., 2008). Dynamic resource al-
location systems on the other hand have been shown
to improve revenue in such environments by reallo-
cating servers (between resource pools) into a more
beneficial configuration.
Workload forecasting approaches can be divided
into two different categories: quantitative and quali-
tative (Menasc
´
e and Almeida, 2001). The qualitative
approach is a subjective process based on different in-
formation such as expert opinion, historical analogy,
and commercial knowledge. The estimation of future
values based on the existence of historical data, i.e.
that seen in the quantitative approach, is the approach
to forecasting used in this work.
1.1 Paper Contribution and Structure
The contributions of this paper are as follows:
• Through modelling and supporting simulation, we
investigate the combination of two well-known
reactive server switching policies - the propor-
tional switching policy (PSP) and the bottleneck
aware switching policy (BSP) - coupled with the
proactive properties of several workload forecast-
ing models.
• Seven forecasting models are used, including Last
Observation, Simple Algorithm, Sample Moving
Average, Exponential Moving Algorithm, Low
Pass Filter and Autoregressive Moving Average.
As each of the forecasting schemes has its own
bias, we also develop three meta-forecasting al-
gorithms (the Active Window Model, the Voting
Model and the Selective Model) to ensure consis-
tent and improved results.
• We show that request servicing capability can be
improved by as much as 40% when the right
combination of dynamic server switching and
workload forecasting are used. We base our re-
sults on real-world workload traces from several
sources, including from the San Diego Supercom-
puter Centre, from the ClarkNet Internet access
provider for the Metro Baltimore-Washington DC
area and, from the NASA Kennedy Space Center
web-server in Florida.
The remainder of this paper is organised as fol-
lows: Section 2 presents related literature and con-
trasts this with our own work; the modelling of multi-
tiered Internet services and their performance, includ-
ing associated revenue functions, are described in sec-
tion 3; in section 4 we present bottleneck and admis-
sion control systems to enhance the overall system’s
revenue; the dynamic resource allocation policies ap-
plied to our system are found in section 5; in section 6
the workload used in our experimentation, and the as-
sociated predictive algorithms, are introduced; the ex-
perimental setup and results can be found in sections
7 and 8 respectively; the paper concludes in section 9.
2 RELATED WORK
An example of using queueing networks for multi-tier
Internet service modelling can be found in (Zalewski
and Ratkowski, 2006). This work discusses how it is
possible to predict the performance of a multi-tier sys-
tem with a satisfactory accuracy, which itself is im-
portant in the design of most e-business applications.
The queuing network in (Zalewski and Ratkowski,
2006) is solved using the Mean Value Analysis
(MVA) algorithm developed by (Reiser and Laven-
berg, 1980). There are however alternative algorithms
used for analysing queuing networks, including the
Approximate Mean Value Analysis (AMVA) algo-
rithm, where the accuracy and time to solve the model
can be traded (e.g. (Hsieh and Lam, 1988)).
(Liu et al., 2001) focusses on maximising profit of
best-effort requests when combined with requests re-
quiring a specific quality of service (QoS) in a web
farm; in his work it is assumed that arrival rates of re-
quests are static; our work considers dynamic arrival
rates based on real-world data.
The work in (Cherkasova and Phaal, 2002) in-
troduced an approach called Session-based Admis-
sion Control (SBAC) in order to prevent a web server
from becoming overloaded and to ensure that longer
CLOSER 2011 - International Conference on Cloud Computing and Services Science
552

sessions can be completed in commercial web sites.
We also apply a simple admission control policy in
this research. The policy used here is quite differ-
ent from that found in (Federgruen and Groenevelt,
1986), where an algorithmic approach is used to opti-
mise a resource allocation problem where resources
are given in discrete units; it differs too from the
graph-theoretic approach for solving a resource al-
location optimisation problem, (see (Tantawi et al.,
1988)).
A number of researchers have studied bottleneck
identification (e.g. (Litoiu, 2007)) for multi-class
closed product-form queueing networks where there
is no limit to growth. We employ the work in (Casale
and Serazzi, 2004) and (Xue et al., 2008) in collabo-
ration with HP Labs, IBM and the National Business
to Business Centre, where convex polytopes are used
for bottleneck identification.
The proportional- and bottleneck-aware- switch-
ing policies are subject to analysis in our previous
work (Xue et al., 2008). The research presented here
is different from that found in (Xue et al., 2008) as (i)
it employs seven model-based workload prediction al-
gorithms and extends the infrastructure to process and
respond to this data, (ii) three meta-forecasting algo-
rithms are introduced, based on the observation that
one predictor alone is potentially sub-optimal, (iii) the
test data (the real-world Internet traces) are consid-
erably larger that those previously explored and are
taken from multiple sources.
The workload itself can be characterised at four
different levels: the business layer, the session
layer, the function layer, and the HTTP-request layer
(Menasc
´
e, 2003). Here the real-world Internet work-
load is characterised at the second of these levels,
where the set of requests issued from different users
are clustered periodically (see (Arlitt and Williamson,
1996)). Two well-known methods (server-side and
client-side) are used for data collection in web ana-
lytics (Mahanti et al., 2009). In this work we collect
data directly from the web server log files, where all
transactions and requests to the web site are stored
and undergo systematic analysis.
The work in (Gilly et al., 2004) applies several
predictive techniques to adaptive, web-cluster switch-
ing algorithms. There are two main differences be-
tween their work and ours. First, the system model
is itself quite different; we model the system as two
multi-tiered applications running on two pools, where
servers are moved from another (quieter) pool to deal
with overloading. (Gilly et al., 2004) on the other
hand use a model that consists of a set of servers with
a switch that allocates the incoming request to one of
the servers in the web cluster within a 2-tiered archi-
tecture. Secondly, the system monitoring processes
are also different; in our research we use fixed-time
intervals (see the Active Window Model later in the
paper); (Gilly et al., 2004) monitor their system using
non-fixed intervals (Adaptive Time Slot Scheduling)
based on the system’s request arrival rate.
Various regression methods, nonlinear methods,
moving average, and exponential smoothing algo-
rithms have been used for workload prediction in Web
services environments, (see (Menasc
´
e and Almeida,
2001)). (Keung et al., 2003) used several of the pre-
dictors found here (the Last Observation, Sample Av-
erage, Low Pass Filter, and the ARIMA model) to
predict the behaviour of data-exchange in the Globus
Grid middleware MDS. Running Average, Single
Last Observation, and Low Pass Filter were applied
in (Dushay et al., 1999) for optimising the choice
of indexers made by query mediators (QMs) (reduc-
ing the QM wait time and thus the user wait time
for search results from a distributed digital library).
This said, none of these predictive methods have
previously been employed alongside reactive server
switching policies; thus this work demonstrates a
number of new results in this area.
3 MODELLING OF
MULTI-TIERED INTERNET
SERVICES
A description of the system model which has been
used in this work, together with the associated rev-
enue function, are presented. The notation used in
this paper is summarised in table 1.
3.1 The System Model
We use a multi-class closed queueing network to rep-
resent our system of interest, where C, WS, AS, and
DS represent the Client, Web Server, Application
Server, and Database Server respectively. The appli-
cation is modelled using both -/M/1 first-come-first-
served and -/M/m- first-come-first-served in each sta-
tion, and it is assumed that servers are clustered at
each tier.
Mean value analysis (MVA) (Reiser and Laven-
berg, 1980), based on Little’s law (Little, 1961) and
the Arrival Theorem (Rolia et al., 2004), is applied
to solve the closed queueing network model. The
simplicity of MVA (in contrast with convolution al-
gorithms (Cavendish et al., 2010)) and the accuracy
of the results (Xue et al., 2008) are the main reasons
for using MVA in this work.
DYNAMIC RESOURCE ALLOCATION AND ACTIVE PREDICTIVE MODELS FOR ENTERPRISE APPLICATIONS
553

Figure 1: A model of a typical configuration of a cluster-
based multi-tiered Internet service.
Table 1: Notation used in this paper.
Symbol Description
S
ir
Service time of job class-r at station i
v
ir
Visiting ratio of job class-r at station i
N Number of service stations in QN
K Number of jobs in QN
R Number of job classes in QN
K
ir
Number of class-r jobs at station i
m
i
Number of servers at station i
φ
r
Revenue of each class-r job
π
i
Marginal probability at centre i
T System response time
D
r
Deadline for class-r jobs
E
r
Exit time for class-r jobs
P
r
Probability that class-r job remains
X
r
Class-r throughput before switching
X
0
r
Class-r throughput after switching
U
i
Utilisation at station i
t
s
Server switching time
t
d
Switching decision interval
In a multi-class closed queuing network S
ir
repre-
sents the service time, which is defined as the average
time spent by a class-r job during a single visit to sta-
tion i; v
ir
represents the visiting ratio of class-r jobs
at station i.
(Litoiu, 2007) defines the service demand D
ir
as
the sum of the service times at a resource over all vis-
its to that resource during the execution of a transac-
tion or request, thus D
ir
= S
ir
• v
ir
. The total popula-
tion of the network (K) is the total population at each
class-r.
The reminder of the performance parameters used
in this work include: the mean system response time
T
i
(k), the throughput of class-r jobs X
r
; the mean
queue length K
ir
, and the utilisation per-class station
U
ir
(k). These terms are all described in detail in (Xue
et al., 2008).
3.2 Revenue Functions
An Internet hosting centre supports many multi-tier
applications for its clients, each of which will have
separate service level agreements (SLAs). The SLA
defines the level of service agreed between the client
and the hosting centre and may include performance
and availability targets, with penalties to be paid if
such targets are not met. It is in the interests of the
service hosting centre to ensure that its SLAs are met
so that it can maximise its revenue, whilst ensuring
that its resources are well utilised.
The maximum revenue P(T
r
) is obtained when
the client’s request is met within its deadline D
r
.
While revenue obtained from requests which are not
served within the deadline decreases linearly to zero,
at which point the request exits the system E
r
using
the equation; P(T
r
) = (E
r
- T
r
) / (E
r
- D
r
); where T
r
represents the request’s response time.
With respect to the probability of the request exe-
cution, the lost V
i
loss
and gained V
i
gain
revenue are cal-
culated using the equations 1 and 2 respectively, with
the assumption that the servers are switched from pool
i to pool j.
Note that because the servers are being switched,
they can not be used by both pools i and j during
the switching process and the time that the migra-
tion takes cannot be neglected. The revenue gain from
the switching process is calculated during the switch-
ing decision interval time t
d
as shown in equation 2,
where the switching decision interval is greater than
the switching time.
V
i
loss
=
R
∑
r=1
X
i
r
(k
i
)φ
i
r
P(T
r
)t
d
−
R
∑
r=1
X
i
0
r
(k
i
)φ
i
r
P(T
r
)t
d
(1)
V
j
gain
=
R
∑
r=1
X
j
0
r
(k
j
)φ
j
r
P(T
r
)(t
d
−t
s
) −
R
∑
r=1
X
j
r
(k
j
)φ
j
r
P(T
r
)(t
d
−t
s
)
(2)
After calculating the lost and gained revenue using
equations 1 and 2, servers may be switched between
the pools. In this paper servers are only switched be-
tween the same tiers, and only when the revenue gain
is greater than the revenue lost.
4 BOTTLENECK AND
ADMISSION CONTROL
It is known that the resources that limit the overall
performance of the system are the congested ones,
referred to as the bottlenecks (Casale and Serazzi,
2004). In (Xue et al., 2008) we show that the bot-
tleneck may occur at any tier and may shift between
tiers; we also demonstrate that the system may enter a
state where more than one tier becomes a bottleneck.
The work uses the convex polytopes approach where
the set of potential bottlenecks in a network with one
CLOSER 2011 - International Conference on Cloud Computing and Services Science
554

thousand servers, two different server pools and fifty
customer classes, can be computed in just a few sec-
onds.
Figure 2 shows example bottleneck identification
results using convex polytopes for a chosen server-
pool configuration. We see that when the percentage
of gold class jobs is less than 46.2%, the web server
tier is the bottleneck; when it is between 46.2% and
61.5%, the system enters a crossover region, where
the bottleneck changes; when the percentage of gold
class jobs in pool 1 exceeds 61.5%, the application
server tier becomes the bottleneck. Thus it is clear
that bottleneck identification should be one of the first
steps in any performance study; any system upgrade
which does not remove the bottleneck(s) will have
no impact on the system performance at high loads,
see (Marzolla and Mirandola, 2007).
Admission control offers a possible solution to
the overloading problem which can cause a signif-
icant increase in the response time of requests. A
simple admission control policy has been developed
(see (Xue et al., 2008)) and has been applied in this
research. This policy works by dropping less valuable
requests when the response time exceeds a threshold,
and therefore maintaining the number of concurrent
jobs in the system at an appropriate level.
5 SERVER SWITCHING
POLICIES
In a statically allocated system comprising many
static server pools, a high workload may exceed the
capacity of one of the pools causing a loss in rev-
enue, while lightly loaded pools may be considered
as wasted resources if their utilisation is low. In other
words, when the workload level is high, allocating a
fixed number of servers is insufficient for one applica-
tion, whereas it is a wasted resource for the remaining
applications while the workload is light. Dynamic re-
source allocation has been shown to provide a signif-
icant increase in total revenue through the switching
of available resources in accordance with the changes
in each of the application’s workloads. The policies
which we utilise here are the Proportional Switching
Policy (PSP) and the Bottleneck-aware Switching Pol-
icy (BSP).
5.1 Proportional Switching Policy
The proportional switching policy was first presented
in (Xue et al., 2008) and then subsequently analysed
in (Al-Ghamdi et al., 2010). This policy works by al-
Figure 2: Bottleneck identification using complex poly-
topes.
locating servers at each tier in proportion to the work-
load and subject to an improvement in revenue.
5.2 Bottleneck-aware Switching Policy
There are some factors that may affect the system’s
performance (e.g. workload mix and revenue con-
tribution from individual classes of job in different
pools). The second algorithm which is used in this
work is the bottleneck-aware switching policy, which
overcomes these factors in order to obtain improved
performance results. This is a best-effort algorithm
(Xue et al., 2008).
Both policies operate by re-calculating the dis-
tribution of servers between pools at fixed intervals.
This re-calculation is based on changes in the system
which have occurred in the last time period, thus the
schemes are reactive in that the respond to changes
in the system. The time intervals at which this re-
calculation is done can be varied; however, there is a
cost associated with the switching of servers between
pools (for a period these servers are off-line, persis-
tent data needs to be swapped in and out etc.) and a
balance must be struck to avoid thrashing.
6 THE WORKLOAD AND
PREDICTIVE MODELS
The observation of past values in order to anticipate
future behaviour represents the essence of the fore-
casting process as seen in this paper. Numerous pre-
dictors are discussed and the way in which they are
applied in the context of dynamic resource allocation
is analysed. Our premise is that workload forecast-
ing may assist revenue-generating enterprise systems
which already employ methods of dynamic resource
allocation; however, as with forecasting in other do-
mains, the predictions may in fact be wrong, and this
DYNAMIC RESOURCE ALLOCATION AND ACTIVE PREDICTIVE MODELS FOR ENTERPRISE APPLICATIONS
555
0
100
200
300
400
500
600
700
800
0 15 30 45 60 75
No. of Requests
Time Periods (mins)
Pool1
Pool2
Figure 3: A sample of the total requests for both application
pools.
may result in server reallocation to the detriment of
the service.
As in previous capacity planning work (Menasc
´
e
and Almeida, 2001), we generate a workload model
from the characterisation of real data. The predictive
forecasting that has been used in this work is based on
past values, using several different predictors: Last
Observation (LO), Simple Algorithm (SA), Sample
Moving Average (SMA), Exponential Moving Av-
erage (EMA), Low Pass Filter (LPF), and an Au-
toregressive Integrated Moving Average (ARIMA).
These forecasting algorithms are also combined to-
gether in several different ways in order to gener-
ate meta-forecasting models – Active Window Model
(AWM), Voting Model (VM), and Selective Model
(SM) – which are then combined with the the switch-
ing policies – the proportional switching policy (PSP)
and the bottleneck aware switching policy (BSP). The
forecasting and server switching therefore work in
tandem.
6.1 The Workload
The workload is defined as the set of all inputs the sys-
tem receives from its environment during any given
period of time (Menasc
´
e and Almeida, 2001). In this
study the workloads (e.g. see figure 3) are based
on Internet traces containing two days, two weeks,
and two months worth of HTTP requests. The first
workload is generated from two real-world Internet
traces containing 76,086 requests in total and each of
which contains a days worth of HTTP requests to the
EPA WWW server located at Research Triangle Park,
NC and the SDSC WWW server located at the San
Diego Supercomputer Center in California respec-
tively (LBNL, 2008). The second workload has been
collected from ClarkNet WWW server which is a
full Internet access provider for the Metro Baltimore-
Washington DC area (Arlitt and Williamson, 1996).
This workload contains 3,328,587 requests issued to
the server during the period of two weeks. The
third workload used in this research is obtained
from the NASA Kennedy Space Center web-server
in Florida (Arlitt and Williamson, 1996). This trace
contain 3,461,612 requests spanning two months.
In typical fashion (see also (Menasc
´
e and
Almeida, 2001)) we characterise this workload to
form a workload model, which can then be used as
the input to our system model.
6.2 Predictive Models
The predictive algorithms – Last Observation (LO),
Simple Algorithm (SA), Sample Moving Average
(SMA), Exponential Moving Algorithm (EMA), Low
Pass Filter (LPF), Autoregressive Integrated Mov-
ing Average Model (ARIMA) – are documented
elsewhere (Al-Ghamdi et al., 2010). The meta-
forecasting models, Active Window Model (AWM),
Voting Model (VM), and Selective Model (SM) are
described below:
6.2.1 Active Window Model (AWM)
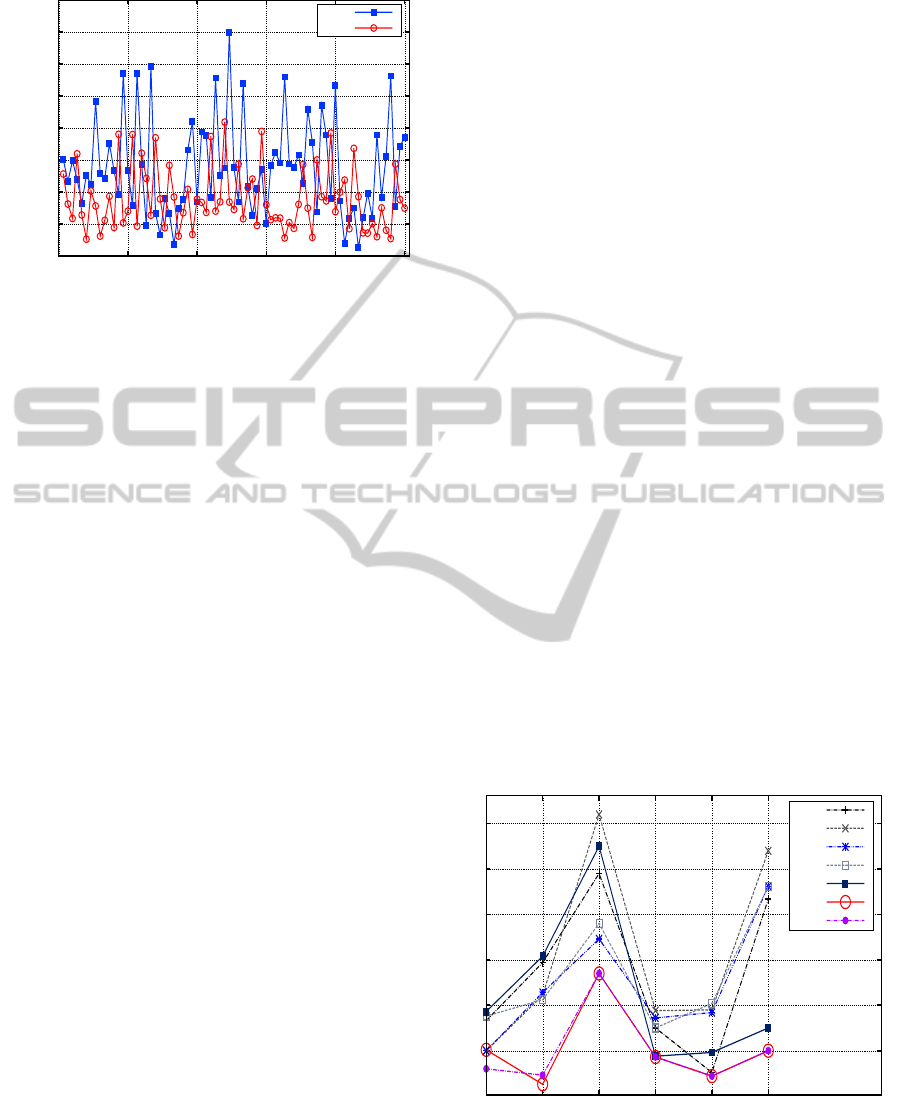
Figure 4 demonstrates the change in revenue that re-
sults from applying each of the seven forecasting pre-
dictors to the NASA workload under the PSP switch-
ing policy. It is clear that while there are similar trends
over time, some predictors produce better results than
others. It is also the case that the results are not con-
sistent, that is, one predictor does not consistently per-
form better than all the others.
Revenue
Increasing Time Periods
LO
SA
SMA
EMA
LPF
AR1
AR2
Figure 4: Revenue samples from applying the seven predic-
tors (NASA workload, PSP switching policy).
In the AWM model, the data points for all pre-
dictors are collected during a fixed period (the Active
CLOSER 2011 - International Conference on Cloud Computing and Services Science
556

Window). The gained revenue from each predictor
is compared with the original revenue with no fore-
casting. The best predictor, i.e. that which results
in the highest revenue for the last period (along with
the switching policy), is then used for the next period.
In this model the active windows have varying dura-
tion: 5m, 10m, 15m, 20m, 25m, 30m, 1h, 2h, 12h,
and 24h; where m and h represent minutes and hours
respectively.
6.2.2 Voting Model (VM)
The voting model (VM) is based on the following sce-
nario (for both switching policies): First, each of the
different predictors are applied to the system, these
predictions are acted upon and the system is reconfig-
ured accordingly (resulting in one system configura-
tion for each of the predictors/server-switching poli-
cies); the system (re-)configuration chosen most often
(i.e. with the most votes) is then applied to the system
proper. This system clearly requires more calculation
within the model, as we are deciding on the final state
of the system as opposed to simply an up-front pre-
diction of workload.
6.2.3 Selective Model (SM)
The selective model works by choosing those predic-
tors that have performed best during the past time pe-
riod, and employing these for the next time period.
SM(B2) calculates the mean of the best two predictors
(as compared to the original system without predic-
tors). Several other selective models are also applied,
including the selective model with the best three or
four predictors (SM(B3)) and (SM(B4)), and the se-
lective model with an average of all the predictors
computed and then applied (SM(AVG)).
In each case, the choice of workload prediction
technique is dynamic; that is, no one prediction tech-
nique is applied throughout the system lifetime. This
aim of such an approach is to avoid bias and to en-
sure that the variability in the workload (which we
inevitably see between the variety of input sources) is
somehow accounted for. Figure 4 highlights the need
for such a scheme; the Low Pass Filter predictor, for
example, can produce the second-best revenue in one
time period, to be followed by the second-worst rev-
enue in the subsequent time period. Workload clearly
impacts on the effectiveness of the prediction and dy-
namic server reallocation combined.
7 EXPERIMENTAL SETUP
We have developed a supporting simulator to allow
us to verify the behaviour of our theoretical models.
We prime the simulator with measured values from an
in-house test platform, or use values from supporting
literature where these are not attainable. We simulate
two multi-tiered applications running on two logical
pools (1 and 2) on a cluster of servers. There are two
different classes of job (gold and silver), which rep-
resent the importance of these jobs. The service time
S
ir
and the visiting ratio v
ir
are both based on realistic
(i.e. sampled) values.
In this work, three different models have been de-
veloped to compute the request servicing capability:
1) the Active Window Model (AWM); 2) the Vot-
ing Model (VM) and; 3) the Selective Model (SM).
In each case, the results show the base-line revenue
when no switching policy is applied (NSP) and also
the case when the switching policy alone (without
forecasting) is applied (NP). These provide good indi-
cators against which the new results can be compared.
8 RESULTS
The results from applying our new predictive models
along with the dynamic server switching policies on
three real-world Internet traces are shown in the tables
2, 3, and 4 and figures 5, 6, and 7, and are described
in the following sections.
8.1 Experiment One
The first experiment is conducted using the first work-
load which has been generated from two real-world
Internet traces to the EPA WWW server located at
Research Triangle Park, NC and the SDSC WWW
server located at the San Diego Supercomputer Cen-
ter, California respectively (LBNL, 2008). The re-
sults from the different predictive models based on
this workload are shown in table 2. This table rep-
resents the gained revenue from applying the seven
predictive algorithms – LO, SA, SMA, EMA, LPF,
AR1, and AR2. In this case one or other of the pre-
dictors are applied consistently throughout the exper-
iment. Figure 5 represents the revenue that has been
achieved using the three meta-forecasting models –
AWM, VM, and SM; this therefore represents a com-
bination of applied predictors, depending on the de-
tails of the scheme.
The two server switching policies used in this
work (PSP and BSP) provide 5.63% and 103.47%
improvement in system revenue compared to the non
switching policy (NSP). The results from table 2 show
a 12.15% improvement in the system revenue when
the AR1 algorithm is applied with PSP, compared to
DYNAMIC RESOURCE ALLOCATION AND ACTIVE PREDICTIVE MODELS FOR ENTERPRISE APPLICATIONS
557

Table 2: Revenue gains for switching policy and forecasting combinations under the first workload.
PSP + Predictive Algorithm
Policy NSP PSP LO SA SMA EMA LPF AR(1) AR(2)
Total Revenue 614.1 648.7 650 647.9 645.7 677.8 651.3 727.5 660.6
Improvement over PSP (%) - 0 0.2 -0.12 -0.46 4.49 0.4 12.15 1.83
BSP + Predictive Algorithm
Policy NSP BSP LO SA SMA EMA LPF AR(1) AR(2)
Total Revenue 614.1 1249.5 1341.3 1333.7 1333.9 1360.6 1332.8 1346.5 1333.4
Improvement over BSP (%) - 0 7.35 6.74 6.75 8.89 6.67 7.76 6.71
Table 3: Revenue gains for switching policy and forecasting combinations under the second workload.
PSP + Predictive Algorithm
Policy NSP PSP LO SA SMA EMA LPF AR(1) AR(2)
Total Revenue 632.6 810.6 786.1 758.6 803.9 811 816.1 825 820.9
Improvement over PSP (%) - 0 -3.02 -6.41 -0.83 0.05 0.68 1.78 1.27
BSP + Predictive Algorithm
Policy NSP BSP LO SA SMA EMA LPF AR(1) AR(2)
Total Revenue 632.6 2200.1 2273.3 2306.2 2360.3 2309.2 2182.8 2155.5 2279.3
Improvement over BSP (%) - 0 3.33 4.82 7.28 4.96 -0.79 -2.03 3.6
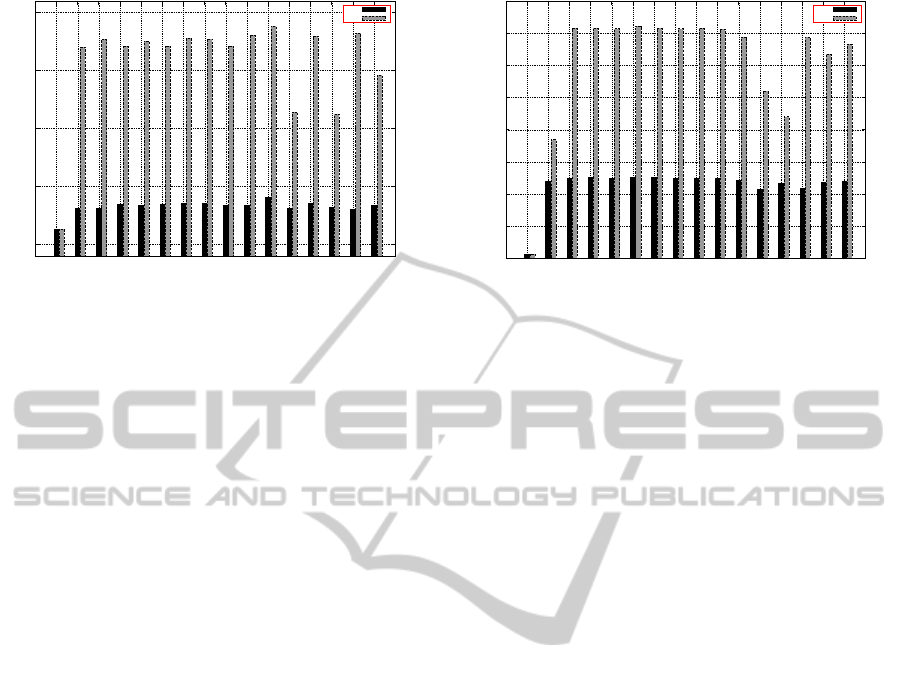
600
700
800
900
1000
1100
1200
1300
1400
1500
NSP
NP
AWM(5m)
AWM(10m)
AWM(15m)
AWM(20m)
AWM(25m)
AWM(30m)
AWM(1h)
AWM(2h)
AWM(12h)
VM
SM(T2)
SM(T3)
SM(T4)
SM(AVG)
Total Revenue (x10^5)
Algorithm
PSP
BSP
Figure 5: Revenue using Active Window Model (AWM),
Voting Model (VM), and Selective Model (SM) under the
first workload.
that from the original PSP without prediction. The re-
mainder of the predictive algorithms also yielded bet-
ter results than the original revenue computed from
the PSP scheme without forecasting, with just two ex-
ceptions – when the predictors SA and SMA are used
the revenue drops by -0.12% and -0.46% respectively.
Table 2 also show that applying the predictive al-
gorithms with BSP provides at least 6.67% improve-
ment in system revenue with LPF and up to 8.89%
when EMA is applied alongside BSP.
The achieved revenue from using the three differ-
ent meta-forecasting models are shown in figure 5.
The Active Window Model (AWM) performs the best
on the given workload and the revenue can be up to
14.06% higher when it is applied with PSP and up
to 36.70% higher with BSP when it is applied every
one and twelve hours respectively. While these re-
sults look encouraging, we sound a note of caution
by highlighting the fact that the improvement drops
by -0.43%, -8.27%, and -22.22% when the AWM is
applied with BSP for every 10m, 20m, and 2h re-
spectively. This method is clearly sensitive to work-
load and its employment and configuration therefore
would need to be subject to realistic trials if it is to be
most effective.
The voting model (VM) is not effective with PSP
(resulting in a 3.45% drop in revenue), yet it does sig-
nify improvements with BSP (resulting in a 9.71%
improvement in revenue) when its performance is
compared to the switching policy with no forecasting.
The Selective Model is able to bring about improve-
ments to both switching policies, revenue is up 2.07%
CLOSER 2011 - International Conference on Cloud Computing and Services Science
558
500
1000
1500
2000
2500
NSP
NP
AWM(5m)
AWM(10m)
AWM(15m)
AWM(20m)
AWM(25m)
AWM(30m)
AWM(1h)
AWM(2h)
AWM(12h)
VM
SM(T2)
SM(T3)
SM(T4)
SM(AVG)
Total Revenue (x10^5)
Algorithm
PSP
BSP
Figure 6: Revenue using Active Window Model (AWM),
Voting Model (VM), and Selective Model (SM) under the
second workload.
using a combination of SM(B4) and PSP, and is up
7.33% using a combination of SM(B2) and BSP.
8.2 Experiment Two
We repeat the experiments with the second work-
load – this contains 3,328,587 requests issued to the
ClarkNet WWW server over the period of two weeks.
The resulting values are shown in table 3 and figure
6. Table 3 shows that the system revenue is improved
by 28.14% and 247.79% using PSP and BSP respec-
tively compared to NSP. The figure also shows a fur-
ther 1.78% and 7.28% improvement when the AR1
and SMA predictors are applied with PSP and BSP
respectively.
AWM provide further improvement (by 12.24%
and 8.32%) when it is applied every twelve hours with
PSP and BSP on the given workload. VM decreases
the performance of the system by -0.58% when it is
used with PSP and up to -25.29% with BSP.
The highest improvements that can be achieved
using SM with the PSP and BSP are 5.82% and
5.50% (when applied as SM(B2) and SM(B4)). There
is again a lack of consistency however as revenue
drops by -1.12% (using SM(B4)) and -26.32% (using
SM(3)) with PSP and BSP respectively.
8.3 Experiment Three
Finally we undertake the same experiments using the
third workload, which contains 3,461,612 requests to
the the NASA Kennedy Space Center web-server in
Florida. Results are shown in table 4 and figure 7. It
is shown that the revenue of the system can be im-
proved as much as 69.19% and 44.14% when BSP
and PSP are applied to the system compared with the
NSP; a further 45.91% and 0.76% improvement can
500
600
700
800
900
1000
1100
1200
1300
NSP
NP
AWM(5m)
AWM(10m)
AWM(15m)
AWM(20m)
AWM(25m)
AWM(30m)
AWM(1h)
AWM(2h)
AWM(12h)
VM
SM(T2)
SM(T3)
SM(T4)
SM(AVG)
Total Revenue (x10^5)
Algorithm
PSP
BSP
Figure 7: Revenue using Active Window Model (AWM),
Voting Model (VM), and Selective Model (SM) under the
third workload.
be achieved when the SA and AR(1) are applied to
the system along with BSP and PSP respectively (see
table 4).
The AWM performs the best compared with the
other two models where the system revenue can be
improved by 4.68% and 40.69% with the PSP and
BSP policies, when AWM is applied every ten and
twenty minutes respectively (the improvement is be-
tween 0.96%-1.63% and 29.33%-39.71% using the
remaining categories of AWM with PSP and BSP re-
spectively).
When VM and SM are applied with PSP, it does
not provide a good improvement in system revenue (-
3.19%) with VM and from 0.08% to -2.98% with SM.
VM however gives a good improvement in system
revenue with BSP where the improvement reaches
15.08%. SM also provide a reasonable improvement
(from 8.21% with SM(B2) and up to 36.56% with
SM(B3)) in system revenue when applied alongside
BSP.
8.4 Analysis
Tables 5, 6 and 7 provide a useful summary of these
findings. Essentially we contrast an enterprise sys-
tem with fixed resources (NSP) with several alter-
natives: a system that employes a dynamic server
switching policy (PSP or BSP); a system that uses
PSP or BSP, and a single forecasting scheme; and fi-
nally a system that employes PSP or BSP, and a meta-
forecasting scheme. There are some interesting ob-
servations from this data
• Dynamic server switching (using PSP or BSP) im-
proves revenue in all cases. The Bottleneck Aware
Switching policy is particularly effective;
• Using a single forecasting scheme in tandem with
DYNAMIC RESOURCE ALLOCATION AND ACTIVE PREDICTIVE MODELS FOR ENTERPRISE APPLICATIONS
559

Table 4: Revenue gains for switching policy and forecasting combinations under the third workload.
PSP + Predictive Algorithm
Policy NSP PSP LO SA SMA EMA LPF AR(1) AR(2)
Total Revenue 513.8 740.6 718.0 703.1 742.2 745.0 730.7 746.2 740.5
Improvement over PSP (%) - 0 -3.05 -5.06 0.22 0.59 -1.34 0.76 -0.01
BSP + Predictive Algorithm
Policy NSP BSP LO SA SMA EMA LPF AR(1) AR(2)
Total Revenue 513.8 869.3 940.0 1268.4 1164.6 978.3 1260.7 1083.5 1206.3
Improvement over BSP (%) - 0 8.13 45.91 33.97 12.54 45.02 24.64 38.77
Table 5: Analysis of the first workload.
Policy NSP PSP Best Single Policy Worst Single Policy Best meta-policy
Total Revenue 614.1 648.7 (AR1) 727.5 (SMA) 645.7 (AWM(1h)) 739.9
Improvement over PSP (%) - 0 12.15 -0.46 14.06
Policy NSP BSP Best Single Policy Worst Single Policy Best meta-policy
Total Revenue 614.1 1249.5 (EMA) 1360 (LPF) 1332.8 (AWM(30m)) 1420.3
Improvement over BSP (%) - 0 8.84 6.67 13.67
Table 6: Analysis of the second workload.
Policy NSP PSP Best Single Policy Worst Single Policy Best meta-policy
Total Revenue 632.6 810.6 (AR1) 825 (SA) 758.6 (AWM(12h)) 909.8
Improvement over PSP (%) - 0 1.78 -6.41 12.24
Policy NSP BSP Best Single Policy Worst Single Policy Best meta-policy
Total Revenue 632.6 2200.1 (SMA) 2360.3 (AR1) 2155.5 (AWM(12h)) 2383.1
Improvement over BSP (%) - 0 7.28 -2.03 8.32
Table 7: Analysis of the third workload.
Policy NSP PSP Best Single Policy Worst Single Policy Best meta-policy
Total Revenue 513.8 740.6 (AR1) 746.2 (SA) 703.1 (AWM(20m)) 752.7
Improvement over PSP (%) - 0 0.76 -5.06 1.63
Policy NSP BSP Best Single Policy Worst Single Policy Best meta-policy
Total Revenue 513.8 869.3 (SA) 1268.4 (LO) 940.0 (AWM(20m)) 1223
Improvement over BSP (%) - 0 45.91 8.13 40.69
PSP or BSP is difficult. First, no one scheme wins
out across all workload (the best single policy in-
cludes AR(1), EMA, SMA, SA over our three
workloads). Second, if the wrong scheme is cho-
sen, this may indeed reduce the overall revenue
generated (it does so in more than half the cases
we test);
• The meta-forecasting schemes always improve
revenue when used in tandem with PSP or BSP. In
the worst case the improved revenue will be negli-
gible (1.63%, workload three, PSP, AWM(20m));
in the best case the revenue may be increased
by around 40% (40.69% workload three, BSP,
AWM(20m));
• The Active Window Model (AWM) proves to
be the best scheme in all cases; on average
this scheme gives an improvement in revenue of
15.1% over all three real-world workloads. The
size of the active window is important and must
therefore be subject to some pre-calculatation
based on sample traces.
CLOSER 2011 - International Conference on Cloud Computing and Services Science
560

9 CONCLUSIONS AND FUTURE
WORK
Through modelling and supporting simulation, we
combine the reactive behaviour of two well known
switching policies – the Proportional Switching Pol-
icy (PSP) and the Bottleneck Aware Switching policy
(BSP) – with the proactive properties of several work-
load forecasting models. Seven forecasting models
are used, including Last Observation, Simple Algo-
rithm, Sample Moving Average, Low Pass Filter and
Autoregressive Moving Average. As each of the fore-
casting schemes has its own bias, we also develop
three meta-forecasting models (the Active Window
Model, the Voting Model and the Selective Model)
to ensure consistent and improved results.
We base our results on real-world workload traces
from several sources, including from the San Diego
Supercomputer Centre, from the ClarkNet Internet
access provider for the Metro Baltimore-Washington
DC area and, from the NASA Kennedy Space Cen-
ter web-server in Florida. For each of the three real-
world workloads, we contrast an enterprise system
with fixed resources (no switching policy) with sev-
eral alternatives: a system that employes a dynamic
server switching policy (PSP or BSP); a system that
uses PSP or BSP, and a single forecasting scheme;
and finally a system that employes PSP or BSP, and
a meta-forecasting scheme.
The results are significant in a number of respects:
(i) Dynamic server switching (using PSP or BSP) im-
proves revenue in all cases, the Bottleneck Aware
Switching policy is particularly effective; (ii) Using a
single forecasting scheme in tandem with PSP or BSP
is difficult as no one scheme wins out across all work-
loads and, if the wrong scheme is chosen, this may
lead to a reduction in the overall revenue generated
by the system; (iii) The meta-forecasting schemes al-
ways improve revenue when used in tandem with PSP
or BSP, in the worst case the improved revenue will
be negligible, in the best case the revenue may be
increased by around 40%; (iv) The Active Window
Model (AWM) proves to be the best scheme in all
cases, on average this scheme gives an improvement
in revenue of 15.1% over all three real-world work-
loads, the size of the active window is important and
must therefore be subject to some pre-calculatation
based on sample traces.
We are currently investigating the effectiveness
of these schemes in extreme (highly bursty) environ-
ments.
REFERENCES
Al-Ghamdi, M., Chester, A. P., and Jarvis, S. A. (2010).
Predictive and dynamic resource allocation for enter-
prise applications. In Proceedings of the 2010 10th
IEEE International Conference on Scalable Comput-
ing and Communications (ScalCom), pages 2776–
2783, Washington, DC, USA. IEEE Computer Soci-
ety.
Arlitt, M. and Williamson, C. (1996). Web server workload
characterization: the search for invariants. SIGMET-
RICS Perform. Eval. Rev., 24(1):126–137.
Casale, G. and Serazzi, G. (2004). Bottlenecks identifi-
cation in multiclass queueing networks using convex
polytopes. In 12th Annual Meeting of the IEEE Int’l
Symposium on Modelling, Analysis, and Simulation of
Comp. and Telecommunication Systems (MASCOTS).
Cavendish, D., Koide, H., Oie, Y., and Gerla, M. (2010).
A mean value analysis approach to transaction perfor-
mance evaluation of multi-server systems. Concurr.
Comput. : Pract. Exper., 22(10):1267–1285.
Cherkasova, L. and Phaal, P. (2002). Session-based ad-
mission control: A mechanism for peak load manage-
ment of commercial web sites. IEEE Trans. Comput.,
51(6):669–685.
Chester, A. P., Xue, J. W. J., He, L., and Jarvis, S. A. (2008).
A system for dynamic server allocation in applica-
tion server clusters. In ISPA ’08: Proceedings of the
2008 IEEE International Symposium on Parallel and
Distributed Processing with Applications, pages 130–
139, Washington, DC, USA. IEEE Computer Society.
Cuomo, G. (2000). IBM WebSphere Application Server
Standard and Advanced Editions; A methodology for
performance tuning. IBM.
Dushay, N., French, J. C., and Lagoze, C. (September
1999). Predicting indexer performance in a distributed
digital library. In Third European Conference on Re-
search and Advanced Technology for Digital Libraries
(ECDL99), Paris, France.
Faraz, A. and Vijaykumar, T. (2010). Joint optimization of
idle and cooling power in data centers while maintain-
ing response time. SIGPLAN Not., 45(3):243–256.
Federgruen, A. and Groenevelt, H. (1986). The greedy pro-
cedure for resource allocation problems: Necessary
and sufficient conditions for optimality. Oper. Res.,
34(6):909–918.
Gilly, K., Alcaraz, S., Juiz, C., and Puigjaner, R. (2004).
Comparison of predictive techniques in cluster-based
network servers with resource allocation. Modeling,
Analysis, and Simulation of Computer Systems, Inter-
national Symposium on, pages 545–552.
Hsieh, C. and Lam, S. (1988). Pam-a noniterative approx-
imate solution method for closed multichain queue-
ing networks. SIGMETRICS Perform. Eval. Rev.,
16(1):261–269.
Keung, H. N. L. C., Dyson, J. R. D., Jarvis, S. A., and Nudd,
G. R. (2003). Predicting the performance of globus
monitoring and discovery service (mds-2) queries. In
Proceedings of the 4th International Workshop on
DYNAMIC RESOURCE ALLOCATION AND ACTIVE PREDICTIVE MODELS FOR ENTERPRISE APPLICATIONS
561

Grid Computing, GRID ’03, pages 176–, Washington,
DC, USA. IEEE Computer Society.
LBNL (2008). Internet Traffic Archive Hosted
at Lawrence Berkeley National Laboratory.
http://ita.ee.lbl.gov/html/traces.html.
Litoiu, M. (2007). A performance analysis method for au-
tonomic computing systems. ACM Transactions on
Autonomous and Adaptive Systems (TAAS), 2(1):3.
Little, J. ((May - Jun., 1961)). A proof for the queuing for-
mula: L= λ w. Operations Research, 9(3):383–387.
Liu, Z., Squillante, M., and Wolf, J. (2001). On maximizing
service-level-agreement profits. In EC ’01: Proceed-
ings of the 3rd ACM conference on Electronic Com-
merce, pages 213–223, New York, NY, USA. ACM.
Mahanti, A., Williamson, C., and Wu, L. (2009). Work-
load characterization of a large systems conference
web server. In Proceedings of the 2009 Seventh An-
nual Communication Networks and Services Research
Conference, pages 55–64, Washington, DC, USA.
IEEE Computer Society.
Marzolla, M. and Mirandola, R. (2007). Performance
prediction of web service workflows. The third In-
ternational Conference on the Quality of Software-
Architectures (QoAS), pages 127–144.
Menasc
´
e, D. (2003). Workload characterization. In IEEE
Internet Computing, pages 89–92, Piscataway, NJ,
USA. IEEE Educational Activities Department.
Menasc
´
e, D. and Almeida, V. (May 7, 2000). Scaling
for E-Business: Technologies, Models, Performance,
and Capacity Planning. Prentice Hall, Upper Saddle
River, NJ.
Menasc
´
e, D. and Almeida, V. (September 21, 2001). Ca-
pacity Planning for Web Services: Metrics, Models,
and Methods. Prentice Hall, Upper Saddle River, NJ.
Reiser, M. and Lavenberg, S. (1980). Mean-value analysis
of closed multichain queuing networks. Journal of the
Association for Computing Machinary, 27(2):313–
322.
Rolia, J., Zhu, X., Arlitt, M., and Andrzejak, A. (2004).
Statistical service assurances for applications in utility
grid environments. Perform. Eval., 58(2+3):319–339.
Tantawi, A., Towsley, G., and Wolf, J. (1988). Optimal al-
location of multiple class resources in computer sys-
tems. SIGMETRICS Perform. Eval. Rev., 16(1):253–
260.
Urgaonkar, B., Shenoy, P., Chandra, A., and Goyal, P.
(2005). Dynamic provisioning of multi-tier internet
applications. In ICAC ’05: Proceedings of the Sec-
ond International Conference on Automatic Comput-
ing, pages 217–228, Washington, DC, USA. IEEE
Computer Society.
Xue, J. W. J., Chester, A. P., He, L., and Jarvis, S. A.
(2008). Dynamic resource allocation in enterprise sys-
tems. In ICPADS ’08: Proceedings of the 2008 14th
IEEE International Conference on Parallel and Dis-
tributed Systems, pages 203–212, Washington, DC,
USA. IEEE Computer Society.
Yang, C. and Luo, M. (2000). Realizing fault resilience
in web-server cluster. In Proceedings of the 2000
ACM/IEEE conference on Supercomputing, Super-
computing ’00, Washington, DC, USA. IEEE Com-
puter Society.
Zalewski, A. and Ratkowski, A. (2006). Evaluation of de-
pendability of multi-tier internet business applications
with queueing networks. In Proceedings of the In-
ternational Conference on Dependability of Computer
Systems, pages 215–222, Washington, DC, USA.
IEEE Computer Society.
CLOSER 2011 - International Conference on Cloud Computing and Services Science
562
