
COMPARATIVE PERFORMANCE ANALYSIS
OF SUPPORT VECTOR MACHINES CLASSIFICATION
APPLIED TO LUNG EMPHYSEMA IN HRCT IMAGES
Verónica Vasconcelos
Instituto Superior de Engenharia, Instituto Politécnico de Coimbra
Rua Pedro Nunes, Quinta da Nora, 3030-199 Coimbra, Portugal
Centro de Instrumentação, Faculdade de Ciências e Tecnologia da Universidade de Coimbra, Coimbra, Portugal
Luís Marques
Instituto Superior de Engenharia, Instituto Politécnico de Coimbra
Rua Pedro Nunes, Quinta da Nora, 3030-199 Coimbra, Portugal
João Barroso
Universidade de Trás-os-Montes e Alto Douro, Vila Real, Portugal
José Silvestre Silva
Departamento de Física, Faculdade de Ciências e Tecnologia da Universidade de Coimbra, Coimbra, Portugal
Centro de Instrumentação, Faculdade de Ciências e Tecnologia da Universidade de Coimbra, Coimbra, Portugal
Keywords: Statistical texture analysis, Support vector machines, Pulmonary emphysema, High-resolution computed
tomography.
Abstract: High-resolution computed tomography (HRCT) became an essential tool in detection, characterization and
follow -up of lung diseases. In this paper we focus on lung emphysema, a long-term and progressive disease
characterized by the destruction of lung tissue. The lung patterns are represented by different features
vectors, extracted from statistical texture analysis methods (spatial gray level dependence, gray level run-
length method and gray level difference method). Support vector machine (SVM) was trained to
discriminate regions of healthy lung tissue from emphysematous regions. The SVM model optimization was
performed in the training dataset through a cross validation methodology, along a grid search. Three usual
kernel functions were tested in each of the features sets. This study highlights the importance of the kernel
choice and parameters tuning to obtain models that allow high level performance of the SVM classifier.
1 INTRODUCTION
HRCT scans are very accurate in diagnosis of lung
diseases. However, the interpretation of HRCT
images, in the presence of patterns associated with
lung diseases is a time-consuming task and requires
experience. The latest generations of CT scanners
allow the acquisition of a large number of images
per patient examination. The use of computerized
image analysis methods can be of great help in
radiologist services improving precision, consistence
and earlier diagnosis.
Emphysema is a chronic lung disease that affects
severely person’s everyday life. The principal factor
risk is cigarette smoking, although genetic
conditions, air pollution, chemical fumes or dust also
can cause emphysema. This disease is defined as “a
permanent, abnormal enlargement of airspaces distal
to the terminal bronchiole, accompanied by the
destruction of the walls of the involved airspaces”
134
Vasconcelos V., Marques L., Barroso J. and Silvestre Silva J..
COMPARATIVE PERFORMANCE ANALYSIS OF SUPPORT VECTOR MACHINES CLASSIFICATION APPLIED TO LUNG EMPHYSEMA IN HRCT
IMAGES.
DOI: 10.5220/0003379301340139
In Proceedings of the International Conference on Imaging Theory and Applications and International Conference on Information Visualization Theory
and Applications (IMAGAPP-2011), pages 134-139
ISBN: 978-989-8425-46-1
Copyright
c
2011 SCITEPRESS (Science and Technology Publications, Lda.)

(Verschakelen, 2007). The diagnosis of emphysema
in HRCT images is based on the detection of regions
of very low attenuation that contrast with healthy
lung. Figure 1 shows examples of a region of a
healthy lung and a region of emphysema.
a) b)
Figure 1: Visual aspects of lung tissue pattern in CT
images: a) Healthy and b) emphysema.
In this work feature extraction is based on
statistical approach to describe lung tissue texture.
Classification of each region of interest (ROI) in
classes of lung pattern disease was performed using
SVM algorithm.
SVM has emerged as an efficient technique for
solving classification problems. SVM has it origin
on statistic learning theory and structural risk
minimization (Vapnick, 1995) (Burges, 1998). A
comparative study was performed by Meyer (Meyer,
2005) between SVM and other popular classifiers.
The results showed that SVM classifiers are among
the best. In Depeursinge et al. (Depeursinge, 2010b)
five common classifiers were compared in their
ability to discriminate six lung tissue patterns in
HRCT. The results of this study showed that SVM
constitutes the best trade-off between the error rate
and the capability of generalization. However
performance of SVM strongly depends on user
kernel choice and parameters selection. In training
phase the SVM model optimization must be
carefully done. No optimal parameter selection can
lead to significant reduction in classification
performance. This fact constitutes the main
limitation of the use of SVM. In this work we
carried out a comparative performance analysis of
different kernel functions in classification ROIs of
normal lung and ROIs of emphysema, under SVM
model parameters variations, using features vectors
extracted from three different methods.
The remainder of the paper is organized as
follows. Section 2 briefly describes the feature
extraction methods. Section 3 presents the theory of
SVM classification algorithm. The dataset used and
optimization methodology of the classifier is
described in section 4. In section 5 results are
presented and discussed and final conclusions are
drawn in section 6.
2 FEATURES EXTRACTION
Texture analysis is fundamental in medical images
interpretation. In this study each texture pattern is
described by their statistical properties, organized in
a n-dimensional feature vector. The next paragraphs
briefly reviews the principles of the methods used to
describe ROIs texture.
In Spatial Gray Level Dependence Method
(SGLDM) the second-order distribution of pixels
gray levels are explored. Each entry of the co-
occurrence matrix C(i,j|d,θ) represents the number
of times a pair of gray level values (i,j) occur at
distance d, in the direction θ. For each distance and
orientation (d, θ) a matrix is computed and a set of
six textural measures was extracted. In Gray Level
Run-Length Method (GLRLM) texture is based on
run-length primitives, which corresponds to a set of
consecutive pixels with the same gray level in a
given direction. These primitives can be
characterized by their length, direction and gray
level. The run-length descriptors are extracted from
the run-length matrix, where each element of
M(a,r|θ) represents the number of runs with pixels
of gray level intensity a and length r along the
orientation θ. The Gray Level Difference Method
(GLDM) is a technique of texture analysis based on
the occurrence of absolute difference in gray levels
of pairs of pixels, in a certain distance and direction.
The result is a histogram H(k|d,θ) which gives the
probability of the occurrence of the difference gray
level value k between two pixels distant (d,θ). The
features extracted from the methods used are listed
in Appendix. A brief description can be found in
(Vasconcelos, 2010).
3 SUPPORT VECTOR MACHINE
CLASSIFICATION
In this section we outline the basic theory of SVM
and their application on lung data classification.
3.1 Linear SVM
Consider the training data represented by the
pairs
,
,=1,…,
є
,
є
+1,−1
,
where the vector x
i
is the texture descriptors
extracted from lung parenchyma regions and y
i
the
class label associated by the radiologist to the
training case i. The label +1 is associated with
emphysema class and -1 with normal class. When
COMPARATIVE PERFORMANCE ANALYSIS OF SUPPORT VECTOR MACHINES CLASSIFICATION APPLIED
TO LUNG EMPHYSEMA IN HRCT IMAGES
135
data is linearly separable exists a vector є
and a scalar b є , that satisfy the conditions
(
.
+
)
−1≥0 ,∀=1…
(1)
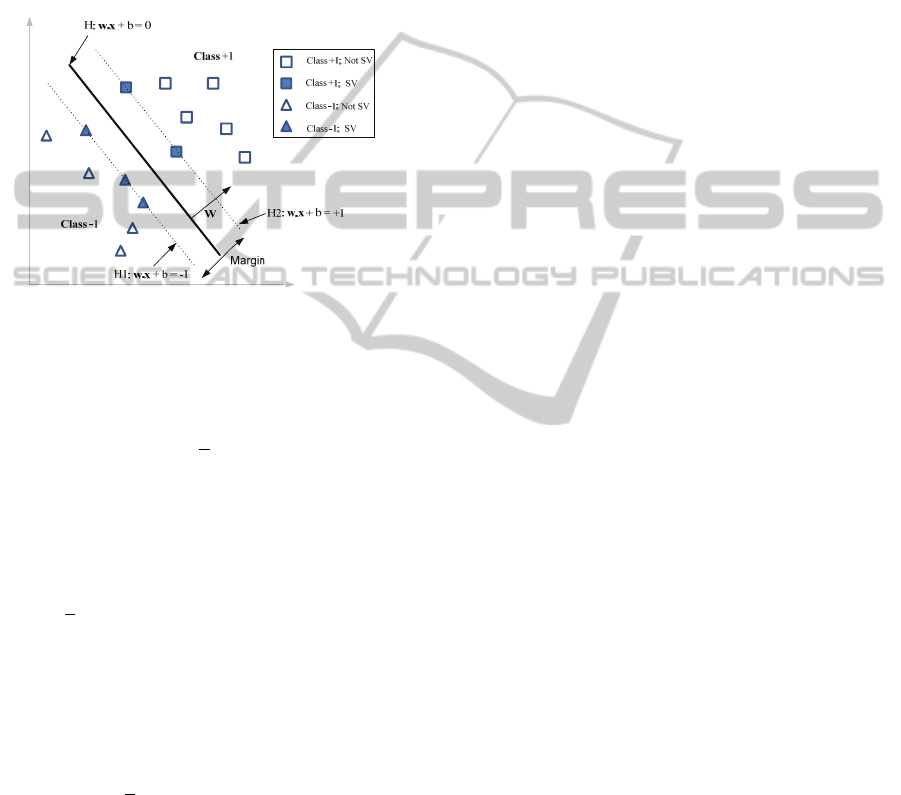
The objective of the SVM classifier is to build an
optimal hyperplane that separates the two classes in
such a way that the distance (also called margin)
from the hyperplane H to the nearest training data
points, in each of the classes, is as large as possible,
see Figure 2.
Figure 2: Optimal separating hyperplane in SVM linearly
separable case.
The distance between the hyperplanes H1 e H2 is
2/||w||. The maximization of this margin leads to
1
2
‖
‖
(2)
subject to the equality constrains of Equation (1). A
convenient way to solve constrained minimization
problems is using a Lagrangian formulation, which
leads to the following optimization problem:
=
1
2
‖
‖
–α
(
(
.
+
)
−1
)
(3)
This equation should be minimized with respect to
primal variables w and b and maximized with
respect to dual variables to obtain the dual
formulation:
L
d
= α
i
n
i=1
1
2
α
i
α
j
y
i
y
j
x
i
.x
j
n
j
=1
n
i=1
(4)
Subject to α
α
≥0, ∀ = 1…
In dual formulation the problem optimization is done
using only the dot product of data training and
respective classes. The training of SVM now
involves the maximization of Equation (4) in respect
to α. The points with α
0 are called Support
Vectors (SVs) and lie on one of the parallel
hyperplane H1 or H2 (Figure 2). In the case of a two
class classification problem, the decision rule
becomes
(
)
=(α
(
.
)
+
)
(5)
This SVM formulation is called hard margin, since
no training errors are allowed. All the training
samples satisfy the inequality
(
)≥1.
3.2 The NonLinear Case
In some cases, a linear hyperplane is unable to
separate the classes appropriately. The SVM strategy
is to map the input data into a high dimensional
feature space by a mapping Ф:
→H, in order to
improve the separability between classes. This
method is known as nonlinear SVM. In the feature
space the decision function becomes:
(
)
=(α
(
,
)
+
) (6)
There are several kernels functions
(
,
)
= Ф
(
)
.Ф
(
)
that can be used to solve
nonlinear problems. Some of the most common
choices are:
• Linear:
(
,
)
= .
(7)
• Gaussian Radial Basis Function (RBF):
(
,
)
=exp
(
−
‖
−
‖
/2
)
(8)
• Polynomial:
(
,
)
=(
(
.
)+
)
(9)
with >0,>0,>0
3.3 The Inseparable Case
When information classes, obtained from CT data
are not totally separable by linear boundaries, the
SVM formulation is called soft margin. In this case
slack variables are introduced to relax the constraints
of Equation (1) that becomes:
(
.
+
)
≥1−
(10)
subject to
≥0,∀=1…
IMAGAPP 2011 - International Conference on Imaging Theory and Applications
136

The optimization problem is formulated in this
situation as
1
2
‖
‖
+C
(11)
The regularization parameter C is a trade-off
between the maximization of de margin (first part of
Equation 11) and minimization of training errors.
The optimization process is similar to the separable
case except the constraints that become 0 ≤ α
≤C.
4 METHODOLOGY
4.1 Dataset and Features Definitions
In this study part of a dataset that is being organized
in collaboration with Radiology Department of
Coimbra University Hospital. The dataset contain
examples of representative patterns associated with
normal and lung disease tissue. The visualization of
CT images, selection and characterization of the
ROIs by radiologists, is done with a user friendly
software, developed by the authors for this propose
(Vasconcelos, 2009). HRCT images were acquired
using multidetector row scanner from General
Electric Healthcare (LightSpeed VCT 64), with a
slice thickness of 1.3 mm. Each image is stored in
512x512 pixels with 16-bit gray level, using
DICOM (Digital Imaging and COmmunications in
Medicine) standard. Each image was displayed using
a lung window with a centre of -700 Hounsfield
Units (HU) and a width of 1500 HU.
From 290 scans of 82 patients (#55 male and #27
female) with an average age of 65±15 years,
radiologists outlined #185 ROIs of emphysema,
including different types and severities of
emphysema and #105 of normal ROIs. From each
scan only one ROI was obtained.
In a previous study we evaluated the importance
of a set of parameters in the classification accuracy
of lung CT images, such the size of the ROIs, the
quantization level and features used to characterize
each texture ROI (Vasconcelos, 2010). These results
are the starting point for some options taken in the
study described in this paper.
Each ROI is characterized as an n-dimensional
feature vector obtained from SGLDM, GLRLM and
GLDM. The four directions {0º, 45º, 90º, 135º} are
considered for the three methods. In GLDM the six
features are obtained over an intersample of 1 to 4
pixels, resulting in a 96-dimensional feature vector.
Using SGLDM the intersample used was 1 and 2
resulting in a set of 48 features. The 44-dimensional
feature vector obtained with GLRLM results from
the eleven features extracted over the four
directions. For standardization reasons all ROIs were
quantified to 32 gray levels, despite the fact the best
performance for GLDM’s features were obtained for
a quantization levels of 64 gray levels (only 0.7%
better). The minimum and maximum HU value is
calculated for all ROIs of the dataset and each ROI
is quantized according to this value. All features
were independently normalized to zero mean and
unit variation.
4.2 Classifier Evaluation
The dataset (#290 ROIs) was divided in train and
test set, 70% for training and 30% for testing. Then,
ROIs of train and test sets are split in smaller ROIs
of 40x40 pixels (#980 in train set and #331 in test
set).
The search for the optimal parameters is carried
out using a grid search methodology. Initially a
coarse search is done. For every point of the search
space a k-fold cross validation (CV) is performed.
The parameters that allow the best mean CV
accuracy were selected and a fine grid search is
carried out around the selected parameters, for
refinement. The final classifier model is built using
all training data and the optimal parameters
previously obtained. Model is evaluated in test
patterns. The accuracy (the number of correctly
classified samples divided by the total samples in the
test set); sensibility (the number of samples correctly
classified as positive divided by the total number of
positive samples in the test set) and specificity (the
number of samples correctly classified as negative
divided by the total number of negative samples in
the test set) are computed.
5 EXPERIMENTS AND RESULTS
The SVM kernel functions tested were linear
(equation 7), RBF (equation 8), and polynomial
(equation 9, considering = 1, = 1 and = 3).
The classification was performed using SVM
classifier available in bioinformatics toolbox of
MATLAB (MATLAB, 2009).
The parameter adjustment methodology was
performed for the regularization parameter C for
linear and polynomial kernels and (C, σ) for RBF
kernel. First, we evaluate the parameters values
using a coarse grid in C=2
-5
, 2
-4.5
, 2
15
and σ=2
-2
, 2
-
1.5
,…, 2
7
and then focus the search in a finer grid. If
COMPARATIVE PERFORMANCE ANALYSIS OF SUPPORT VECTOR MACHINES CLASSIFICATION APPLIED
TO LUNG EMPHYSEMA IN HRCT IMAGES
137
the pair (2
c
, 2
s
) generates the lowest cross validation
error, a finer search is performed around them with a
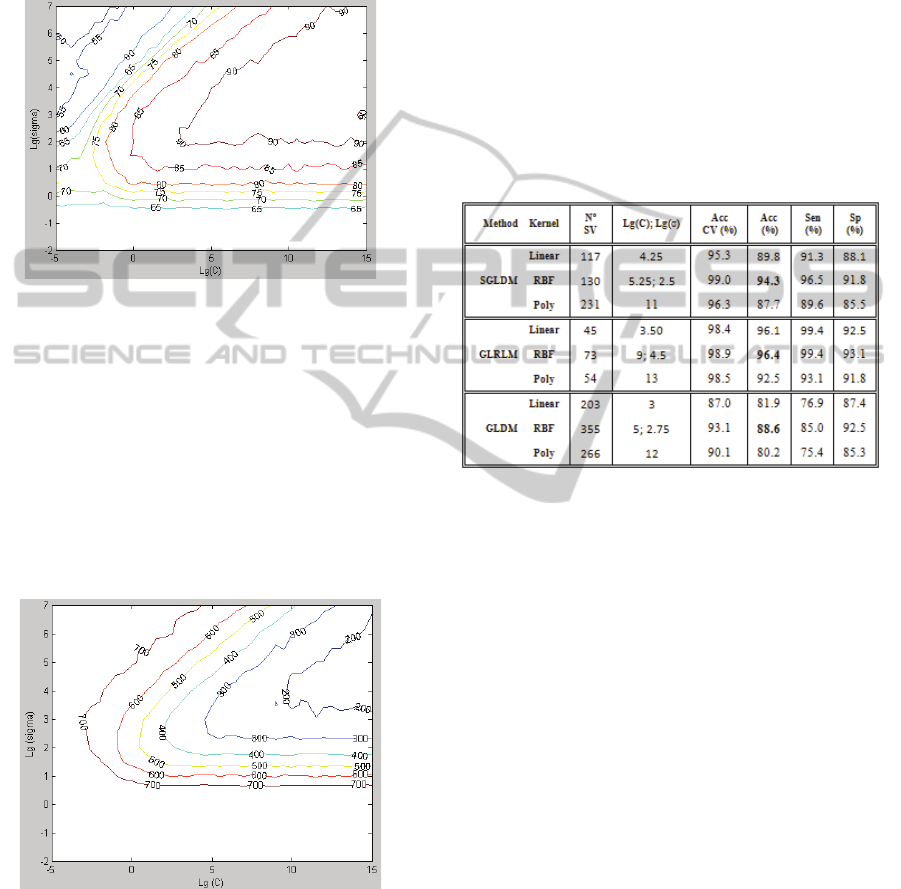
step of 0.25 upward and downward. Figure 3 and 4
depicts graphics contours of CV accuracy and
number of SV, after a 10-fold cross validation, for
RBF Kernel and features extracted with GLDM.
Figure 3: CV accuracy (%) obtained along the search
space for finding (C, σ) parameters. GLDM features and
RBF kernel were considered.
A heuristic analysis of the curves of Figure 3
allows a good understanding of the parameters space
and a way of reduce search space. Variations in
accuracy results are of the order of 45%. The worst
accuracy was 41.5%, obtained in grid coordinates
(C=2
-4
, σ=2
7
) and the best accuracy was 92.8%
obtained at (C=2
5
, σ=2
2.5
). The number of SV varied
between 152 and 785. A similar methodology was
performed for all the kernels and features sets.
Figure 4: Number of SV obtained along the search space
for finding (C, σ) parameters. GLDM features and RBF
kernel were considered.
Table 1 illustrates the results obtained for the
parameters that best handled the classification pro-
blem. The highest classification accuracy (Acc),
sensibility (Sen) and specificity (Sp) was achieved
with RBF kernel, for all the features extraction
methods. However, the parameter tuning must be
carefully done to obtain the optimal parameters.
According to the experiments, the polynomial kernel
originated the SVM models that achieved the worst
metrics. The large values of the regularization
parameter C, that correspond to a high penalization
to misclassified samples, can compromise the
performance of the model because correspond to an
overfitting situation. However, more experiments are
necessary since this kernel function was used with
the parameters γ, δ and d fixed. The adjustment of
these parameters might lead to better results.
Table 1: Results obtained for the three sets of features and
kernels.
An interesting characteristic of SVM is that the
optimization problem leads to a sparse solution, in
the sense that only SV points of the feature space
have α
i
≠0 (in Equation 6). This fact is very attractive
from the computational point of view, specially for
large datasets. Analyzing Table 1, we can conclude
that GLRLM features led to the best results in all the
metrics, with the less number of SV. With this
feature set, linear kernel is also a good option,
allowing results very similar to RBF kernel.
6 CONCLUSIONS
In this paper a comparative performance analysis in
discrimination of lung emphysema pattern in HRCT
images from healthy pattern was presented. Three
common kernel functions were tested with different
statistical features sets. A grid search was carried out
in order to get the optimal parameters which
influence the model performance. From presented
study, it’s clear that the kernel choice and
parameters tuning is crucial to maximize the SVM
performance. In the three features sets tested, the
RBF kernel achieved the highest performances. The
polynomial kernel was not the ideal function for
IMAGAPP 2011 - International Conference on Imaging Theory and Applications
138

these classifications propose. However, more tests
will be done with the adjustment of the kernel
parameters.
ACKNOWLEDGEMENTS
The authors thank to Dr. Luísa Teixeira and Dr.
Miguel Sêco, physicians from Radiology
Department of Coimbra University Hospital, for
their medical knowledge and assistance.
REFERENCES
Burges, C., 1998. Tutorial on support vector machines for
pattern recognition, Data Mining Knowledge
Discovery, 2 (2): 121–167.
Depeursinge, A., 2010a. Affine–invariant texture analysis
and retrieval of 3D medical images with clinical
context integration, University of Geneva, Geneva.
Depeursinge, A., Iavindrasana, V., et al., 2010b.
Comparative Performance Analysis of State-of-the-Art
Classification Algorithms Applied to Lung Tissue
Categorizatin, Journal of Digital Imaging 23(1):18-30.
MATLAB 2009b. Natick, Massachusetts: The MathWorks
Inc.
Meyer, D., Leisch, F., Hornik, K., 2003. The support
vector machine under test, Neurocomputing, 55:169-
186.
Sluimer, I., Schilham, A., Prokop, M., Ginneken, B. V.,
2006. Computer Analysis of Computed Tomography
Scans of the Lung: A Survey. IEEE Transactions on
Medical Imaging 25: 385-405.
Vapnik, V., 1995. The nature of statistical learning
theory, Springer-Verlag. New York.
Vasconcelos, V., Silva, J. S., Barroso, J., 2009. CAD Lung
System: Texture Based Classifier of Pulmonary
Pathologies. 4th Iberian Conference on Information
Systems and Technologies, 1:383-386.
Vasconcelos, V., Silva, J. S., Marques, L., Barroso, J.,
2010. Statistical Textural Features for Classification of
Lung Emphysema in CT Images: A comparative
study. 5th Iberian Conference on Information Systems
and Technologies, 1:496-500.
Verschakelen, J. A., Wever, W. D., 2007. Computed
Tomography of the Lung - A Pattern Approach,
Springer Berlin Heidelberg.
APPENDIX
Table 2: Textural Features extracted from each method.
Spatial Gray Level
Dependence Method
(SGLDM)
Gray Level Run-Length Method
(GLRLM)
Gray Level Difference
Method (GLDM)
Angular Second Moment
Entropy
Inverse Difference Moment
Correlation
Variance
Contrast
Short Run Emphasis
Long Run Emphasis
Gray Level Non-Uniformity
Run Length Non-Uniformity
Run Percentage
Low Gray Level Run Emphasis
High Gray Level Run Emphasis
Short Run Low Gray Level Emphasis
Short Run High Gray Level
Emphasis
Long Run Low Gray Level Emphasis
Long Run High Gray Level
Emphasis
Angular Second Moment
Entropy
Inverse Difference
Moment
Correlation
Variance
Contrast
COMPARATIVE PERFORMANCE ANALYSIS OF SUPPORT VECTOR MACHINES CLASSIFICATION APPLIED
TO LUNG EMPHYSEMA IN HRCT IMAGES
139
