
COMPUTATIONAL SYMMETRY VIA PROTOTYPE DISTANCES
FOR SYMMETRY GROUPS CLASSIFICATION
M. Agust
´
ı-Melchor,
´
Angel Rodas-Jord
´
a and J. M. Valiente-Gonz
´
alez
Computer Vision Group, DISCA, ETS. Ingenieria Inform
´
atica
Universitat Polit
`
ecnica de Val
`
encia (UPV), Camino de Vera, s/n, 46022 Valencia, Spain
Keywords:
Computational symmetry, Symmetry groups, Prototype-based classification, Adaptive nearest neighbour clas-
sification.
Abstract:
Symmetry is an abstract concept that is easily noticed by humans and as a result designers make new creations
based on its use, e.g. textile and tiles. Images of these designs belong to a more general group called wallpaper
images, and these images exhibit a repetitive pattern on a 2D space. In this paper, we present a novel compu-
tational framework for the automatic classification into symmetry groups of images with repetitive patterns.
The existing methods in the literature, based on rules and trees, have several drawbacks because of the use of
thresholds and heuristics. Also, there is no way to give some measurement of the classification goodness-of-fit.
As a consequence, these methods have shown low classification values when images exhibit imperfections due
to the manufacturing process or hand made process. To deal with these problems, we propose a classification
method that can obtain an automatic parameter estimation for symmetry analysis. Using this approach, the
image classification is redefined as distance computation to the binary prototypes of a set of defined classes.
Our experimental results improve the state of the art in symmetry group classification methods.
1 INTRODUCTION
Symmetry is an abstract concept that is easily noticed
by humans and as a result designers make new cre-
ations based on its use. In industrial sectors, like tex-
tile, ceramics or graphic arts, the notion of symmetry
is always present as an aesthetic element, indispens-
able in every new design. When using a symmetrical
design, a pattern is repeated to fill the workplane, fol-
lowing strict placement rules. The traditional Tillings
and Patterns Theory describes the fundamentals of
this design creation process. The results are designs
such as those shown in Figure 1. These are images of
typical wovens samples and mosaics samples, com-
monly referred as regular mosaics, wallpaper images,
wallpaper patterns, or simply Wallpapers. However,
little effort has been made in the area of wallpaper
image analysis and classification, and so this work ex-
plores this direction.
Tile and textile companies have thousands of these
samples accumulated over the years and stored in
company storerooms or museums. In most cases,
these collections are digitized and stored in images
databases. These collections are an invaluable asset
used as source of inspiration for designers. But de-
signers suffer serious limitations when searching and
manage these information because the images are in
bitmap format, and designers are accustomed to use
other abstract terms related with perceptual criteria
(Closeness, Co-circularity, Co-linearity, Overlapping,
etc..). Therefore some kind of image analysis is nec-
essary to extract information about the internal geom-
etry and structure of these patterns. All this informa-
tion, conveniently organized, can be used to build an
Information System that allows all these historical de-
signs to be effectively used. The compact image de-
scription obtained can also be used in other areas such
as object detection or Content Based Image Retrieval.
The term computational symmetry refers to the al-
gorithmic treatment of symmetries. The recent resur-
gance interests in computational symmetry, for com-
puter vision and computer graphics applications, has
been recognized by the recent tutorial at ECCV 2010
Conference (Liu et al., 2010) that explored the funda-
mental relevance and potential power that computa-
tional symmetry enables. But, as is stated by these
authors, using real world data: it ”turns out to be
challenging enough that, after decades of effort, a
fully automated symmetry system remains elusive for
real world applications”. The authors also summa-
85
Agustí-Melchor M., Rodas-Jordá Á. and M. Valiente-González J..
COMPUTATIONAL SYMMETRY VIA PROTOTYPE DISTANCES FOR SYMMETRY GROUPS CLASSIFICATION.
DOI: 10.5220/0003375300850093
In Proceedings of the International Conference on Computer Vision Theory and Applications (VISAPP-2011), pages 85-93
ISBN: 978-989-8425-47-8
Copyright
c
2011 SCITEPRESS (Science and Technology Publications, Lda.)
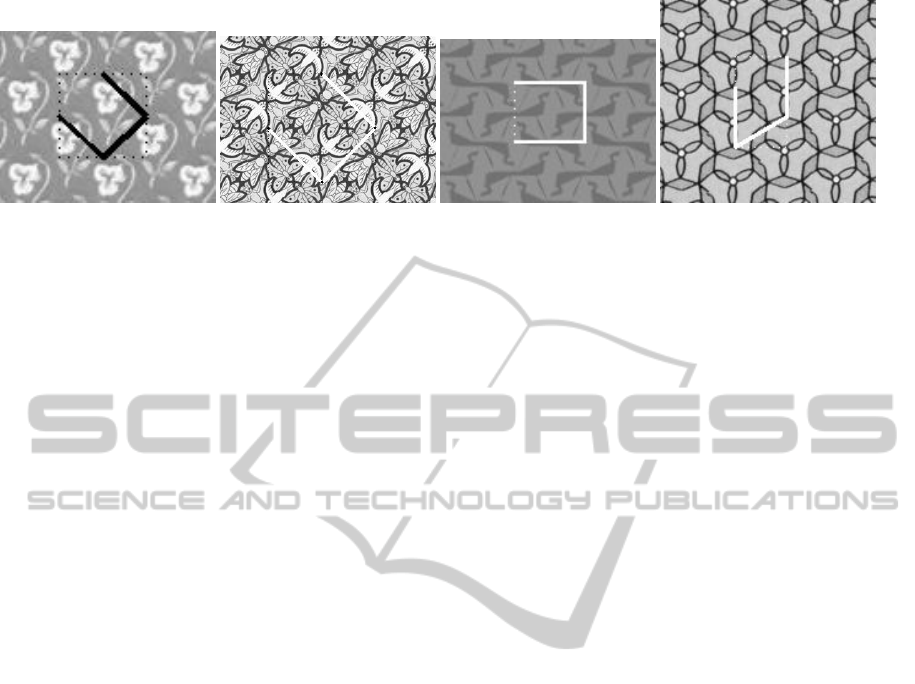
Figure 1: Details of wallpaper images obtained from (Wikipedia, ), (Edwards, 2009), and (Joyce, 2007) collections. They
are images of real textile samples, showing hand-made artefacts and damaged or scratched parts. The geometry of the Unit
Lattice is draw on the centre of each image.
rize two key points. Firstly, to compute the concepts
of group theory from imperfect, noisy, ambiguous,
distorted and often hidden symmetry patterns in real
world data. And secondly, to apply the mathematical
theory of symmetry, group theory, to algorithms that
incorporate/assume the limitations of representational
power of computers.
In this paper, in order to explicitly addressing each
of these statements, we propose a novel computa-
tional framework based on continuous measures of
symmetries to classify real and synthetic images of
two-dimensional repetitive patterns. These will be
formally described as symmetry groups (wallpaper
groups or plane symmetry groups or plane crystallo-
graphic groups), based on the symmetries in the pat-
tern. Some examples of textile and tile patterns are
shown in Figure 1.
A symmetry of any 2D pattern can be described
through a set of geometrical transformations that
transforms it in itself. Those transformations that pre-
serve distances are know as isometries, and the only
plane isometries are: translations, rotations (n-fold)
reflections (specular) and glide reflections (specular
plus lateral displacement). Therefore, in a pattern up
to four different kinds of symmetries can be observed,
one external to the pattern (translational symmetry),
and the other three internals (rotation, reflection and
glide reflection symmetries).
Regarding the translational symmetry, a wallpa-
per pattern is a repetition of a parallelogram shaped
subimage, called Unit Lattice (UL), so that the full
pattern can be reconstructed by the replication (dis-
placements) of this UL. A lattice extraction proce-
dure is then needed to obtain the lattice geometry, in
the form of two direction vectors (UL sides) that de-
fine the translational symmetry of the pattern. Among
others, autocorrelation ((Liu and Collins, 2000),(Liu
et al., 2004)), Fourier or wavelet (Agust
´
ı et al., 2008)
approaches have been used, among others, to solve
this question. In this work we assume that the lat-
tice geometry has been already obtained and the UL
is known.
For internal symmetries, we rely on the Symme-
try Groups theory (Horne, 2000), which uses the con-
cept of symmetry groups to formulate a mathematical
description of complex plane pattern structures. The
set of isometric transformations that brings a figure
in coincidence with itself is called a symmetry group.
In the 1-D case, Frieze Symmetry Groups (FSG), the
pattern contains one traslational symmetry and some
other isometries. In the 2D case, Plane Symmetry
Groups (PSG), the pattern contains two traslational
symmetries (lattice) and some other isometries. For
example, the pattern in Figure 1 (left) has only trans-
lational symmetry. In contrasts, the other patterns of
Figure 1 have more isometries, such as 180
◦
rotations
and reflections about two axes, and the last pattern can
be reconstructed using 120
◦
rotations.
It is also known that there is a geometric restric-
tion, called the ’crystallographic constraint’, which
limits the number of possible rotations that can be
applied to a motif or tile to completely fill the plane
without holes nor overlapping. These rotations are
180
◦
,120
◦
,90
◦
and 60
◦
. Accordingly, the number of
PSG are limited to 17 cases, which is one of the main
issues that help us to describe the pattern structure.
Figure 2 shows the details of each PSG, as well as
their standard notation. For example, the patterns
in Figure 1 belong, from left to right, to symmetry
groups P1, PMM, PGG and P31M.
2 STATE OF THE ART
An extended discussion and comparison of Symme-
try Detection algorithms can be found in (Liu et al.,
2010). The authors have choosen three algorithms be-
cause they are ”(1) recently published; (2) have gone
beyond single reflection/rotation symmetry detection.
In fact, they all claim to detect multiple symmetries
in an image; (3) directly applicable to un-segmented,
real images; and (4) the authors make their source
VISAPP 2011 - International Conference on Computer Vision Theory and Applications
86
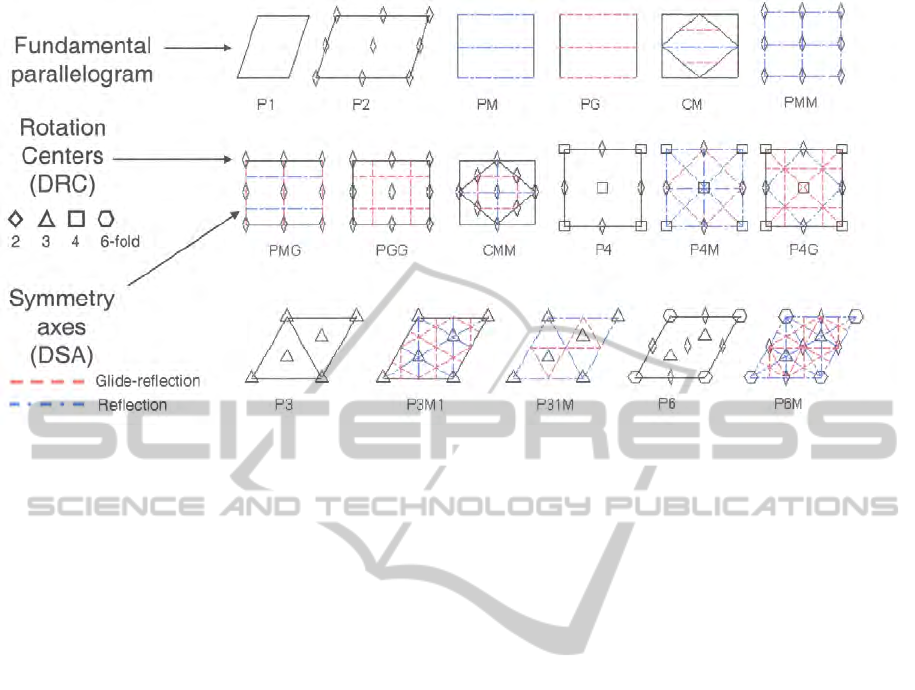
Figure 2: Visual representation of the 17 Wallpaper Groups including their standard notation, the reflection symmetry axes
(glide and non-glide) and rotation centres of n-fold symmetries. The UL is referred as Fundamental Parallelogram.
code publicly available”. They use a test bed of 176
images with hand-labeled ground truth from image
databases of object-detection challenges, divided ac-
cording to (i) synthetic versus real images; and (ii)
images containing a single dominant symmetry ver-
sus multiple symmetries, considering only two types
of symmetries (rotation and reflection). To quantify
algorithms performance, a success rate over the test
image dataset is computed obtaining a 63% of best
mean sensitivity for reflection over all types (synthetic
or real, single or multiple symmetries) of images. In
real images, the best mean sensitivity rate is 42% (for
reflection). However, for a true understanding of mul-
tiple existing symmetries in an image, we should be
more concerned with the overall success rate S1 (in-
cluding the false positives). The best values of S1
are much worse: 27% for reflection/rotation symme-
try detection in the overall image set, and 19% on real
images.
On the other side, the classical algorithms to cata-
logue wallpaper designs are procedures to be used by
humans based on heuristics ((Grunba
¨
um and Shep-
ard, 1987), (Schattschneider, 1978)). They are pro-
posed in the form of decision trees whose branches
are raised as questions that humans can answer by
looking at the design. The ambiguities in the rules
formulation poses complexity into the computer re-
formulation of these rules as computer programs.
The main computer autonomous approach of this
kind has been made by Liu et al. ((Liu and Collins,
2000), (Liu et al., 2004)) in which a computer model
is proposed for the automatic classification of frieze
and plane groups on grayscale bitmap images. This
model expresses the Schattschneider algorithm in the
form of a rule-based classifier (RBC) where each
symmetry group corresponds to a unique sequence of
yes/no answers to whether the pattern contains some
symmetries, such as n-fold rotation or reflections. It
can be seen as a kind of decision tree classifier with
binary symmetry values. These values are computed
as scores as follows. Firstly, the maximum of the cor-
relation between the transformed image (by applying
the symmetry that has been measured) and the origi-
nal image is obtained. Secondly, at the position of this
maximum, an UL is extracted from the transformed
image, and the SSD (sum of squared differences) be-
tween corresponding intensity values of the original
and transformed UL is computed. As the classifica-
tion needs binary values, a thresholding step is re-
quired. In a initial work (Liu and Collins, 2000),
an experimentally obtained fixed threshold value was
used. In a later work (Liu et al., 2004), a most ro-
bust procedure was introduced using a χ
2
(N) test and
computing the threshold as a function of N.
Our experience confirms that both methods can
be tuned to obtain good results for the Joyce (Joyce,
2007) dataset. Even so, the first method of obtaining a
threshold cannot be generalized to other datasets be-
cause it has been experimentally obtained. The sec-
ond method assumes that translational symmetry has
non-zero standard deviation, so it can not be applied
in ideal synthetic images. In addition, the use of RBC
obtains only one classification result without an asso-
ciate measure of confidence. Therefore, it becomes
necessary to enhance this solution - as is also noted in
(Reddy and Liu, 2005).
COMPUTATIONAL SYMMETRY VIA PROTOTYPE DISTANCES FOR SYMMETRY GROUPS CLASSIFICATION
87

In this work, we propose the use of continuous
features for a distance-based classification approach
and the use of binary class prototypes describing the
17 PSG mentioned above, and which are adaptively
adjusted for image conditions. In this way, the high
degree of variance of symmetry features, due to noise,
deformations or just the nature of the hand made prod-
ucts, is asssumed.
3 PROPOSED METHOD
3.1 Feature Computation
We started by using a nearest neighbour classifier
(NNC) as this enabled us to obtain a measure of good-
ness for the classification. This kind of method re-
quire the use of continuous-value feature vectors. A
close view of symmetry groups description in Figure
2 reveals that the minimum number of symmetry fea-
tures needed to distinguish every PSG is twelve. They
are four (R
2
, R
3
, R
4
and R
6
) related to rotational sym-
metries (2-fold, 3-fold, 4-fold and 6-fold); four (T
1
,
T
2
, T
1G
and T
2G
) to describe reflection simetries (non-
glide and glide) along axes parallel to the sides of UL;
and four more features (D
1
, D
2
, D
1G
and D
2G
) for re-
flection (non-glide and glide) with respect to the two
UL diagonals.
We defined a symmetry feature vector (SFV) of
twelve elements that identifies the presence/absence
of these image symmetries as follows:
SFV = ( f
1
, f
2
, ..., f
12
); f
i
∈ ℜ, 0 ≤ f
i
≤ 1 (1)
We compute the twelve symmetry features f
i
, by
using a slightly different method to the Liu’s team.
To obtain a symmetry value for a specific isometry,
e.g 2-fold rotation, we apply this transformation to
the original image I(x, y) obtaining the transformed
image I
T
(x, y). A piece of the transformed image,
of the same size that the UL, is taken. A bound-
ing box of the UL is actually used BBox(x
0
, y
0
), to
save computations. A score map is then computed
as Map(x, y) = 1 − SAD(x, y), where SAD(x, y) is the
sum of absolute differences between the transformed
BBox and the original image at (x,y) position, and it
is scaled to [0, 1] by BBox size m, according to:
SAD(x, y) =
1
m
∑
x
0
y
0
|
I(x − x
0
, y − y
0
) − BBox(x
0
, y
0
)
|
If the symmetry is present in the image, this
map peaks at several positions indicating the pres-
ence of that symmetry, while revealing lower val-
ues in areas where the symmetry is not hold. The
|
maximum − minimum
|
difference should then be a
good measure to quantify that feature. Figure 3 shows
an example. However, there are patterns without in-
ternal symmetries, such as P1 patterns (see Fig 2)
so that max-min difference should be relative to any
other value representing the presence of symmetry.
The only symmetry always present in every pattern is
the traslational symmetry (S
T
). So we can obtain S
T
by computing the previous score map using the orig-
inal image and its translated version (following UL
sides) and the maximum of this map will represent the
upper score level of symmetry S
T
present in the im-
age. Finally, we compute the normalized components
of the Symmetry Feature Vector (SFV) as follows:
f
i
=
max(Map)−min(Map)
S
T
−min(Map)
1 ≤ i ≤ 12 (2)
The higher the value of f
i
, the more likely the image
contains symmetry. Table 1 shows the SFV vectors
obtained for the four wallpaper samples in Figure 1.
As expected, these results partially confirm high val-
ues that indicate the presence of symmetry and low
values otherwise. For example, sample 2 is a PMM
wallpaper group, so it must have R
2
, T
1
and T
2
sym-
metries, and correspondingly its SFV shows values
higher than 0.80 for those features. The same hap-
pens in sample 3, with very high values (> 0.9) for R
2
,
T
1
G and T
2
G symmetries, which is expected in a PGG
wallpaper. However, sample 3 (P31M) have features
with values of 0.7 and 0.65 denoting the presence of
symmetry, while these values would be considered
as indicating non-symmetry in the other cases. On
the contrary, the first sample is a P1 with no symme-
tries, but its SFV shows values up to 0.8, what would
be considered as symmetry in the other cases. Be-
cause these features were computed as gray level dif-
ferences between image patches, so their values will
strongly depend on the particular arrangements of im-
age pixels, i.e. the image complexity. As a conse-
quence SFV requires a higher level of adaptation to
the image conditions, i.e. taking into account on the
contents of each image separately. This idea will be
used later.
3.2 Symmetry Groups Classification
To classify a wallpaper image, featured by SFV, we
need to learn or define a set of class samples. Fortu-
nately, the number of classes (17) and their structure
are known in advance. For the sake of simplicity, we
VISAPP 2011 - International Conference on Computer Vision Theory and Applications
88
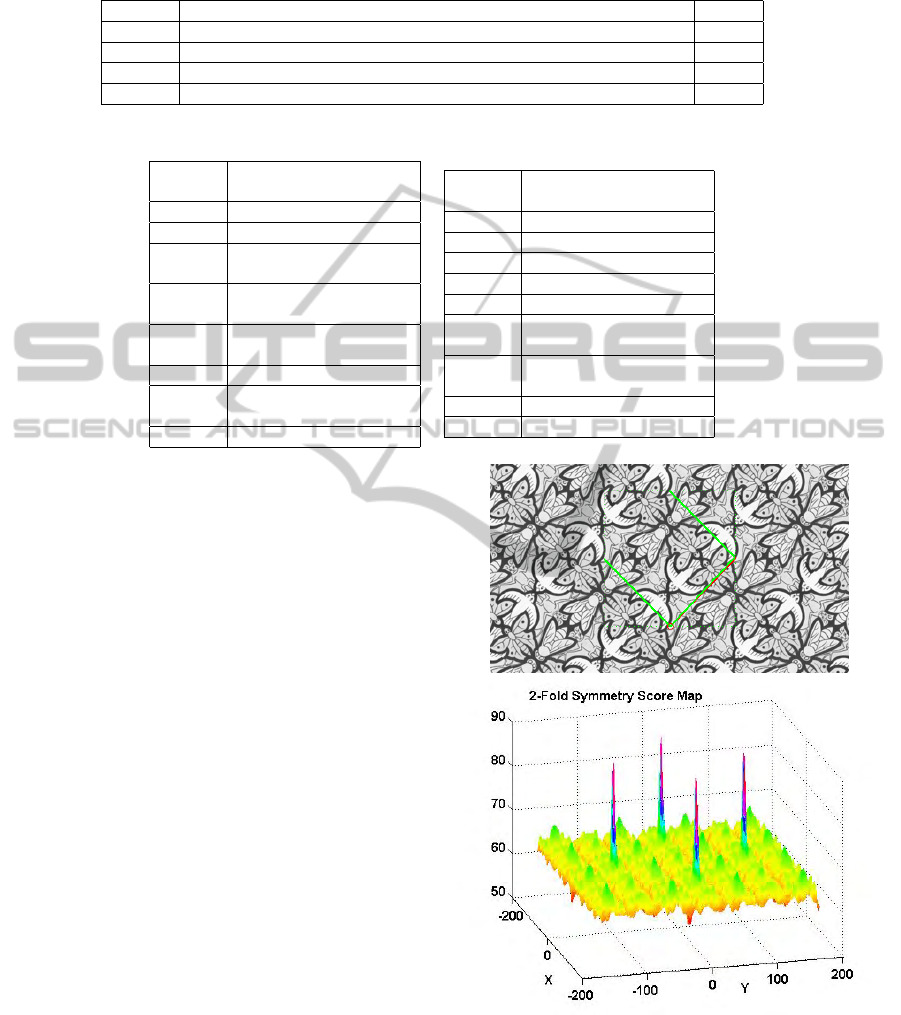
Table 1: Symmetry feature vectors of the four wallpapers showed in Figure 1. The bold values means a value that has to be
considered as presence of symmetry to consider each vector as the group that it belongs to, while the others mean absence of
others symmetries.
Sample SFV=(R
2
, R
3
, R
4
, R
6
, T
1
, T
2
, D
1
, D
2
, T
1G
, T
2G
, D
1G
, D
2G
) PSG
1 (0.62, 0.47, 0.69, 0.34, 0.65, 0.67, 0.80, 0.59, 0.37, 0.43, 0.80, 0.59) P1
2 (0.82, 0.09, 0.20, 0.09, 0.88, 0.83, 0.20, 0.19, 0.27, 0.26, 0.2, 0.19) PMM
3 ( 0.95, 0.42, 0.33, 0.46, 0.39, 0.45, 0.31, 0.48, 0.98, 0.99, 0.31, 0.48) PGG
4 (0.46, 0.69, 0.28, 0.49, 0.74, 0.65, 0.48, 0.72, 0.74, 0.65, 0.48, 0.72) P31M
Table 2: Binary prototypes for the 17 PSG classes.
Classes Prototype
Feature vectors
P1 (0,0,0,0,0,0,0,0,0,0,0,0)
P2 (1,0,0,0,0,0,0,0,0,0,0,0)
PM
1
(0,0,0,0,1,0,0,0,0,0,0,0)
PM
2
(0,0,0,0,0,1,0,0,0,0,0,0)
PG
1
(0,0,0,0,0,0,0,0,1,0,0,0)
PG
2
(0,0,0,0,0,0,0,0,0,1,0,0)
CM
1
(0,0,0,0,0,0,1,0,0,0,1,0)
CM
2
(0,0,0,0,0,0,0,1,0,0,0,0)
PMM (1,0,0,0,1,1,0,0,0,0,0,0)
PMG
1
(1,0,0,0,1,0,0,0,0,1,0,0)
PMG
2
(1,0,0,0,0,1,0,0,1,0,0,0)
PGG (1,0,0,0,0,0,0,0,1,1,0,0)
Classes Prototype
Feature vectors
CMM (1,0,0,0,0,0,1,1,0,0,1,1)
P4 (1,0,1,0,0,0,0,0,0,0,0,0)
P4M (1,0,1,0,1,1,1,1,0,0,1,0)
P4G (1,0,1,0,0,0,1,1,1,1,1,0)
P3 (0,1,0,0,0,0,0,0,0,0,0,0)
P31M
1
(0,1,0,0,1,1,1,0,1,1,1,0)
P31M
2
(0,1,0,0,1,1,0,1,1,1,0,0)
P3M1
1
(0,1,0,0,0,0,1,0,0,0,1,0)
P3M1
2
(0,1,0,0,0,0,0,1,0,0,0,0)
P6 (1,1,0,1,0,0,0,0,0,0,0,0)
P6M (1,1,0,1,1,1,1,1,1,1,1,0)
start by proposing the use of binary prototypes repre-
senting each one of the 17 classes. Each prototype has
a SFV with components to ’1’ if the symmetry is hold,
and ’0’ otherwise. The Table 2 shows the resulting
23 prototypes. Some classes have two prototypes be-
cause there are two possibilities where reflection sym-
metry can appears (two UL sides and two diagonals).
We then use a Nearest Neighbour Classifier (NNC) to
perform the task. The Euclidean distance to the class
prototype can be used as a measure of confidence.
After applying the NNC to several image collec-
tions we did not found significant improvements in
comparision with RBC (see the Experiments section).
It is probably due to the bias of the feature values.
The minimum values (non-symmetry) are higher than
expected because the SAD between image patches al-
ways produces non-null values. Moreover, maximum
values (symmetry) rarely approximate to traslational
symmetry. In this situation, the use of binary proto-
types, with inter-class boundaries equidistant to each
class, does not fit the problem. However, some ad-
vantage has been achieved. The NNC produces an or-
dered set of outputs describing the class membership
of each sample. This latter consideration can enable
an automatic adjustment of the prototypes in order to
adapt them to the image variability.
3.3 Adaptive NNC (ANNC)
Recent works on NN classifiers have shown that adap-
tive schemes (Wang et al., 2007) outperforms the re-
Figure 3: Original image (up) width the unit lattice (UL)
and score map (down) for 2-fold symmetry rotation.
sults of classic NNC in many applications. We adopt
this approach for several reasons. Firstly, the discrete
nature of the image domain introduces errors in the
computations of image transforms. However, when
COMPUTATIONAL SYMMETRY VIA PROTOTYPE DISTANCES FOR SYMMETRY GROUPS CLASSIFICATION
89
assuming perfect symmetries (synthetic images), the
absence of symmetry cannot be computed as ’0’ nor
can perfect symmetry be computed as ’1’. Secondly,
the dynamic range of the symmetry values ( f
i
) is ex-
tremely variable, depending on the specific conditions
of each image. In simple images (e.g. line-drawings)
the presence of large homogeneous areas in the image
leads to high symmetry scores, even in the absence of
symmetry. In some images, the presence/absence of
certain symmetries is due to small details, leading to
symmetry components being compressed into a nar-
row range. In other cases, symmetries are diminished
by a particular symmetry score that is stressed by spe-
cific pixel arrangements in the image. A further con-
cern is that the null-class P1 (total absence of interior
symmetries) is the main source of false positives.
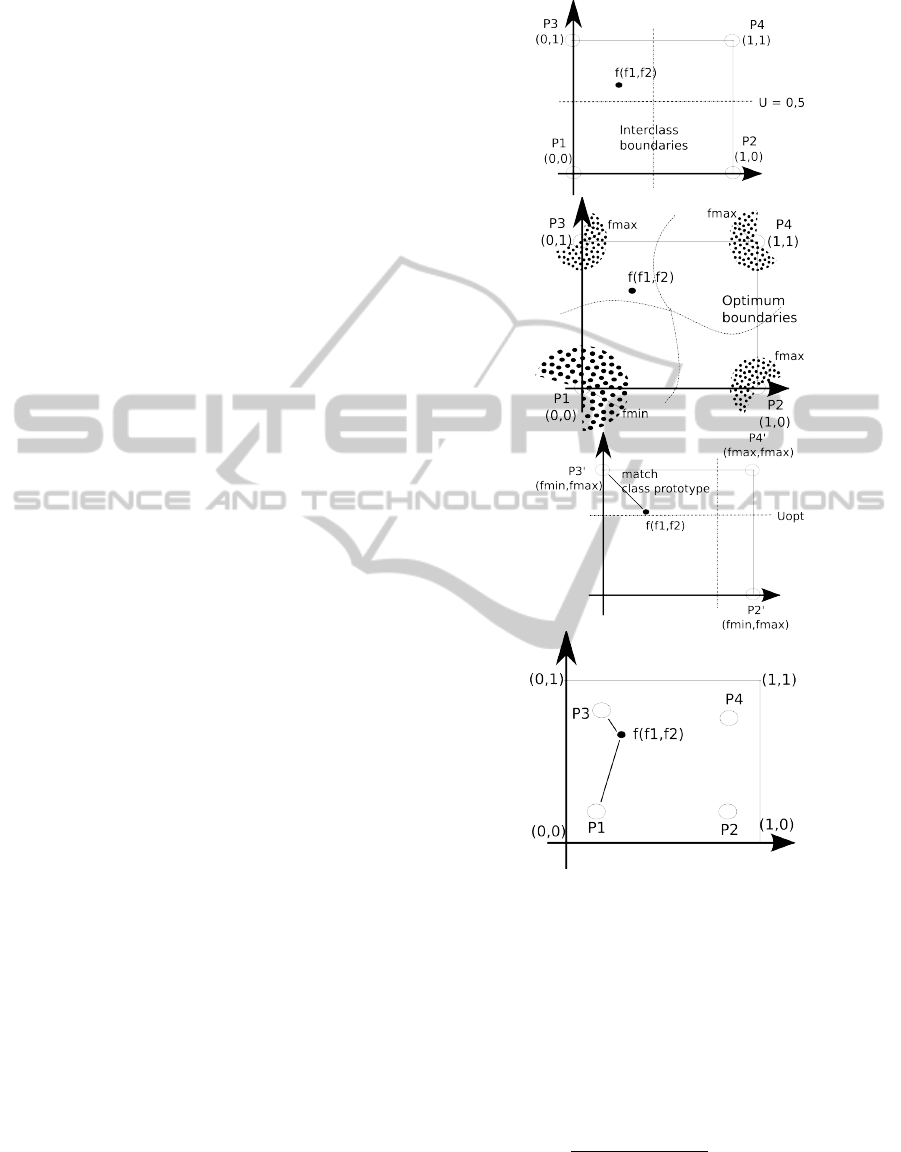
In response to this situation we propose an adap-
tive approach based on establishing a merit function
to adapt the inter-class boundaries to the specific im-
age conditions. Figure 4-a shows a simplified exam-
ple of a 2D feature space including 4 binary proto-
types. The inter-class boundaries are symmetric with
respect to each prototype. In a real context, and image
of a pattern or any version translated or rotated will
have symmetry feature vectors SFV ( f
1
, f
2
) that never
reach certain areas close to the prototypes. These
areas can be founded computing the SFV for differ-
ent translated or transformed version of the same pat-
tern, and looking for f
min
and f
max
values. Figure 4-b
shows this forbiden areas. In this space, the distances
to the prototypes are distorted, so it would be desir-
able to adapt the boundaries between classes to this
situation.
To do this, a transformation of the the feature
space can be performed by normalising these fea-
tures using f
min
and f
max
values. In this new space
the null-class P1 disappears (every SFV has at least a
’1’ value), therefore this class should be treated sepa-
rately. In this new space, a boundary between classes
can be searched in a way that maximizes a merit func-
tion. To simplify the computations, we use orthogonal
boundaries defined by a single parameter U , that rep-
resents the Uncertainty Boundary of Symmetry. We
studied several merit functions and, finally, propose
the distance ratio between the reported first and sec-
ond classes after classifying the sample with respect
to binary prototypes using a NN classifier. The result
is the boundary U
opt
that best separates the classes.
Moreover, instead of moving the inter-class bound-
aries, the problem is reformulated to modify the class
prototypes into new values (H, L) ∈ [0, 1] that are
symmetrical with respect to the middle value U (Fig-
ure 4-c). Finally, the closest class to new prototypes
(H, L) and the null-class P1 are disambiguated (Fig-
Figure 4: (a) A 2D feature space including binary proto-
types P1, P2, P3 and P4. (b) Forbiden areas around the
prototypes. (c) Normalized space to f
min
and f
max
. Adap-
tion of class boundaries. (d) Prototype adaption and final
P1 disambiguation.
ure 4-d). The algorithm is as follows:
Step 1 - The symmetry values are normalized between
the maximum and minimum values of SFV :
SFV
0
= ( f
0
1
, f
0
2
, ..., f
0
12
);
f
0
i
=
f
0
i
−min(SFV )
max(SFV )−min(SFV )
; 1 ≤ i ≤ 12
(3)
In this way we assume that every image has one
symmetry and one non-symmetry value, discharging
the P1 class and resulting in a 16-class problem.
VISAPP 2011 - International Conference on Computer Vision Theory and Applications
90

Step 2 - The original prototypes are transformed into
(H, L) prototypes for each of 16 classes. These values
are defined with respect to parameter U as in Eq. 4:
U ∈ ℜ, 0 ≤ U ≤ 1
U ≥ 0, 5 ⇒ H = 1, L = 2 ·U − 1
U < 0, 5 ⇒ L = 0, H = 2 ·U
(4)
Step 3 - For each U, ranging from 0.2 to 0.8, the H
and L limits are computed using Eq. 4 and a near-
est neighbour classification is performed using SFV
and the resulting prototypes. The merit function is the
distance ratio between the reported first and second
classes. After repeating steps 2-3 for all U values, the
value (U
opt
) that maximizes the merit function is se-
lected, and the corresponding class is also tentatively
selected (candidate class).
Step 4 - Finally, we disambiguate the candidate class
from the previously excluded P1 class. To achieve
this, we again re-classify the SFV but only using the
P1 and candidate classes. The nearest class is selected
as the final result.
4 EXPERIMENTS
As indicated in (Liu et al., 2010), without a systematic
evaluation of different symmetry detection and classi-
fication algorithms against a common image set under
a uniform standard, our understanding of the power
and limitations of the proposed algorithms remains
partial.
As image datasets reported in literature were not
publicly available, we selected several wallpaper im-
ages from known websites, to carry out the compari-
son between the proposed ANNC and the reference
RBC methods. We picked out images from Wall-
paper dataset in (Joyce, 2007), Wikipedia dataset in
(Wikipedia, ), Quadibloc dataset in (Savard, ), and
SPSU dataset in (Edwards, 2009), resulting in a test
bed of 161 images. All images were hand-labelled to
make the ground truth. Also, an initial procces of lat-
tice extraction were performed to obtain the UL, using
wavelets (Agust
´
ı et al., 2008).
As the original RBC algorithm source code was
unavailable, we implemented it using the original
RBC decision tree reported in (Liu et al., 2004), but
using our SFV feature vectors, and binarising the fea-
tures using a fixed threshold for all image datasets. A
threshold of 0.7 was obtained as the average of the
better classification results when all the threshold val-
ues are explored.
The results obtained with RBC, NNC and ANNC
classifiers are shown in Table 3. For the shake of
brevity, we only put here the percentage of success-
ful classification, i.e. accuracy or precision results.
Table 3: Experimental classification results from RBC,
NNC, and ANNC.
Collection Sub-set RBC NNC ANNC
Wallpaper 100 94,12 100
Wikipedia 56,6 60,38 54,72
WikiGeom 88,24 76,47 94,12
Quadibloc 69,57 73,91 82,61
Quad0102 62,07 79,31 79,31
Quad03 88,24 58,82 88,24
SPSU 45,37 52,75 54,63
The first image collection is Wallpaper, a standard
collection reported in previous works. In this case,
both RBC and ANNC methods obtain a 100% of suc-
cess. The RBC achieves the same result as reported in
(Liu et al., 2004), which means that our implementa-
tion of this algorithm has similar results as the original
implementation.
To take into account the varying complexity of the
images, we separate the next two collections in sub-
sets. In the WikiGeom dataset, which is a sub-set of
Wikipedia formed by strongly geometrical patterns,
the ANNC and NNC results outperformed the RBC.
Figure 5 shows some examples of this collection. In
the case of the entire Wikipedia collection, which in-
clude other distorted images, a decrease in results is
evident.
Similar results were obtained with Quadibloc im-
age collection, which is of intermediate complex-
ity. We studied it as two subsets: one formed by
sketches over uniform background (Quad0102), and
other (Quad03) is constituted by more complex mo-
tives with many highly contrasted colours are present.
The ANNC obtains near 80% of success rate with this
collections, clearly outperforming the NNC and RBC.
The worse results were obtained with the more
complex images in the SPSU collection. The Figure
6 show some examples of this collection. In this case,
all results are below 60%. This lower values are due
to the existence of noise and imprecise details (hand-
made) in the images. Also, they exhibit several rep-
etitions and illumination artifacts, which suggest the
necessity of pre-processing. It is remarkable that the
ANNC algorithm is still 10 points up that RBC algo-
rithm for this complex dataset.
5 CONCLUSIONS
This paper had presented a proposal for an adaptive
nearest neighbour classifier (ANNC) able to classify
COMPUTATIONAL SYMMETRY VIA PROTOTYPE DISTANCES FOR SYMMETRY GROUPS CLASSIFICATION
91
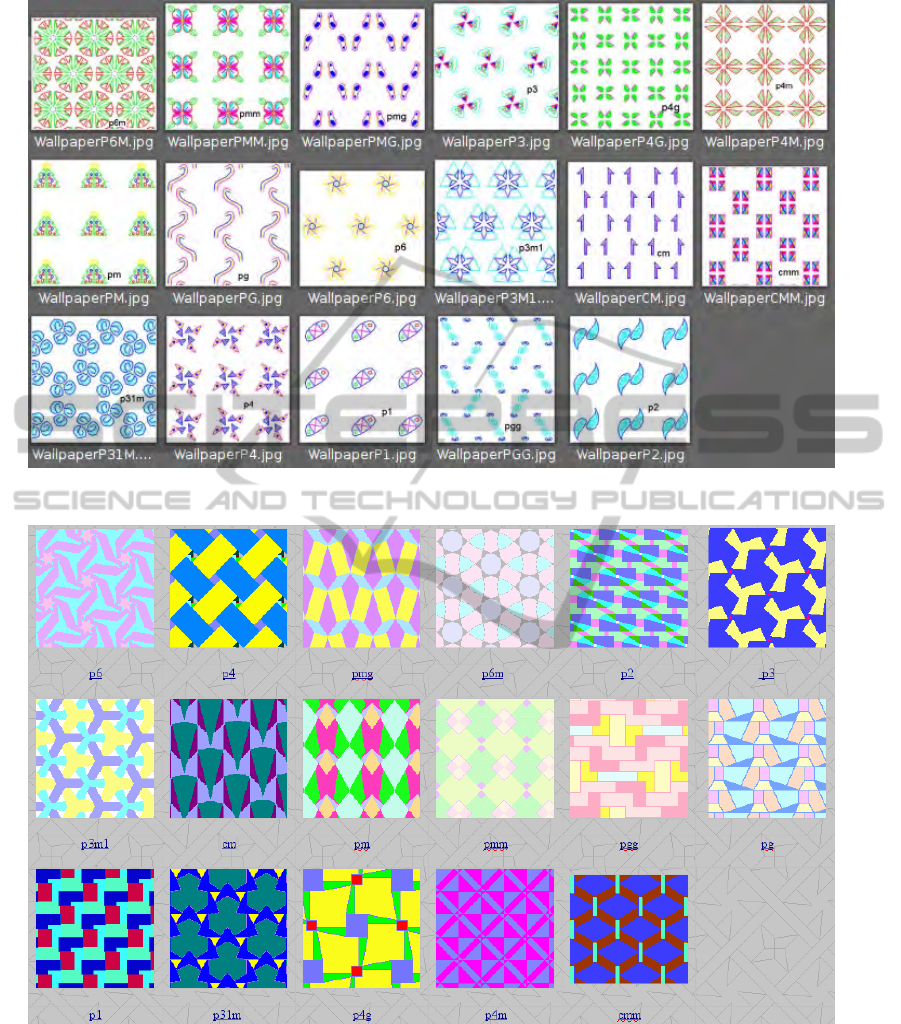
Figure 5: Wallpaper pattern examples in the wikiGeom collection.
Figure 6: Wallpaper pattern examples in the SPSU collection.
repetitive 2D pattern images into symmetry groups.
The feature vector is composed of twelve symmetry
scores, computationally obtained from the image gray
level values. The procedure uses a Sum-of-Absolute-
Differences approach and normalize these values by
the translational symmetry, the only symmetry that
image certainly contains. A distance-based Nearest
Neigbour classifier is then used to classify the image
into a symmetry group. A main issue is the use of bi-
nary class prototypes to represent the 17 PSG classes.
However, the absence of symmetry is never com-
puted as ’0’, nor the presence of symmetry is com-
puted as ’1’, even assuming perfect image conditions
(synthetic images). The dynamic range of the sym-
VISAPP 2011 - International Conference on Computer Vision Theory and Applications
92

metry values ( f
i
) is extremely variable, depending on
the specific conditions of each image. The binary
Rule Based Classifier (RBC) and the Nearest Neig-
bour classifiers behave poorly in that situation. This
leads to the use of some adaptive approach. The
proposed ANNC classifier is based on establishing a
merit function to adapt the inter-class boundaries to
the specific image conditions, and it is reformulated
as an adaptation of prototype feature vectors from bi-
nary values (0, 1) to adjusted (H, L) values. This clas-
sifier is non-parametric, so there is no need to adjust
the parameters involved, and it is also non-supervised,
so no learning stages are needed. The experimental
results show the limits of previous reported method
(RBC) when the image conditions are not established
and the need to adapt to these conditions. The ANNC
clearly outperforms the other methods, even with very
complex image collections.
As future work we are now on looking for a new
way of computing the symmetry features, because
the used approach seems to have a limited sensitiv-
ity. We are also extending the method to colour im-
ages. Moreover, the results can be useful in recovery
tasks using an extended version of ANNC. Finally, we
will concentrate on the matter of test beds: a standard
database does not exist in bibliography.
ACKNOWLEDGEMENTS
This work is supported in part by spanish project VIS-
TAC (DPI2007-66596-C02-01).
REFERENCES
Agust
´
ı, M., Valiente, J. M., and Rodas, A. (2008). Lattice
extraction based on symmetry analysis. In Procs. of
3rd. Int. Conf. on Computer Vision Applications (VIS-
APP’08), volume 1, pages 396–402.
Edwards, S. (2009). Tiling plane & fancy. http://
www2.spsu.edu/math/tile/index.htm.
Grunba
¨
um, B. and Shepard, G. (1987). Tilings And Pat-
terns. W.H. Freeman and Company, New York.
Horne, C. (2000). Geometric Symmetry in Patterns and
Tilings. Woodhead Publishing, Abington Hall (Eng-
land).
Joyce, D. (2007). Wallpaper groups (plane symmetry
groups). http://www.clarku.edu/∼djoyce/.
Liu, Y. and Collins, R. (2000). A computational model
for repeated pattern perception using frieze and wall-
paper groups. Technical Report CMU-RI-TR-00-08,
Robotics Institute, CMU.
Liu, Y., Collins, R., and Tsin, Y. (2004). A computational
model for periodic pattern perception based on frieze
and wallpaper groups. Trans. on PAMI, 26(3).
Liu, Y., Hel-Or, H., Kaplan, C. S., and Gool, L. V.
(2010). Computational symmetry in computer vision
and computer graphics. In Foundations and Trends in
Computer Graphics and Vision, volume 5, pages 1–
195.
Reddy, S. and Liu, Y. (2005). On improving the perfor-
mance of the wallpaper symmetry group classifica-
tion. Technical Report CMU-RI-TR-05-49, Robotics
Institute, Carnegie Mellon University.
Savard, J. G. Basic tilings: The 17 wallpaper groups.
http://www.quadibloc.com/math/tilint.htm.
Schattschneider, D. (1978). The plane symmetry groups:
Their recognition and notation. The American Mathe-
matical Monthly, 85:439–450.
Wang, J., Neskovic, P., and Cooper, L. N. (2007). Im-
proving nearest neighbor rule with a simple adap-
tive distance measure. Pattern Recognition Letters,
28(2):207–213.
Wikipedia. Wallpaper group. http://www.wikipedia.org.
COMPUTATIONAL SYMMETRY VIA PROTOTYPE DISTANCES FOR SYMMETRY GROUPS CLASSIFICATION
93
