
PROTECTING PRIVATE DATA ON MOBILE SYSTEMS
BASED ON SPATIO–TEMPORAL ANALYSIS
Sausan Yazji
1
, Robert P. Dick
2
, Peter Scheuermann
1
and Goce Trajcevski
1
1
EECS Dept., Northwestern University, Evanston, IL 60208, U.S.A.
2
EECS Dept., University of Michigan, Ann Arbor, MI 48109, U.S.A.
Keywords:
Mobile security, Trajectory analysis.
Abstract:
Mobile devices such as smart phones and laptops are in common use and carry a vast amount of personal data.
This paper presents an efficient behavior-based system for rapidly detecting the theft of mobile devices in order
to protect the private data of their users. Our technique uses spatio-temporal information to construct models
of user motion patters. These models are used to detect theft, which may produce anomalous spatio-temporal
patterns. We consider two types of user models, each of which builds on the relationship between location
and time of day. Our evaluation, based on the Reality Mining dataset, shows that our system is capable of
detecting an attack within 15 minutes with 81% accuracy.
1 INTRODUCTION
Mobile devices such as smart phones, iPhones, and
laptops are used in a number of applications, includ-
ing email, text messaging, gaming, web browsing,
navigation, and recording pictures/videos (Thornton
and Houser, 2004). Such devices are also used for fi-
nancial transactions including Mobile Money (Chen,
2008), which is extensively used in China and Japan.
Mobile computing devices store a lot of personal in-
formation and, if stolen, loss of control over these data
may be even more important than loss of the mobile
device.
Some prior work on mobile device security has fo-
cused on physical aspects and/or access control (e.g.,
strong passwords, voice recognition, or fingerprints).
However, such approaches do not protect the private
data on stolen devices in the post-authentication state.
Many mobile devices (e.g., from Apple, Blackberry,
Sony Ericsson, and Nokia) are equipped with loca-
tion identification tools such as association with a
cellphone tower ID, WiFi, Bluetooth, or Global Posi-
tioning System (GPS) receivers, which can be used to
track location in case of theft. However, existing work
that uses the GPS-feature for the purpose of protect-
ing the users (e.g., GadgetTrak (GadgetTrak, 2010)
and RecoveryCop (Monitoring, 2010)) depend on the
owner to report the theft. It may take hours before the
owner discovers the theft of a device, at which point
private data may have already been violated. Even
Laptop Cop (LaptopCop, 2010), which has the goal
of protecting data on stolen devices by remotely and
manually deleting it, requires user intervention to ini-
tiate this process. In addition, these systems require
cellular connections to protect the data, while our sys-
tem is capable of detecting attacks and reacting with-
out cellular access.
Our main goal is to develop efficient techniques
for protecting data saved on mobile devices. Our ap-
proach is based on detecting the spatio-temporal be-
havior of intruders, which may be anomalous com-
pared to the regular motion patters of owners. In
a previous study (Yazji et al., 2009), we used net-
work access patterns and file system activities to build
a behavioral model that permitted attack detection
with a latency of 5 minutes and an accuracy of 90%.
We investigate the complementary approach of using
spatio-temporal information and trajectory analysis to
model user behavior and support anomaly detection.
There has been recent research (Sun et al., 2007;
Hall et al., 2005; Yan et al., 2009) on mobility-based
intrusion detection. To the best of our knowledge,
ours is the first such technique to use spatio-temporal
information and trajectory analysis to enable detec-
tion of an attack in 15 minutes and with 81% accu-
racy. The simple data structure used to model the
users spatio-temporal behavior – 2-dimensional and
3-dimensional matrices – enables efficient lookup-
based attack detection.
The rest of this paper is organized as follows. Sec-
114
Yazji S., P. Dick R., Scheuermann P. and Trajcevski G. (2011).
PROTECTING PRIVATE DATA ON MOBILE SYSTEMS BASED ON SPATIO–TEMPORAL ANALYSIS.
In Proceedings of the 1st International Conference on Pervasive and Embedded Computing and Communication Systems, pages 114-123
DOI: 10.5220/0003373301140123
Copyright
c
SciTePress

tion 2 describes related work. Section 3 introduces the
system architecture and detection techniques. Section
4 presents evaluation of our technique. Section 5 con-
cludes the paper and indicates possible directions for
future work.
2 RELATED WORK
Spatio-temporal data management and efficient query
processing techniques have been the topics of in-
tensive research in the field of Moving Objects
Databases (G
¨
uting and Schneider, 2005). In par-
ticular, trajectory analysis and similarity detection
have yielded numerous research results in the recent
years (Dodge et al., 2009; G
´
omez et al., 2008; Je-
ung et al., 2008). Several results from this arena
have goals similar to ours. For example, Mouza and
Rigaux (Mouza and Rigaux, 2005) propose regular
expression based algorithms for detecting mobility
patterns. However, those patterns do not explicitly
model the temporal dimension of the motion, i.e., the
focus is more on routes than trajectories. Hadjieleft-
heriou (Hadjieleftheriou et al., 2005) describe effi-
cient indexing techniques and refinement algorithms
for processing spatio-temporal pattern queries. The
main distinction of our work is the use of probabilistic
location-in-time patterns, which establish a threshold
for detecting anomalous behavior.
The importance of adding semantic information
to trajectory data has been previously recognized.
For example, in order to improve application aware-
ness during trajectory data analysis, Alvares (Alvares
et al., 2007) proposed adding semantic information
during trajectory preprocessing. Hung, Chang, and
Peng (Hung et al., 2009) proposed the complementary
approach of using a probabilistic suffix tree to mea-
sure separation among users trajectories. Xie, Deng,
and Zhou (Xie et al., 2009) addressed the problem of
predicting social activities based on users trajectories.
In addition, Trestian (Trestian et al., 2009) used as-
sociation rule mining to investigate the relationships
between geographic locations and use habits for mo-
bile devices. In this work, we introduce two types of
mobility models and combine them for efficient de-
tection of anomalous use.
Some intrusion detection research has objectives
similar to ours, but differs in approach. Sun (Sun
et al., 2007) proposed mobile intrusion detection
based on the Lempel–Ziv compression algorithm and
Markov Chains. The proposed technique used three-
level Markov Chains, and did not consider the as-
sociation between time of the day and the location.
Their ability to detect attack using the proposed tech-
nique is limited to the times at which the user is mak-
ing phone calls and moving faster than 60 miles per
hour. Yan (Yan et al., 2009) improved on this work,
yet the delay in detecting attack was 24 hours, since
the traces were obtained once a day, with a sampling
period of 30 minutes. Our technique has an attack
detection latency of 15 minutes. Hall, Barbeau, and
Kranakis (Hall et al., 2005) proposed an intrusion de-
tection method based on mobility traces. Their focus
was on public transportation traces in which the paths
are pre-defined. Their results are inapplicable for de-
tecting attacks based on individual motion patterns.
3 SYSTEM ARCHITECTURE
We now explain the main results of our work. First,
we explain our detection system. We then describe
techniques for data collection and feature extraction
and present two user models for anomaly detection.
The main objectives of this work are to
1. develop efficient algorithms for deriving user
models from spatio-temporal information and tra-
jectory analysis;
2. determine the accuracy with which users can be
distinguished using such models; and
3. ideally achieve a high detection accuracy with low
latency and low energy cost.
The methodology proposed in this paper is based
on the following observations:
• most mobile systems have location identification
tools and can gather location traces;
• each individual typically has a small set of loca-
tions that are visited with high frequency, e.g., ev-
ery day (Gonz
´
alez et al., 2008); and
• individuals tend to take the same paths when mov-
ing among particular locations (Gonz
´
alez et al.,
2008).
3.1 System Components
The system for automatic generation of mobility
models and detection of spatio-temporal behavioral
anomalies has the following main modules:
1. data collection,
2. feature extraction,
3. user profile building, and
4. anomaly detection.
Figure 1 illustrates the integration of these mod-
ules into the system architecture, which consists of
the following sub-systems.
PROTECTING PRIVATE DATA ON MOBILE SYSTEMS BASED ON SPATIO-TEMPORAL ANALYSIS
115

Information
capturing system
Information
management system
Log mobile location
information
Send log files to
information
management system
Analyze data
Build user profile
Perform anomaly
detection
Log data
Information
capturing system
Information
management system
Perform feature
extraction
User profile
model
OK?
Trigger an alert
Yes
No
Response management system
Receive the alert
Take appropriate
action
Alert
Figure 1: System architecture.
• (ICS) – the information capturing system, resid-
ing on the mobile device, which contains an ap-
plication to track the device location, register it
periodically, and save it in a new log file every
T minutes. It also contains the feature extraction
module.
• (IMS) – the information management system,
which collects the log-files from the ICS and re-
sides on a computer with higher performance and
much looser power consumption constraints than
the mobile device. It is responsible for building
mobility models and performing anomaly detec-
tion. Upon building the user model, the IMS sends
it to the mobile device, allowing the detection of
attacks in the absence of wireless connection, at
some computation power consumption penalty.
• (RMS) – the response management system, which
resides on both the mobile device and the remote
server that hosts the IMS. Upon receiving an alert,
the RMS identifies the appropriate action to pro-
tect data on the mobile device, e.g., notifying the
device owner, locking the device, or automatically
deleting private data.
In this paper, we focus on the algorithms and im-
plementation details for the ICS and the IMS mod-
ules, since the RMS consists of user-dependent ac-
tions that should be executed in case an attack is de-
tected.
3.2 Data Collection and Feature
Extraction
Motion traces are essential for model construction and
anomaly detection. We considered human motion
data which is
• continuous: collected for a long period of time
continuously;
• consistent: collected at the same time every day;
and
• frequent: collected at a high enough frequency to
support fast anomaly detection.
The sampling frequency used by Gonz
´
alez
(Gonz
´
alez et al., 2008) was too low for our applica-
tion. The openStreetMap (OSM, 2010) data, as well
as the data used by Rhee (Rhee et al., 2008), were
neither continuous nor consistent. Hence, we used
the Reality Mining data set (Eagle et al., 2007), which
contains data for over 100 users during a nine-month
period. It consists of phone calls logs, locations iden-
tified by tower IDs and area IDs, application usage
logs, and device-specific data. The data collection in-
terval ranged from a few seconds to 15 minutes, with
an average of 2.5 minutes, except when the mobile
device was off.
Our spatio-temporal analysis techniques depends
on extracting the following features from the Reality
Mining log: (1) User ID u
i
; (2) Location information
l
j
, represented by the area ID in the traces; and (3)
Timestamps t
k
of the data records in the trace. Thus,
our input data records are tuples of the form (u
i
, l
j
,t
k
).
We developed and evaluated two modeling tech-
niques for anomaly detection: Model #1 considers
time–location relationships and Model #2 considers
time–location sequences of recently visited locations.
We relate the anomaly detection rate to the total num-
ber of distinct locations for each user, based on which
we propose a method to adaptively select the best
model.
In the next section, we describe each of the models
in greater detail.
3.3 Model #1:
Spatio-temporal Information
In Model #1, for each user u
i
, we extract the location
l
j
and timestamp t
k
. For conciseness, we will some-
times neglect notation for user ID when it is clear
from the context.
PECCS 2011 - International Conference on Pervasive and Embedded Computing and Communication Systems
116

3.3.1 Building User Profile
Our goal is to protect private data on mobile devices
by detecting attacks based on identification of unac-
ceptable deviation from the user’s normal behavior.
Our first step is to behaviorally model each user’s nor-
mal behavior. To build the user profile for the 100
users in the reality mining data set, we divided the
data evenly into two consecutive series: model data
(used for model construction) and test data (used for
evaluation).
Utilizing the model data, user profile was con-
structed as follows.
1. Build a list of the user’s distinct locations (L
i
).
2. Extract from the distinct location list the user’s
common locations list (UCL
i
), which consists of
locations the user visited more than 1% of the time
during the data collection period.
3. Construct the LOC-IN-TIME
i
table for a 24 hours
time period using one-minute intervals. Each en-
try LOC-IN-TIME
i
( j, k) is the weighted probabil-
ity value Prob
i
(l
j
,t
k
), which represents the frac-
tion of time in the model data the user u
i
was at
location l
j
at time t
k
, where 1 ≤ j ≤ |UCL
i
|, and
1 ≤ k ≤ NT .
As explained above, UCL
i
denotes the set of loca-
tions visited by u
i
more than 1% of the time during the
data collection period, and NT denotes the number of
one-minute intervals.
At any given time t
k
, the user u
i
should be at only
one location l
j
from the location list L
i
. Therefore
the total probability value calculated for that time of
the day should always be equal to one. The weighted
probability value of (Prob
i
(l
j
,t
k
)) is the probability of
user u
i
being at location l
j
at time t
k
, divided by the
number of records in the model data set that represent
the locations in the UCL
i
.
The profile construction process is formally de-
scribed in Algorithm 1. This process is repeated for
each user, as shown in Line 3. The first step is to
constructs a list of all locations visited by user u
i
,
as shown in Line 4. In Line 8m we calculate the
weighted probability value. All locations that have
been visited less than 1% of the time are excluded as
explained in Lines 9–12. In Line 13, P
trust
is calcu-
lated as described in Section 3.3.2.
Figure 2 shows the profile for user u
i
. The user
profile is a two-dimensional matrix with (|UCL| ×
NT ) elements. Rows correspond to minutes of the
day and columns correspond to locations.
Algorithm 1: Build User Profile based on Spatio-temporal
Information.
1: INPUT: model data log
2: OUTPUT: user Profile LOC-IN-TIME
3: for all users u
i
do
4: Read each record in the model data log
5: Identify the list of distinct locations (L
i
) visited by
the user
6: Build the infrequent location list (IF
i
) where
7: if
∑
l
j
records ≤ 1% size of model data then
8: l
j
∈ IF
i
9: end if
10: Let RP represents the total number of records in the
model
data where l
j
∈ IF
i
11: Build list of the user common locations UCL
i
= L
i
−
IF
i
12: Allocate space for table LOC-IN-TIME
i
with UCL
i
columns and NT rows
13: Calculate the weighted probability value
14: LOC-IN-TIME
i
( j, k)=Prob
i
(l
j
,t
k
)/(size of
(model data) − RP)
15: Calculate the (P
trust
) value for each user
16: end for
Figure 2: User profile for Model #1.
3.3.2 Anomaly Detection
Attacks are detected via mismatches between limited-
duration spatio-temporal traces and the model of nor-
mal user behavior, yielding an attack detection la-
tency ≤ T . When the probability of a specific trace
being generated by the user model drops below the
Trust value (P
trust
), our system concludes that the mo-
bile device is used by someone other than its owner.
To calculate the P
trust
associated with a given
user profile we used the test data set. We ran-
domly selected 100 samples (S
1
, S
2
, ..., S
100
) from the
test data, for which the time span is T minutes. A
random sample S
m
of span T corresponds to a con-
tiguous sequence of records: (u
i
, l
j
,t
k
), (u
i
, l
j
1
,t
k
1
),
···, (u
i
, l
j
x
,t
k
x
), ···, (u
i
, l
j
n
,t
k
n
) satisfying conditions
t
k
≤ t
k
1
··· ≤ t
k
x
··· ≤ t
k
n
and (t
k
n
−t
k
) = T .
PROTECTING PRIVATE DATA ON MOBILE SYSTEMS BASED ON SPATIO-TEMPORAL ANALYSIS
117

Sm
S100
SP1=0.08% SP2=0.083% SP3=0.089% SPm=0.0 % SP100=0.098%
t”1 t”2 t”n
S1
t1 t2 t5
AAAAA
S2
t’1t’2 t’9
A A C C C C C CB
S3
A B B B B C C
D D C C C
D A A A
Trace Sequence
S1
T T T T T
S2
S3
Sm
S100
Figure 3: Example of calculating P
trust
value.
Table 1: System Sensitivity to False Rejection Rate.
FRR 0% 10% 20% 50% 80% 100%
FAR 28.5% 19.4% 14.9% 11.6% 1.2% 0%
Figure 3 illustrates a T -duration trace sequence
containing 100 samples. The number of records per
sample varies among samples due to variation in data
collection interval. For each sample S
m
, we calculate
the cumulative probability SP
m
of the records in the
sequence using the probability distribution table es-
tablished on the model data representative of the user
u
i
as follows:
SP
m
=
∑
( j,k)∈S
m
LOC-IN-TIME
i
(l
j
,t
k
). (1)
Most SP values are similar with few outliers (see
Figure 3). Selecting P
trust
equal to the smallest SP
value of zero implies no tolerance of false rejection,
resulting in a False Acceptance Rate (FAR) of 100%.
In contrast, if we have no tolerance for errors, then
P
trust
should equal the highest SP value that would re-
sult in a very low FAR, thus producing a very high
False Rejection Rate (FRR). We use a P
trust
result-
ing in an FRR of 10% based on sensitivity study re-
sults, in which we selected different FRR values, and
calculated the P
trust
and the FAR. Table 1 shows the
sensitivity results.
After calculating the P
trust
for each user, the
anomaly detection process can start. Algorithm 2
gives a formal description of the anomaly detection
algorithm. Upon receiving the user trajectory in
Line 2, the system initializes the cumulative proba-
bility value T P for the received trajectory as shown in
Line 5. In Lines 6–11, the system calculates the T P
value based on every l
j
in the trajectory. In Line 13,
the system compares the T P value with the P
trust
in
order to detect anomalous behavior.
Algorithm 2: Detect Mobile Theft based on Location Infor-
mation.
1: INPUT: LOC-IN-TIME
i
2: INPUT: User trajectory every T minutes
3: OUTPUT: Alarm in case of attack
4: Initialize the Trajectory Probability value T P
i
5: T P
i
= 0
6: for all l
j
in the obtained trace do
7: if l ∈ UCL
i
> 0 then
8: Get the probability value LOC-IN-TIME
i
(l
j
,t
k
)
value
9: Calculate the cumulative probability value for the
trace T P
i
= T P
i
+ LOC-IN-TIME
i
(l
j
,t
k
)
10: end if
11: end for
12:
13: if T P
i
≤ P
trust,i
then
14: Trigger an alarm
15: end if
3.4 Model #2: Trajectory Analysis
The main feature of Model #2 is that it considers the
probabilities of moves implicitly contained in the se-
quence of (time, location) points visited by the user
in the model data. Conceptually, the user’s location–
duration trace is divided into sequences, i.e., trajecto-
ries. Each trajectory consists of a start point, a num-
ber of intermediate points, and an end point, and may
differ semantically due to the notion of stopping time
STP.
• Stopping Point. (STP) is the time interval for
which the user is stationary. Based on observa-
tions from other researchers (Xie et al., 2009), we
use STP = 30 minutes for all users.
• Start Point. (SSP) = (u
i
, l
j
,t
k
) is the first location
identified in the sequence where (t
k
−t
k−1
) ≥ STP.
• Intermediate Point. (SIP) = (u
i
, l
j
x
,t
k
x
) is a point
in the sequence where t
k
x
> t
k
and (t
k
x
−t
k
) ≤ T .
• End Point. SEP = (u
i
, l
j
n
,t
k
n
) is the last location
identified in the sequence where (t
k
n+1
− t
k
n
) ≥
STP.
3.4.1 Building User Profile
During user profile construction, the Model #1 fea-
ture extraction technique is used (see Section 3.3)
and the list UCL
i
is constructed as described in Al-
gorithm 1. However, for Model #2, the user pro-
file is a three-dimensional table LOC-TIME-MOVE of
size (|UCL| × |UCL| × NT). Each entry in this table,
LOC-TIME-MOVE
i
( j, j
1
, k, k
1
), represents the proba-
bility of the user u
i
moving from location l
j
at time t
k
to location l
j
1
at time t
k
1
.
PECCS 2011 - International Conference on Pervasive and Embedded Computing and Communication Systems
118
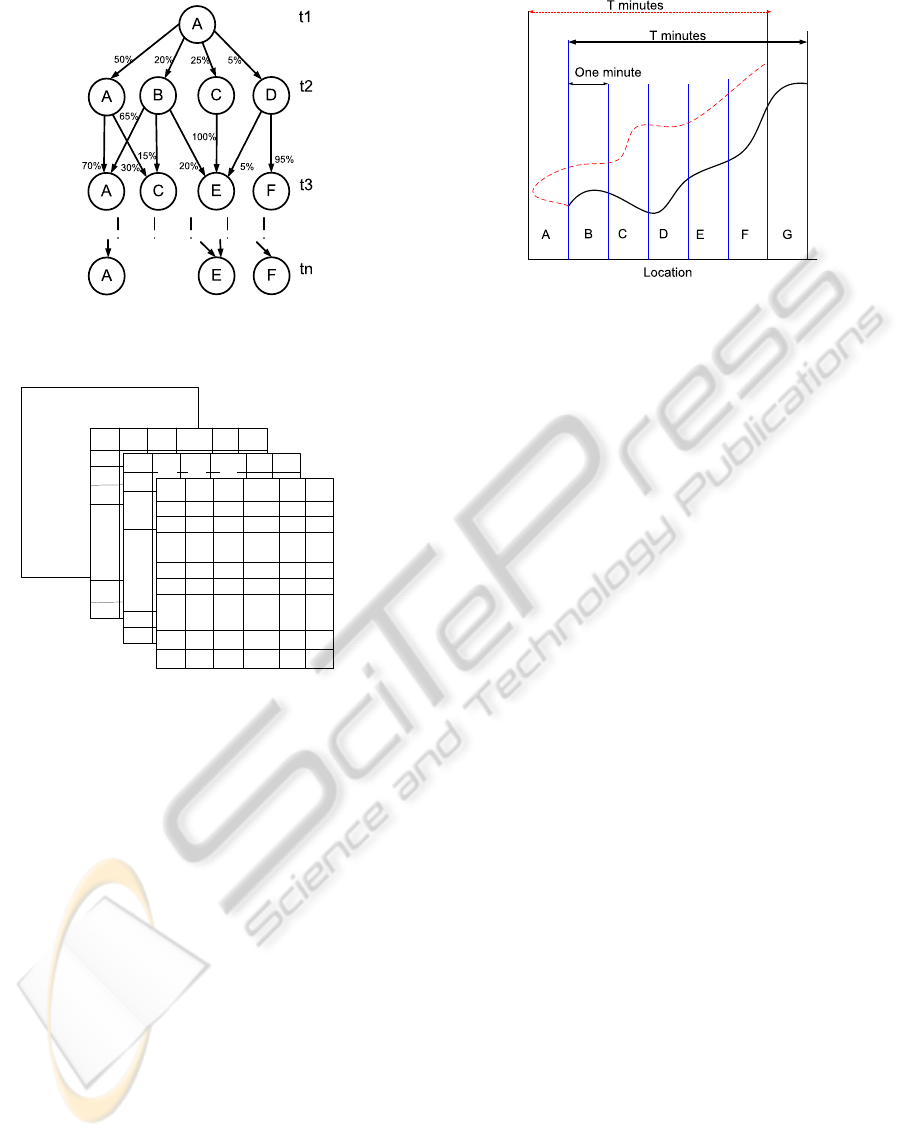
Figure 4: State graph representing the user sequences when
the user starts at location A at time t
1
.
Start Location = A
Start Location = B
Start Location = C
Start Location = N
Minute =1
Minute =2
Minute =3
Minute=1440
Minute=1439
A B C N
0.03
0.03
0
0.001
0.001
0
0
0
0.005
0.005
0.09
0.08
0.01
0.003
0.003
0
0
0
0
0
0.02
0.01
0.01
0.009
0.008
Minute =t2
Minute =t3
0.5
0.7
0.2 0.25
0
0.3
0 0
0 0
Figure 5: Mobility model for user u
i
(Model #2).
Similarly to the corresponding struc-
ture used in Section 3.3, each entry
LOC-TIME-MOVE
i
( j, j
1
, k, k
1
) represents the
weighted probability of Prob
i
(l
j
→ l
j
1
, t
k
→ t
k
1
).
Figure 4 presents an example of a trace of sequence
information. Figure 5 shows the user profile data
structure.
3.4.2 Anomaly Detection
The computation of trust values (P
trust
) for each user is
similar to that described in Section 3.3; however, for
the Model #2 we calculate the joint probability value
for each trace rather than the cumulative probability
value as follows:
SP
m
=
∏
( j, j
1
,k,k
1
)∈S
m
LOC-TIME-MOVE
i
( j, j
1
, k, k
1
). (2)
The joint probability value is the product of the prob-
abilities of all records in the trace, as indicated in the
LOC-TIME-MOVE table. Equation 2 indicates that if
any record in the sequence has a probability of zero,
Figure 6: User path analysis.
which indicates that the user has never been at that lo-
cation at that time, the trace will be considered an at-
tack. To reduce the penalty of deviation from the nor-
mal path, we introduce the concept of Trace Threat
Level (TL), which represents the percentage of the
sequence that has no representation in the user pro-
file. Thus, if LOC-TIME-MOVE
i
( j, j
1
, k, k
1
) = 0, we
eliminate this value from the calculation of the trace
joint probability value, and increase the threat level
value by one. We use a threat level threshold of T L
trust
= 10% of the total records in the trace, based on em-
pirical analysis.
As an example, Figure 6 shows two paths. The
solid curve represents the normal path in the user’s
profile and the dashed curve represents the currently
detected trajectory. In this example, the user pro-
file indicates that when the starting point at time
t is location B, the normal path of duration T is
B→C→D→E→F→G. In contrast, the captured user
trajectory that starts at location B at time t consists
of the sequence B→A→B→C→D→E→F. To deter-
mine whether this is an expected or anomalous user
behavior, we compare the calculated probability of
this path with the profile of the particular user. The
calculated value should be equal to or greater than the
trust value for that user.
To calculate the captured trace joint probability
T P, we first identify the starting point SSP = l
j
and
the time t
k
. Then we check whether l
j
∈ UCL
i
or
not. If not, we increase the value of the threat level
TL. Otherwise, we identify the next location l
j
1
at
time t
k
1
. If l
j
1
∈ UCL
i
, we obtain the joint proba-
bility value LOC-TIME-MOVE
i
( j, j
1
, k, k
1
). If not,
we increase the TL value again. This process is re-
peated for the entire sequence and, upon completion,
if TL ≥ TL
trust
, this sequence is judged to have been
generated by someone other than the user, i.e., an at-
tacker. If not, we subsequently check the TP value.
If TP ≥ P
trust
, the sequence is judged to belong to the
user; otherwise, it is treated as a sequence generated
PROTECTING PRIVATE DATA ON MOBILE SYSTEMS BASED ON SPATIO-TEMPORAL ANALYSIS
119
Algorithm 3: Detect Mobile Device Attack based on User
Trajectory.
1: INPUT: LOC-TIME-MOVE
i
2: INPUT: User trajectory every T minutes
3: OUTPUT: Alarm in case of attack
4: Initialize the Trace Probability (T P
i
) and Trace Threat
Level (T L
i
) values
5: T P
i
= 1, T L
i
= 0
6: for all n records in the sequence do
7: Read l
j
at time t
k
and l
j
1
at time t
k
1
8: if ((l
j
) and (l
j
1
)) ∈ UCL
i
> 0 then
9: calculate the joint probability value T P
i
= T P
i
×
LOC-TIME-MOVE
i
( j, j
1
, k, k
1
)
10: else
11: T L
i
= T L
i
+ 1
12: end if
13: end for
14: Check for anomaly
15: if (T L
i
≤ T L
trust,i
)and(T P
i
≥ P
trust,i
) then
16: Continue
17: else
18: Trigger an alarm
19: end if
by an attacker. A formal description of this anomaly
detection technique is presented in Algorithm 3.
4 EXPERIMENTAL RESULTS
We now describe the experimental setup and present
the results from the evaluation of our techniques.
As discussed in Section 3, we used the Reality
Mining mobility traces of students and staff at a ma-
jor university. The traces had the following sources:
60% graduate students, 27% incoming students at the
university’s business school, and 8% staff. The num-
ber of distinct locations per user ranges from 1–100,
with an average of 28. We eliminated single-location
users and those with fewer than 1,000 records (i.e.,
3.5 records per day) because it was not possible to
build models for users with very few records, leaving
93 users.
Each user log was divided into training
(model data) and testing (test data) portions as
described in Section 3.3. For each user, we randomly
selected 100 duration T samples from the test data
log. We repeated each test for four different T values
(5 min, 15 min, 30 min, and 60 min). The T value is
the attack detection latency.
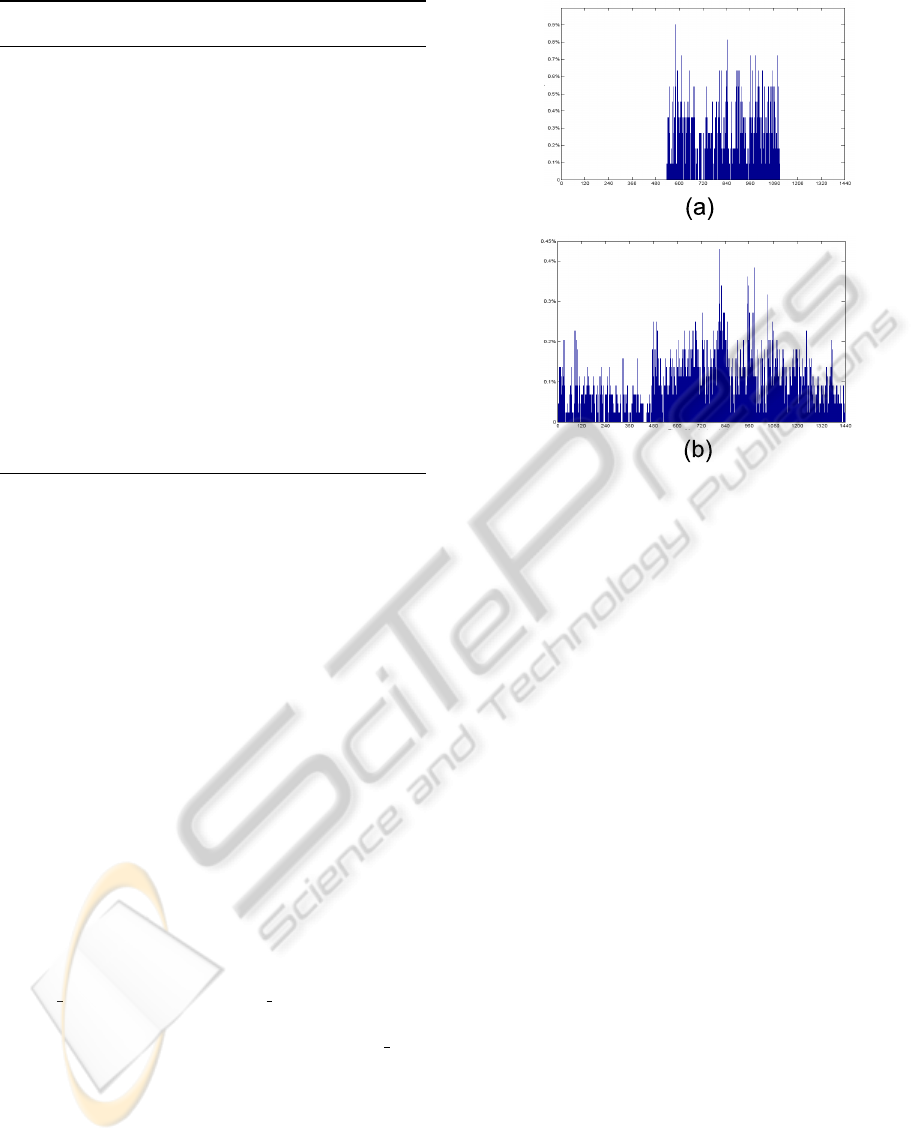
ProbabilityProbability
Time of the day in minutes
Time of the day in minutes
Figure 7: 24-hour probability distribution diagram of loca-
tion ID=1 for (a) user u
1
and (b) user u
74
based on 9 months
of data.
4.1 Results for Spatio-temporal Model
(Model #1)
For each of the 93 users, we constructed models and
calculated trust values P
trust,i
following the steps de-
scribed in Section 3.3. Attacker behavior traces are
not presently available. However, traces for differ-
ent users are available. We evaluated the probability
of detecting the anomalous mobility patterns of other
“Reality Mining” study participants.
The limited number of locations, and the fact that
around 68% of the study participants worked in the
same set of locations (buildings), but different rooms
and floors (lab, library, office, etc.) made this a chal-
lenging dataset for motion-based anomaly detection.
Using the area ID rather than the cellphone tower ID
during feature extraction was necessary to enable this
study. Figure 7 shows that users sharing the same lo-
cations in their profiles can have very different proba-
bility distributions over a 24-hour period. Figure 7(a)
shows the probability distribution for user u
1
and lo-
cation ID = 1, while Figure 7(b) shows the probability
distribution of the same location ID = 1 over 24 hours
for the user u
74
.
We calculated the T P
m,y
value for all 100 test sam-
ples for each user u
y
where x 6= i and 1 ≤ m ≤ 100.
Subsequently, we calculated the FAR
y
value that rep-
resents the percentage of the test samples for which
the total probability value is T P
m,y
≥ P
trust,i
. Figure
PECCS 2011 - International Conference on Pervasive and Embedded Computing and Communication Systems
120
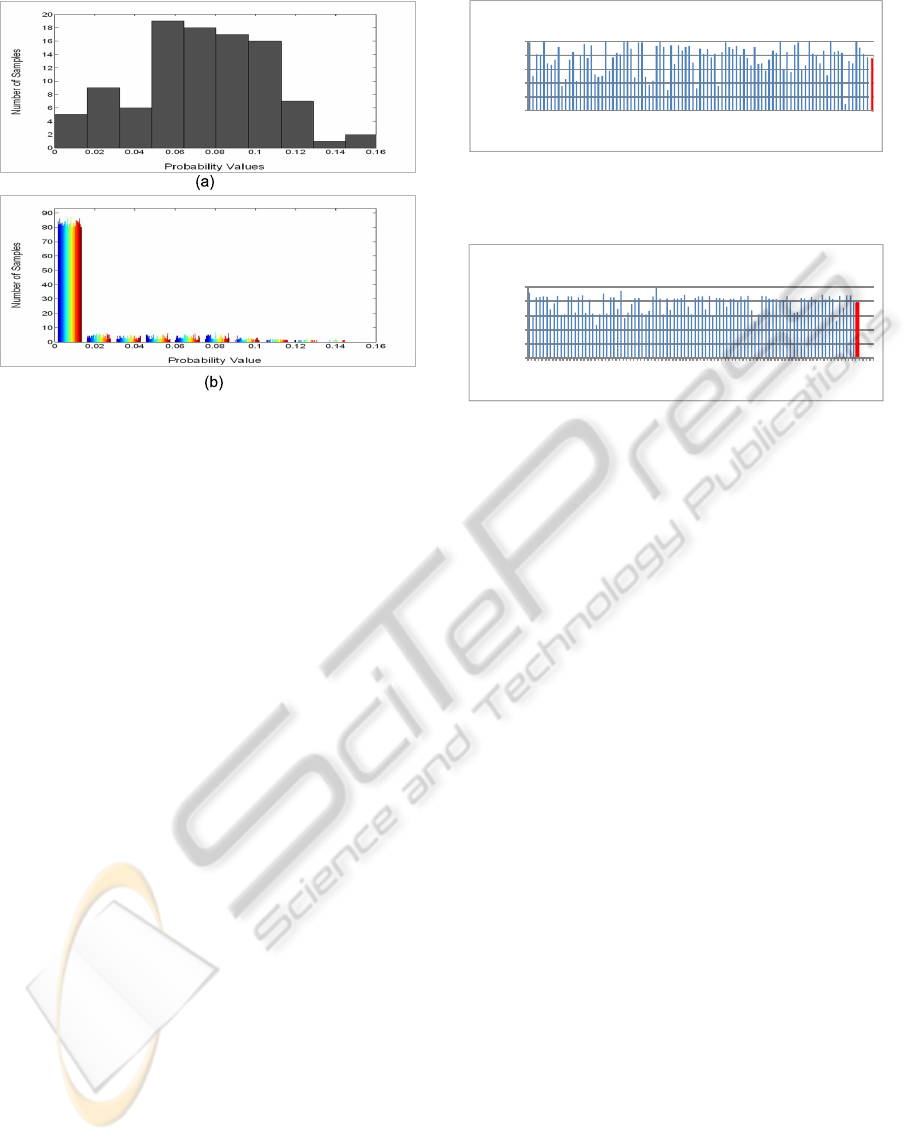
Figure 8: Histogram of total probability T P
m,y
for the 93
users and 100 test samples when (a)y = i = 30, and (b) y 6= i,
and i = 30.
8 illustrates the T P
m,y
results for a randomly selected
user u
30
. Specifically, Figure 8(a) shows the proba-
bility distribution of T P
m,30
, where y = i = 30. Fig-
ure 8(b) shows the probability distribution of T P
m,y
,
where y 6= i and i = 30. We observed that for user u
30
,
only 5% of the samples have TP
m,30
≤ 0.02, while
more than 80% of the samples for each of the other
92 users have T P
m,30
≤ 0.02.
Figure 9 illustrates the ability to distinguish the
behavior of a given user u
i
from that of the other
92 users, given 100 samples each. The accuracy
is (100 − FAR
y
) when T =5 minutes. For exam-
ple, Figure 11(a) shows that the average accuracy of
Model #1 is in the same range (76.08%–76.6%) for all
sample sizes. Therefore, we conclude that the sample
size does not have a large impact on attach detection
accuracy for Model #1. Figure 11(b) shows a stan-
dard deviation above 20%, which is also clear from
Figure 9, in which detection accuracy for some users
was 100% (e.g., users u
22
, u
27
, u
75
, and u
84
) and in
which others have detection accuracies ranging from
9%–47% (e.g., u
10
, u
20
, u
47
, and u
88
). High accuracy
is possible for users with few distinct locations (3–8).
Accuracy is low for users with many distinct locations
(69–100). Section 4.3 provides more details.
4.2 Results based on Trajectory
Analysis (Model # 2)
We followed the same steps described in the previ-
ous section to calculate FAR
y
values. Figure 10 shows
the results of the trajectory analysis for different test
sample lengths. In Model #2, detection accuracy is
0%
20%
40%
60%
80%
100%
User ID
Accuracy in detecting attack ‐ Spatio – Temporal Analysis
T= 5 minutes, and FRR=10%
1 4 7
10 13 16 19 22 25 28 31 34 37 40 43 46 49 52 55 58 61 64 67 70 73 76 79 82 85 88 91
Avg
Figure 9: Accuracy in detecting theft according to allowed
delay using the spatio-temporal model (Model #1).
0%
20%
40%
60%
80%
100%
User ID
1 4 7
10 13 16 19 22 25 28 31 34 37 40 43 46 49 52 55 58 61 64 67 70 73 76 79 82 85 88 91
Avg
Accuracy in detecting attack Trajectory Analysis
T= 5 minutes, and FRR=10%
Figure 10: Accuracy in detecting theft according to allowed
delay using the trajectory-based model (Model #2).
affected by test sequence length, with T = 15 min-
utes yielding the highest accuracy and T = 60 min-
utes yielding the lowest accuracy (see Figure 11(a)).
Lower P
trust
values are associated with the longer
traces, which indicates that it is uncommon for nor-
mal users to make large day-to-day changes in motion
patterns affecting short intervals within a trace. How-
ever, longer intervals are more likely to change from
day to day.
4.3 Model Comparison
As illustrated in Figure 11(a), the average accuracy
is slightly better for Model #2 than for Model #1 for
small sample intervals (less than 30 min). However,
the standard deviation is significantly better, as shown
in Figure 11(b). It can be observed that there is im-
provement in accuracy for users with many distinct
location and degradation in accuracy for users with
few distinct locations. Hence, Model #1 is more ac-
curate in the cases when the users have few distinct lo-
cations and Model #2 is more accurate for users with
many distinct locations. Thus, a combined approach
might be useful.
NL is the discrete location count threshold at
which Models #1 and #2 have equal accuracies. If the
size of UCL
i
≤ NL, then Model #1 should be used.
Otherwise, Model #2 should be used. To determine
NL, we tested a combined approach with several val-
ues (5, 6, 7, · · · , 30), where 28 is the average num-
ber of distinct locations in the data set. Figure 12
illustrates the average accuracies for each NL value
depending on time T. NL = 10 allowed the highest
PROTECTING PRIVATE DATA ON MOBILE SYSTEMS BASED ON SPATIO-TEMPORAL ANALYSIS
121
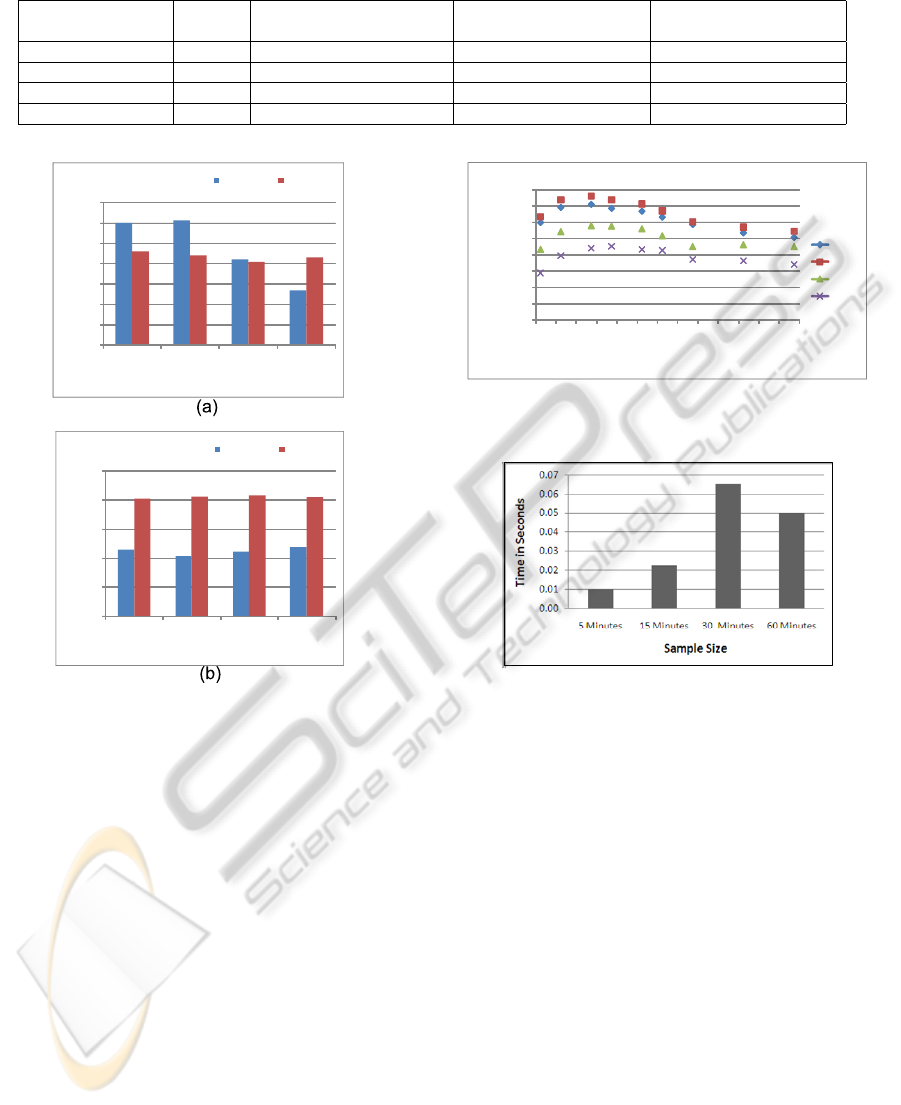
Table 2: Comparison with Existing Theft Detection Systems.
Our Gadget- Recovery Laptop
System Trak (GadgetTrak, 2010) Cop (Monitoring, 2010) Cop (LaptopCop, 2010)
Detection Latency 15 min N/A N/A N/A
Accuracy 81% N/A N/A N/A
Data Protection Yes No No Yes
User Intervension No Yes Yes Yes
72%
73%
74%
75%
76%
77%
78%
79%
5Minutes 15Minutes 30Minutes 60Minutes
DetectionAccuracy
SizeofTe s t TimeSample
Model#2 Model#1
0%
5%
10%
15%
20%
25%
5Minutes 15Minutes 30Minutes 60Minutes
StandardDiviation
SizeofTe s t TimeSample
Model#2 Model#1
Figure 11: Average (a) accuracy and (b) standard deviation
values for Models #1 and #2.
accuracy: 80.59% when T = 15 minutes. Therefore
our recommendation is to use a combined approach
to permit
• faster detection if there are few distinct locations
and
• lower energy consumption due to decreased cal-
culations.
5 CONCLUDING REMARKS
We presented an approach for detecting anomalous
use of mobile devices. Our system uses spatio-
temporal mobility data to build models that have high
anomaly detection accuracy. Combining the spatio-
temporal model (for users with few locations) and
trajectory-based model (for users with many loca-
tions) allowed an average attack detection rate of
81%, with a latency of 15 minutes. The simplicity
73%
74%
75%
76%
77%
78%
79%
80%
81%
5 7 9 11131517192123252729
Accuracy
NumberofDistinctLocations
5min
15min
30min
60min
Figure 12: Detection accuracy according to number of dis-
tinct locations.
Figure 13: Anomaly detection elapsed time according to
sample interval.
of the resulting user models resulted in an efficient
anomaly detection process supporting an average de-
tection time 0.02 seconds, as shown in Figure 13. A
comparison between our results and those of existing
systems is given in Table 2.
In the future, we plan to expand this study to
cover additional mobile computing data sources such
as phone and application logs in order to determine
the change in detection accuracy when more user-
specific data are acquired.
ACKNOWLEDGEMENTS
We thank Prof. Ruoming Jin for his insightful com-
ments. This work was supported in part by the Na-
tional Science Foundation under awards TC-0964545,
CNS-0720691, CNS-0347941, and CNS-0910952.
PECCS 2011 - International Conference on Pervasive and Embedded Computing and Communication Systems
122

REFERENCES
Alvares, L. O., Bogorny, V., Kuijpers, B., de Macedo,
J. A. F., Bart, B., and Vaisman, A. (2007). A model for
enriching trajectories with semantic geographical in-
formation. In GIS ’07: Proceedings of the 15th Inter-
national Symposium on Advances in Geographic In-
formation Systems. ACM.
Chen, L. D. (2008). A model of consumer acceptance
of mobile payment. International Journal of Mobile
Communications, 6(1):32–52.
Dodge, S., Weibel, R., and Forootan, E. (2009). Revealing
the physics of movement: Comparing the similarity of
movement characteristics of different types of moving
objects. Computers, Environment and Urban Systems,
33(6):419–434.
Eagle, N., Pentland, A., and Lazer, D. (2007). Infer-
ring social network structure using mobile phone data.
Proceedings of the National Academy of Sciences
(PNAS), 106(36):15274–15278.
GadgetTrak (2010). GadgetTrak System. http://www.
gadgettrak.com/.
G
´
omez, L. I., Kuijpers, B., and Vaisman, A. (2008). Query-
ing and mining trajectory databases using places of
interest. In Annals of Information Systems, volume 3.
Gonz
´
alez, M. C., Hidalgo, C. A., and Barab
´
asi, A. L.
(2008). Understanding individual human mobility
patterns. Nature, 453:479.
G
¨
uting, R. H. and Schneider, M. (2005). Moving Objects
Databases. Morgan Kaufmann.
Hadjieleftheriou, M., Kollios, G., Bakalov, P., and Tsotras,
V. J. (2005). Complex spatio-temporal pattern queries.
In VLDB 05: Proceedings of the 31st International
Conference on Very Large Databases. ACM.
Hall, J., Barbeau, M., and Kranakis, E. (2005). Anomaly-
based intrusion detection using mobility profiles of
public transportation users. In WiMob’05: Proceed-
ings of the Wireless and Mobile Computing, Network-
ing and Communications. IEEE.
Hung, C., Chang, C., and Peng, W. (2009). Mining tra-
jectory profiles for discovering user communities. In
LBSN ’09: Proceedings of the 2009 International
Workshop on Location Based Social Networks. ACM.
Jeung, H., Liu, Q., Shen, H. T., and Zhou, X. (2008). A
hybrid prediction model for moving objects. In ICDE
’08: Proceedings of the 2008 IEEE 24th International
Conference on Data Engineering. IEEE.
LaptopCop (2010). Laptop Cop Software.
http://www.laptopcopsoftware.com/index.html.
Monitoring, M. S. (2010). Windows mobile security moni-
toring software. http://www.recoverycop.com/index.
html.
Mouza, C. D. and Rigaux, P. (2005). Mobility patterns.
GeoInformatica, 9(4):297–319.
OSM (2010). Open street map. http://www.OpenStreetMap
.org.
Rhee, I., Shin, M., Hong, S., Lee, K., and Chong, S. (2008).
On the Levy-Walk nature of human mobility. In IN-
FOCOM ’08: Proceeding of the IEEE Conference on
Computer Communications. IEEE.
Sun, B., Yu, F., Wu, K., Xiao, Y., and Leung, V. (2007).
Enhancing security using mobility-based anomaly de-
tection in cellular mobile networks. In IEEE Transac-
tions on Vehicular Technology, volume 55, pages 1385
–1396.
Thornton, P. and Houser, C. (2004). Using mobile phones
in education. In WMTE ’04: Proceedings of the 2nd
IEEE International Workshop on Wireless and Mobile
Technologies in Education. IEEE.
Trestian, I., Ranjan, S., Kuzmanovic, A., and Nucci, A.
(2009). Measuring serendipity: Connecting people,
locations and interests in a mobile 3g network. In IMC
’09: Proceedings of the 9th ACM SIGCOMM Confer-
ence on Internet Measurement. ACM.
Xie, K., Deng, K., and Zhou, X. (2009). From trajectories to
activities: a spatio–temporal join approach. In LBSN
’09: Proceedings of the 2009 International Workshop
on Location Based Social Networks, Seattle, Washing-
ton. ACM.
Yan, G., Eidenbenz, S., and Sun, B. (2009). Mobi–
watchdog: You can steal, but you can’t run! In WiSec
’09: Proceedings of the Second ACM Conference on
Wireless Network Security. ACM.
Yazji, S., Chen, X., Dick, R. P., and Scheuermann, P.
(2009). Implicit user re-authentication for mobile de-
vices. In UIC ’09: Proceedings of the 6th Inter-
national Conference on Ubiquitous Intelligence and
Computing, pages 325–339. Springer-Verlag.
PROTECTING PRIVATE DATA ON MOBILE SYSTEMS BASED ON SPATIO-TEMPORAL ANALYSIS
123
