
USING BLENDER TO DESIGN AND IMPLEMENT DATA
VISUALIZATION COMPONENTS FOR X3D AND X3DOM
Mario A. Bochicchio, Antonella Longo and Lucia Vaira
Set-Lab, Department of Innovation Engineering, Universty of Salento, Lecce, Italy
Keywords: Visualization Tools, X3DOM, X3D, Blender, Logic Bricks.
Abstract: We discuss how to use Blender to design and implement data-bound components for Web-based data
visualization. The goal is twofold: to use Blender, with its declarative approach based on the logic brick
programming model, for prototyping data visualization components of Web3D applications, and to test the
advanced visualization capabilities of the new X3DOM framework based on HTML5 and WebGL. In order
to validate the approach we have extended Blender with a software module able to map both Blender
geometries and behaviours (logic bricks) code into X3D and X3DOM code.
1 INTRODUCTION
AND BACKGROUND
X3D has already been proposed for the design of
Web-based Data Visualization with positive
feedbacks (Sopin & Hamza-lup 2010), (Anslow
2008). The recent introduction of WebGL and
X3DOM (Drevensek et al. 2010) has increased the
potential integration between X3D applications and
the other Web technologies and it paves the way for
a new generation of Web3D applications. X3DOM
framework, in fact, aims at extending existing Web
applications adding 3D objects in the Document
Object Model (DOM) of Web pages without the
need of any plugin. Web programmers, in fact, are
attracted by 3D but they are often reluctant about
changing their production environments or their
programming tools. Moreover, Web application
designers don’t have extensive knowledge about
how to design 3D-enhanced applications and how to
describe them in terms of low-level geometric
primitives, spatial transformations, lighting models,
shaders etc. . (Sopin & Hamza-lup 2010).
In this context, the specific issue faced in the
paper is about the tools to design and implement
X3D objects for the Web. It is not straightforward to
select the proper tool for this task, since it must
include advanced 3D modelling, animations,
programming and debugging capabilities. Blender
(www.blender.org) owns several features of these
and it is one of the most rapidly-growing open
environments, with a large supporting community,
but it is not able to create interactive components for
HTML5. In order to cope with this lack, we
extended Blender with GBX, which is a custom
exporter tool, also discussed in the paper.
In the next section we begin with an overview of
the literature, then we discuss some preliminary
aspects about X3DOM and JavaScript performance
limitation. In section 4 we present the internal
structure of GBX, the main considerations about its
effectiveness and limitations and we draw
conclusions.
2 RELATED WORKS
The most straightforward method to create X3D
applications is to write geometric primitives and
scripting logic by means of a text editor. This
method, however, is time-consuming because of the
many low-level aspects required for 3D
programming (Sopin, 2010). For this reason, a
number of authors have proposed different
approaches to support the creation of X3D-based
GUIs. In 2004 D. Arendash proposed to adopt a
successful videogame editor to export X3D
applications (Arendash 2004). The approach is
effective for 3D scenes with animated objects and is
well-supported with new editor releases, but it’s not
general purpose. For example, it is not suitable for
the creation of data-bound 3D components like the
Cone Tree (CT), as proposed in this paper. From a
270
A. Bochicchio M., Longo A. and Vaira L..
USING BLENDER TO DESIGN AND IMPLEMENT DATA VISUALIZATION COMPONENTS FOR X3D AND X3DOM.
DOI: 10.5220/0003373002700273
In Proceedings of the International Conference on Imaging Theory and Applications and International Conference on Information Visualization Theory
and Applications (IVAPP-2011), pages 270-273
ISBN: 978-989-8425-46-1
Copyright
c
2011 SCITEPRESS (Science and Technology Publications, Lda.)

theoretical point of view the adoption of visual
techniques for defining both the geometries and the
behaviors of a 3D world in a declarative way is
explored by(Arjomandy & Smedley 2004), but the
same authors state that to be productive the
environment used to specify the behaviors must be
strictly integrated with the environment used for 3D
modeling. For this reason we have decided to adopt
Blender, that shows an excellent integration between
3D modeling and ‘logic bricks’ programming
approach. In (Pellens et al. 2009) the authors try to
facilitate the design of virtual environments and to
make it more accessible to novice users by means of
behavior patterns and tools for the visual
specification of behavior rules. The approach is very
interesting for high level behaviors (e.g. strategies in
videogames) but, in our opinion, it is less effective
for the simple behaviors (e.g. expand, collapse, …)
needed to create the 3D data-bound components,
discussed in this paper. The bibliography related to
data visualization and database visualization is very
rich, starting from (Shneiderman 1996), that defined
the cone tree concept, used in this paper, and from
(Robertson 1991), that identified important
principles and guidelines for advanced visualization
applications. Two extensive and useful reviews of
techniques for software and data visualization, based
on X3D, are given by (Anslow 2008) and by (Sopin
& Hamza-lup 2010), that also define the reuse
concept. Another relevant step towards Web
technologies is about the integration between the
AJAX technology, WebGIS and X3D, which is
detailed in (Huang & Cheng 2009).
3 X3DOM AND JAVASCRIPT FOR
DATA VISUALIZATION
A lot of authors have proposed the adoption of X3D
for advanced visualization tasks with interesting
results, but the popularity of X3D and related
plugins is low if compared with other multimedia
plugins (e.g. Adobe Flash).
A reason is that the learning curve associated to
3D technologies in general (shaders, physics, 3D-
modeling, animations, rendering, …), and to X3D in
particular, is steep, also due to the lack of open
source, good quality, well documented examples.
We feel that the tight integration between Web3D
and the other Web technologies, led by WebGL, and
similar initiatives, is central to overcome these
problems.
In this strategy, X3DOM plays a central role
because of its ability to include xml-described 3D
components within the DOM of Web pages, while
interactivity, distribution, security, and scripting are
managed through standard web technologies.
Moreover, Web programmers can interact with the
3D objects via DOM events and JavaScript and not
only via the “sensor nodes” and the “routes” of X3D
(Anslow, 2008), or the “shaders” of WebGL. The
advantage is twofold:
• Web programmers can read, modify and adapt
live pages coming from the Web to their own
needs;
• the new 3D extensions are xml-based and,
therefore, they can be easily manipulated with
popular Web environments and technologies
(ASPX, PHP, JSP, …).
In this scenario, the efficiency drawback of
interpreted languages, like ECMAScript (also
known as JavaScript or JS, i.e. the interpreted client-
side language used to manipulate the DOM) can be
critical when large datasets are manipulated. So even
if ECMAScript is easy to use for processing HTML
events, it is not always suitable for 3D graphic
effects, interactions and animations.
In order to estimate this breaking point (i.e. when JS
become insufficient for smooth animations or
responsive pages), we measure the speed
degradation of a JS animated cone trees as a function
of the increasing number of nodes. More
specifically, we ran a set of randomly generated
cone trees with an increasing number of nodes on
different personal computers (we used X3DOM
v1.0, Firefox v4.0 Beta 6, ten different computers
with graphic cards ranging from GeForce Go 6200
to GeForce 9200M GS with OpenGL v7.15 driver
and DirectX 9.0c or 10).
In table 1, and in fig. 1, frame per second (fps)
and latency trends are shown as a function of the
increasing number of vertexes (#Pnts) and triangles
(#Tris) in the cone trees. All results are based on the
X3DOM built-in performance indicators. The same
test, performed with X3D and Octaga Player on the
same machines, gives no noticeable latency and no
reduction in fps.
This measure doesn’t take into account complex
factors like the adoption of shaders, animated
textures and other complex aspects, but we feel that
it can be useful as rule of thumb for Web
programmers.
The test shows that JavaScript can be currently
exploited to effectively manage thousands of
triangles, already sufficient to manage small to
medium data sets. We feel that, since X3DOM is
still in its infancy and ECMAScript interpreters are
under active improvements, better performances can
be expected.
USING BLENDER TO DESIGN AND IMPLEMENT DATA VISUALIZATION COMPONENTS FOR X3D AND
X3DOM
271
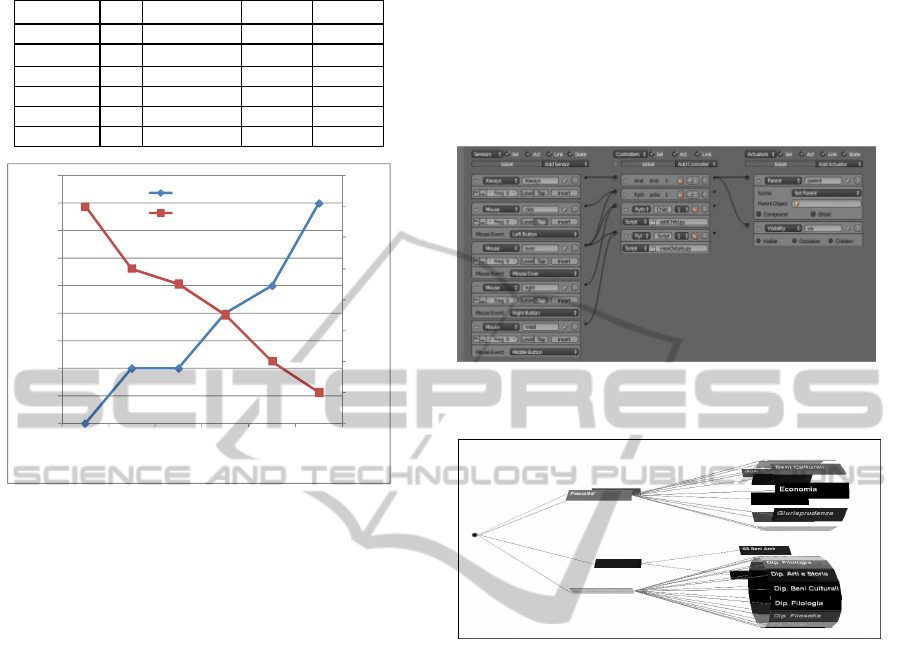
Table 1: Cone tree performance.
Tree size fps Latency [s] #Pnts #Tris
75 14 0 1800 900
150 10 0,1 3600 1800
300 9 0,1 5400 2700
600 7 0,2 10800 5400
1200 4 0,25 21600 10800
2400 2 0,4 43200 21600
0
2
4
6
8
10
12
14
16
0
0,05
0,1
0,15
0,2
0,25
0,3
0,35
0,4
0,45
900 1800 2700 5400 10800 21600
Framepersecond
Latency[s]
#Tris
Latency[s]
fps
Figure 1: Cone tree performance diagram.
4 IMPLEMENTATION ASPECTS:
THE CONE TREE EXAMPLE
Three phases are needed to design and implement
data visualization components in Blender. We start
to model the root node of the Cone Tree (CT) as a
sphere, the other nodes as prisms, and the tree
branches as wires. Parent nodes differ from leaves
because of the color, whose intensity is proportional
to the number of children nodes. This modelling
phase is rapid and effective and it’s easy to evaluate
different geometries for different presentation
solutions. The geometric primitives are completed
with the desired behaviours, described as networks
of logic bricks. In fig. 2, for example, the logic brick
network used for expand and collapse methods of
the node class is arranged in three columns: the first
column shows mouse events; the central column is
for “controllers” which compose the detected events
by means of Boolean operators (and, or, ...) and
Python scripts; the third column is for “actuators”, in
charge to change the visual aspects (and other
properties) of the tree components, to respond to the
user requests (expand-collapse). Geometric
primitives and behaviours are then “packed” as a
library of python classes (cone_tree, root_node,
level, leaf_node, parent_node) to enforce the object
orientation paradigm and to facilitate the code
maintainability and reuse. The constructor of the
cone_tree class, implemented as a Python script, is
in charge to dynamically load the tree nodes from a
relational table. For simplicity and portability, the
table is created by means of the SQLite DBMS that
is part of the standard Blender installation. An
instance of the CT is represented in fig. 3.
Figure 2: ConeTree: logic bricks network defining the
expand and collapse methods of the node class.
Figure 3: An instance of the ConeTree implemented in
3DBlender.
4.1 System Architecture
Each data visualization component (like the CT),
coming from the previously described approach, is
saved as a .blend file and can be trans-coded to X3D
or XHTML by means of our GBX (Graphics and
Behavior Exporter) tool, which consists of a set of
software modules developed with different
technologies.
GBX parses the geometric primitives and the
related logic brick networks and send them to the
Mapper module, in charge to generate the X3D
primitives corresponding to each blender construct,
while preserving the grouping and hierarchy
relationships coming from Blender. The generated
X3D primitives are therefore transformed in a .xml
stream by means of a stored procedure implementing
the LR topological numbering algorithm (Appelquist
2001).
The output of GBX can be included in any
.xhtml file, published by means of any web server
and can be directly rendered in 3D by any suitable
IVAPP 2011 - International Conference on Information Visualization Theory and Applications
272

web browser. Thanks to the X3DOM integration
framework, each geometric primitive and each
method of the CT are fully integrated within DOM
of the web page, so that it’s very easy to use for web
applications. As discussed in the previous section,
the performance of these kind of Web3D
applications is low to medium (thousands of
triangles), but yet sufficient for embedding 3D data
visualization components in standard web pages.
In conclusion, the current implementation of the
GBX tool, which we created to validate the proposed
approach, is able to automatically export simple
Blender applications, like the CT, in X3D and
XHTML. This is useful for prototyping purposes, to
test the visualization capabilities of the new
X3DOM framework and to embed interactive 3D
components in HTML5-compliant web pages.
In the future we will investigate about the
implementation of more realistic data visualization
components and about its integration with the
current technologies for dynamic Web pages
(AJAX3D, ASPX, PHP, JSP, ...) and with the main
open source frameworks and applications (Joomla,
Moodle,...). For the reason that currently the Web
largely relies on relational DMBS and dynamic
pages, we feel that data visualization could play a
central role in the future Web and the proposed
components are suitable for creating dynamic and
interactive visualization.
REFERENCES
Anslow, C., 2008. Evaluating Extensible 3D ( X3D )
Graphics For Use in Software Visualisation. Master of
Science thesis, Victoria University of Wellington,
2008.
Appelquist, D. K., 2001. XML and SQL: developing Web
applications, Addison Wesley. Available at:
http://scholar.google.com/scholar?q=intitle:XML+and
+SQL:+Developing+Web+Applications#0.
Arendash, D., 2004. The unreal editor as a Web 3D
authoring environment. Proceedings of Web3D 2004-
9th international conference on 3D Web technology,
p.119.
Arjomandy, S. & Smedley, T. J., 2004. Visual
specification of behaviours in VRML worlds.
Proceedings of Web3D 2004- 9th international
conference on 3D Web technology, 1(212), p.127.
J. Behr et al., 2010. A Scalable Architecture for the
HTML5 / X3D Integration Model X3DOM. In P.
Slusallek, B. Yoo, & N. Polys, eds. Proceedings of
Web3D 2010- 15th International Conference on 3D
Web Technology.
Huang, J. & Cheng, B., 2009. Interactive Visualization for
3D Pipelines Using Ajax3D. 2009 International
Conference on Networking and Digital Society, pp.21-
24.
Pellens, B., Kleinermann, F. & De Troyer, O., 2009. A
development environment using behavior patterns to
facilitate building 3D/VR applications. Proceedings of
the Sixth Australasian Conference on Interactive
Entertainment - IE ’09, pp.1-8.
Robertson, G., 1991. Cone Tree Animated 3D
Visualizations of Hierarchical Information. In SIGCHI
’91.
Shneiderman, B., 1996. The Eyes Have It: A Task by Data
Type Taxonomy for Information Visualizations. In
IEEE Symposium on Visual Languages. pp. 336-343.
Sons, K. et al., 2010. XML3D – Interactive 3D Graphics
for the Web. In P. Slusallek, B. Yoo, & N. Polys, eds.
Proceedings of Web3D 2010- 15th International
Conference on 3D Web Technology.
Sopin, I. & Hamza-lup, F. G., 2010. Extending the
Web3D: Design of Conventional GUI Libraries in
X3D. In P. Slusallek, B. Yoo, & N. Polys, eds.
Proceedings of Web3D 2010- 15th International
Conference on 3D Web Technology.
USING BLENDER TO DESIGN AND IMPLEMENT DATA VISUALIZATION COMPONENTS FOR X3D AND
X3DOM
273
