
EYE STATE ANALYSIS USING IRIS DETECTION TO EXTRACT
DRIVER’S MICRO-SLEEP PERIODS
Nawal Alioua
1
, Aouatif Amine
1,2
, Mohammed Rziza
1
and Driss Aboutajdine
1
1
LRIT, associated unit to CNRST, Faculty of Sciences, Mohammed V-Agdal University, Avenue Ibn Batouta, Rabat, Morocco
2
ENSA, Ibn Tofail University, Kenitra, Morocco
Keywords:
Eye state analysis, Driver’s drowsiness detection, Iris detection, Circular Hough Transform.
Abstract:
Eye state analysis is critical step for drowsiness detection. In this paper, we propose a robust algorithm for
eye state analysis, which we incorporate into a system for driver’s drowsiness detection to extract micro-sleep
periods. The proposed system begins by face extraction using Support Vector Machine (SVM) face detector
then a new approach for eye state analysis based on Circular Hough Transform (CHT) is applied on eyes
extracted regions. Finally, we proceed to drowsy decision. This new system requires no training data at any
step or special cameras. The tests performed to evaluate our proposed driver’s drowsiness detection system
using real video sequences acquired by low cost webcam, show that the algorithm provides good results and
can work in real-time.
1 INTRODUCTION
Eye analysis has been used in diverse applications in-
cluding gaze detection for human-machine interfaces,
face alignment for automatic face recognition systems
and drowsiness detection for intelligent vehicle sys-
tems (Wang and Ji, 2007). The increasing number
of traffic accidents due to a diminished driver’s vig-
ilance level resulting from sleep deprivation has be-
come a serious problem for society. Statistics show
that between 10% and 20% of all the traffic acci-
dents are due to drivers with a diminished vigilance
level (Bergasa et al., 2004). Therefore, it is very im-
portant to monitor driver’s drowsiness level and issue
an alarm when he/she is not paying enough attention
to the road. Many research projects has been done
on facial features detection to identify driver’s vigi-
lance level, especially the eyes states (Papanikolopou-
los and Eriksson, 2001; Zhang et al., 2008; Parsai
and Bajaj, 2007), head motion (Smith et al., 2000),
or mouth motion (Wang and Shi, 2005). The eye state
is often assumed to give indication of drowsiness level
characterized by micro-sleep which is a short period
(2-6 s) during which the driver rapidly closes its eyes
and sleep. The driver eye detection methods based on
computer vision use a camera to obtain facial infor-
mation, extract the eyes and determine their openness
degree. Many researchers use Percent of Eyelid Clo-
sure (PERCLOS) as an indicator to detect drowsiness
(Papanikolopoulos and Eriksson, 2001; Grace et al.,
2001; Roman et al., 2001). Other researchers use the
presence of the iris to predict if the eye is open (Tri-
pathi and Rath, 2009; D’Orazio et al., 2004; Parsai
and Bajaj, 2007).
Several visual behaviors can be used to charac-
terize the drowsy driver. These visual cues include
eyelid movement, mouth movement, and face orien-
tation. The parameters computed from these visual
cues can be combined to form a composite drowsiness
index that can robustly and consistently characterize
driver’s drowsiness state.
In this work, we propose an eye state analysis
method using iris detection based on Circular Hough
Transform (CHT) (Duda and Hart, 1972). This
method was incorporate in driver’s drowsiness detec-
tion system to identify micro-sleep periods. In or-
der to evaluate both method and system, some ex-
periments are done on real video sequences of dif-
ferent subjects in various lighting conditions using
statistical measures to expose the results. The pro-
posed method integrated in driver’s drowsiness detec-
tion system provides good results comparing to some
other systems.
The organization of this paper is as follows. Sec-
tion 2 explains the different steps of the proposed sys-
tem. In Section 3, experimental results are exposed.
Finally, conclusion and discussion are presented.
346
Alioua N., Amine A., Aboutajdine D. and Rziza M..
EYE STATE ANALYSIS USING IRIS DETECTION TO EXTRACT DRIVER’S MICRO-SLEEP PERIODS.
DOI: 10.5220/0003360003460351
In Proceedings of the International Conference on Computer Vision Theory and Applications (VISAPP-2011), pages 346-351
ISBN: 978-989-8425-47-8
Copyright
c
2011 SCITEPRESS (Science and Technology Publications, Lda.)

2 PROPOSED SYSTEM
The main idea of this work is to develop an eye state
analysis algorithm applied to driver’s drowsiness de-
tection system. The proposed system performs some
steps before determining driver’s state. Firstly, the
face is extracted from video frames. Secondly, the
eyes are localized. Finally, we apply the proposed
method based on CHT to detect drowsiness.
2.1 Face Extraction
The face is extracted from video frames to reduce
search region and therefore reduce the computational
cost required for the subsequent steps. We use an ex-
isting face extraction method, based on SVM tech-
nique (Burge, 1998), developed by Kienzle (Kienzle
et al., 2005).
2.2 Eye Localization
The reduced region where the eyes are situated is ob-
tained for the same purpose as in the previous step.
This eye region also eliminates the possibility of con-
fusing other facial features such as the mouth or the
nose with the eyes. To do this, we use gradient image
to highlight the edge. After that, horizontal projection
is computed on gradient image to detect the upper and
lower eye boundaries. Finally, we apply vertical pro-
jection on resulting image to obtain the right and left
face limits and separate the eyes.
2.3 Circular Hough Transform
The Hough Transform (Duda and Hart, 1972) can
be described as a transformation of a point in Carte-
sian space to parameter space defined according to the
shape of the object of interest. In the case of circular
forms, the circle equation r
2
= (x − a)
2
+ (y − b)
2
is
considered for the transformation. Where r represents
the radius, a and b refer respectively to the abscissa
and the ordinate of the circle center.
The process of finding circles in an image con-
sists to use a modified Hough Transform called Cir-
cular Hough Transform. The first step is to find im-
age edges by any edge detector. At each edge point,
we draw a circle in the parameter space having cen-
ter in this point with the desired radius. The radius
can be fixed to simplify the parametric representation.
At the coordinates which belong to the perimeter of
the drawn circle, we increment the value in the ac-
cumulator matrix. When every edge point and every
desired radius is used, the accumulator will contain
numbers corresponding to the number of circles pass-
ing through the individual coordinates. Thus the high-
est numbers correspond to the center of the circles in
the image. Figure 1 illustrates the CHT from Carte-
sian space to parameter space.
Figure 1: CHT from Cartesian space to parameter space.
2.4 Drowsiness Analysis
The role of this step is crucial in our system since it
detects micro-sleep periods in real time and issues im-
mediately an alarm to avert the drowsy driver. To de-
tect micro-sleep periods, we apply CHT on eye region
images in order to identify iris. The eye is considered
open if an iris is found. As can be seen in previous
section, CHT extracts circles from edge images. So,
the obtained results depend on applied edge detector.
Some classic edge detectors such as Sobel, Prewitt,
Roberts, Laplacian of Gaussian (LoG) and Canny was
tested for extracting the iris edge on eye region im-
ages. Unfortunately, the obtained edges by these de-
tectors did not provide the desired form, i.e. a kind of
circular form referring to the iris. In order to solve this
problem, we propose a new iris edge detector more
suitable to the eye’s morphology.
2.4.1 Iris Edge Detector
The proposed iris edge detector respects the eye’s
morphology. If we observe an open eye we see three
main components: the pupil which is the little black
circle in the center of eye surrounded by the iris, the
circle distinguished by eye color while the white outer
area represents the sclera. This structure enables us
to extract the iris edge from the significant intensity
variations between iris and sclera.
Our iris edge detector considers only pixels x with
grayscale intensity lower than an optimal threshold
noted th
edge
, which must be chosen to handle only
with pixels appertaining to the iris. For each pixel
x, a neighborhood containing n pixels at left and right
of x is specified. The difference between x and its n
right and left neighbors is then computed.
- Left (Resp. Right) Edge: if n or n − 1 left (resp.
right) neighbors of x provide a difference with x
higher than a threshold noted th
high
and also if n or
n − 1 right (resp. left) neighbors of x provide a differ-
ence with x lower than a threshold th
low
, we deduct
EYE STATE ANALYSIS USING IRIS DETECTION TO EXTRACT DRIVER'S MICRO-SLEEP PERIODS
347
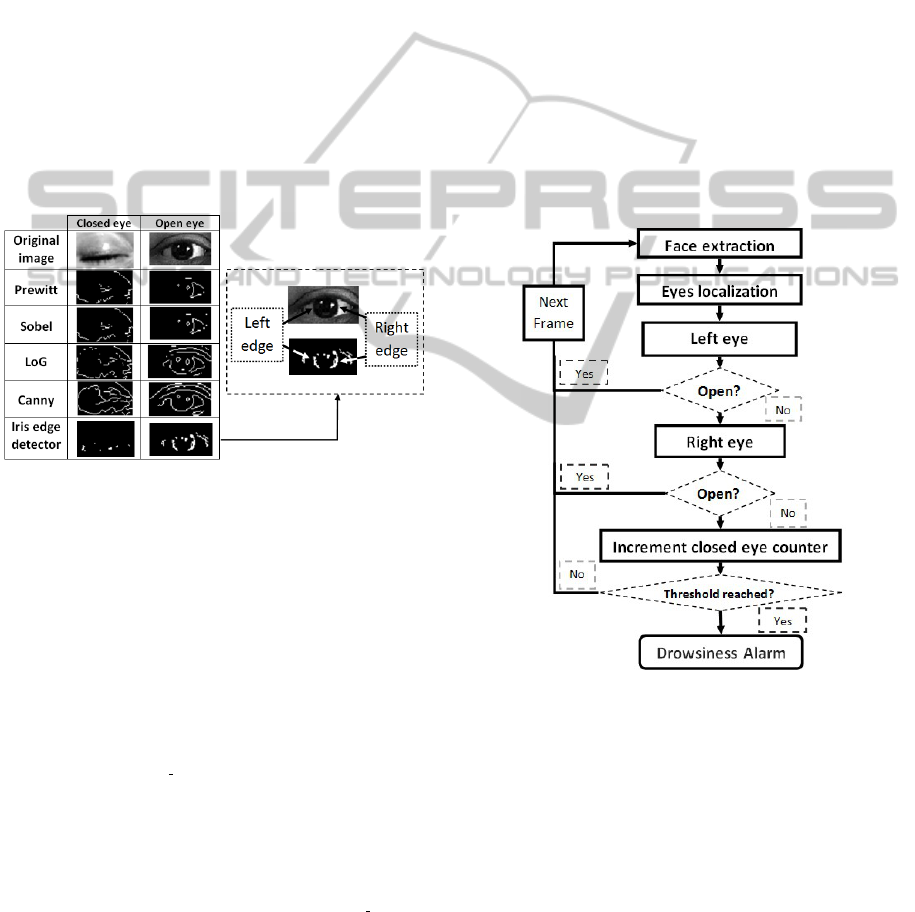
that x is a left (resp. right) edge pixel of the iris and
we put it at 1. (see Figure 2)
- Interpretation: In the case where x appertains to
the left edge, its left (resp. right) neighbors pixel’s
intensity is very higher (resp. similar). Inversely,
when x appertains to the right edge, the right (resp.
left) neighbors pixel’s intensity is very different (resp.
similar). The th
high
should distinguish the large dif-
ference between iris and sclera pixel’s intensity and
the th
low
should respects the similarity between iris
pixels. Figure 2 shows some examples of iris edge
detection obtained by the proposed method compared
to some classic edge detectors results. As can be seen,
the classic edge detectors cannot provide a good iris
edge detection. For example, some edge components
having circular form are detected in closed eye by
classic edge detectors, while the proposed iris edge
detector did not identify such component.
Figure 2: Iris edge detection by proposed method and clas-
sic methods.
2.4.2 Eye State Analysis using Iris Detection
Once the appropriate iris edge detector is found, we
can apply the CHT on this edge to obtain the iris ra-
dius from which we decide if the eye is open or close.
In the following, we present the CHT algorithm steps.
At each iteration, three edge pixels are randomly cho-
sen. If these pixels are not collinear and if the distance
between each two pixels coordinates is higher than a
fixed threshold th
dist px
, we compute the radius and
center coordinates of the candidate circle defined by
these three pixels. If these parameters are between
two specific thresholds for each parameter, they are
assigned to the accumulator. After that, we compute
the distances between the center and all edge pixels.
If a distance is lower than a threshold th
dist ctr
, we
increment the counter of pixels in the candidate cir-
cle. If this counter is higher than a threshold th
counter
,
we consider that the candidate circle can represents
the iris and we keep the other pixels as a new edge
and we repeat the previous steps. The algorithm stops
when the edge contains few pixels or when the maxi-
mum number of iterations is reached. Since we need
to detect the circle representing the iris, we select the
circle having the highest radius after the end of the
algorithm.
2.4.3 Drowsiness Detection
Drowsiness is characterized by micro-sleep periods.
So, we need to find the sleep intervals of at least 2
seconds. We analyze firstly the left eye state then the
right eye: if one of them is open, we pass to the next
frame. If the left eye is closed, we analyze the right
one, if it is also closed, we increment the consecutive
closed eye counter. We issue an alarm to avert the
drowsy driver if the eyes remain closed for a certain
period of time related to the counter.
Figure 3 summarises and depicts our proposed
system for driver’s drowsiness detection.
Figure 3: Driver’s drowsiness detection schema.
3 EXPERIMENTAL RESULTS
In this section, we discuss the experimental results
obtained by testing the proposed method to detect
iris. These results will be presented as statistical mea-
sures such Confusion Matrix, Correct Classification
Rate and kappa Statistic. In the first subsection, we
define briefly these statistical measures. After that,
we present the obtained results for real test video se-
quences.
VISAPP 2011 - International Conference on Computer Vision Theory and Applications
348

3.1 Statistical Measures
3.1.1 Confusion Matrix
Confusion Matrix is a tool to measure the quality of
a classification system. Each column of the matrix
represents the number of occurrences of an estimated
class, while each row represents the number of occur-
rences of a real class. Table 1 shows the confusion
matrix of a system that allows to classify two classes
a and b.
Table 1: Confusion Matrix.
h
h
h
h
h
h
h
h
h
h
h
h
h
Real class
Estimated class
a b Total
a T P FN p
b FP T N n
Total P N T
- T P (resp. T N) represents the number of instances
of class a (resp. class b) well classified by the
system.
- FN (resp. FP) represents the number of occur-
rences of class a (resp. class b) that have been
classified by the system as instances of class b
(resp. class a).
- P = T P +FP (resp. N = FN + T N) represents the
total of real occurrences of class a (resp. class b).
- p = T P + FN (resp. n = FP + T N) represents
the total of estimated occurrences of class a (resp.
class b).
- T is the sum of occurrences of both classes.
3.1.2 Correct Classification Rate
Correct Classification Rate noted CCR is the sum of
good detections represented by T P and T N divided
by the total number of samples T .
CCR =
T P + T N
T
(1)
3.1.3 Kappa Statistic
Kappa Statistic (Fleissa et al., 1969) (κ) is a measure
of the degree of non-random agreement between ob-
servers or measurements of the same categorical vari-
able given by following equation.
κ =
P
0
− P
e
1 − P
e
(2)
Where P
0
is observed agreement proportion corre-
Table 2: Kappa statistic interpretation.
Kappa Statistic Interpretation
> 0.81 Almost perfect agreement
> 0.61 and < 0.8 Strong agreement
> 0.2 and < 0.6 Moderate agreement
> 0.0 and < 0.2 Poor agreement
< 0 Disagreement
sponding to CCR and P
e
represents random agreement
proportion given by:
P
e
=
1
T
2
[(P × p) + (N × n)] (3)
We specify that −1 ≤ κ ≤ 1. Table 2 is used to inter-
pret kappa statistic.
3.2 Experiments
The aim of this paper is to present a method for eye
state analysis based on iris detection using CHT ap-
plied to detect micro-sleep period, which is a power-
ful drowsiness indicator. To validate this method, we
conduct several tests on real video sequences of dif-
ferent subjects and various lighting conditions. These
subjects have different face dimensions, skin colors
and eye shapes. In this work we assumed that the
distance between the camera and the subject cannot
greatly change while no constraints have been im-
posed on the background. All sequences are taken
with the same low cost webcam at 30 frames per sec-
ond (fps) providing images of resolution 640 x 480.
First, we evaluate our iris detection method. For this
purpose, we analyze all frames of the sequences to
identify the presence of irises on cropped eye images.
The second experiment is done to evaluate the method
when it is introduced in the driver’s drowsiness de-
tection system which led us to reduce the considered
number of fps from 30 to 3 frames to meet the real-
time constraints. In this experiment, automatic detec-
tion of face and eyes has also been integrated but not
evaluated in this work. The main purpose of these
integrations is to take them into account in assessing
the runtime system. The final experiment provides
a comparison between our driver’s drowsiness detec-
tion system and other existing systems. All experi-
ments are done on PC having Intel Core 2 Duo Pro-
cessor.
3.2.1 Evaluation of Eye State Analysis using Iris
Detection
The experiment was made on seven real video se-
quences of different subjects in various lighting con-
ditions where eyes are manually cropped. Figure 4
EYE STATE ANALYSIS USING IRIS DETECTION TO EXTRACT DRIVER'S MICRO-SLEEP PERIODS
349
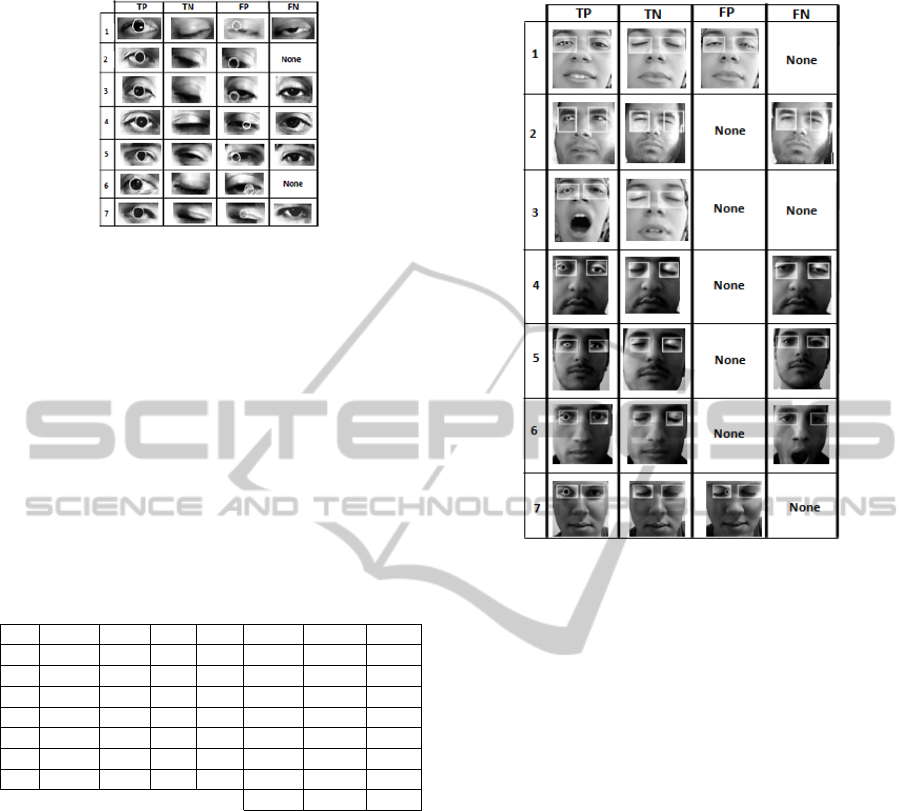
Figure 4: Results of iris detection.
shows examples of T P, FP, T N and FN for each se-
quence of this experiment. Table 3 presents the statis-
tical measures for all videos. V. refers to video num-
ber and Avr. represents the average. We observe, from
Table 3, that the average of CCR is 99% and the av-
erage of kappa statistic is 88%. According to Table 2,
our eye state analysis method using iris detection pro-
vides an almost perfect agreement between observers.
In other words, the real class of the samples usually
matches the estimated class proposed by the method.
So, we deduct that our eye state analysis method is
very strong.
Table 3: Statistical measures of iris detection.
V. TP TN FP FN T CCR κ
1 3336 233 17 14 3600 0.99 0.93
2 1760 36 4 0 1800 0.99 0.94
3 1772 18 2 8 1800 0.99 0.79
4 1482 273 9 38 1802 0.97 0.90
5 1762 24 2 14 1802 0.99 0.74
6 380 237 1 0 618 0.99 0.99
7 1636 135 14 17 1802 0.98 0.89
Avr. 0.99 0.88
3.2.2 Evaluation of Proposed Method in
Drowsiness Detection System
This experiment is important since it permits evalua-
tion of eye state analysis using iris detection when it
is integrated in driver’s drowsiness detection system.
We use the same statistical measures defined above in
addition of two parameters representing time in sec-
onds. The first one vid.D refers to video duration and
the second one exec.T refers to execution time of the
whole system (see Table 4).
Figure 5 depicts some examples of iris detection
of T P, FP, T N and FN for the seven test video se-
quences different from the ones presented in the pre-
vious experiment. Note that the face and the eyes are
detected automatically.
According to Table 4, the average of CCR is 98%
and the average of kappa statistic is 95%. From Ta-
Figure 5: Results of iris detection in driver’s drowsiness
detection system.
ble 2 and this average, we deduct that the integra-
tion of the proposed eye state analysis method in
driver’s drowsiness detection system procures also an
almost perfect agreement between the observers. This
means that driver’s drowsiness detection system per-
mits assignation of the correct classes in the most
cases. After comparing the two lasts columns, we de-
duce that the system respect the real time constraints
because execution time and video duration are almost
the same. Thus we deduct that the proposed system
can be used to have an excellent and real-time estima-
tion of driver’s state.
The last experiment exposes a comparison be-
tween our system and other existing systems of
drive’s drowsiness detection. The system depicted in
(Tripathi and Rath, 2009) is also based on CHT and
uses 173 images of ORL database for experiments,
this system provides success accuracy rate of 90.3%.
The second system presented in (Hrishikesh et al.,
2009) uses 70 images taken with an infra-red cam-
era for tests and obtains a success rate of 90%. While
the third system (Zhang et al., 2008), which is based
on adaptive learning method to detect driver’s eyes,
uses 13000 real frames for tests and find an accuracy
of about 95%.
We deduct that our proposed system for driver’s
drowsiness detection provides a very high success rate
comparing to the mentioned existing systems.
VISAPP 2011 - International Conference on Computer Vision Theory and Applications
350

Table 4: Statistical measures of iris detection in driver’s drowsiness detection system.
V. TP TN FP FN T CCR κ vid.D exec.T
1 154 31 1 0 186 0.99 0.98 62 66
2 143 12 0 1 156 0.99 0.95 52 55
3 165 52 0 0 217 1 1 73 75
4 103 20 0 1 124 0.99 0.97 42 47
5 122 19 0 2 143 0.98 0.94 48 50
6 98 17 0 4 119 0.96 0.88 41 44
7 69 9 1 0 79 0.98 0.94 27 30
Avr. 0.98 0.95
4 CONCLUSIONS
This paper presents an eye state analysis method using
iris detection based on CHT and applied on driver’s
drowsiness detection system in order to find micro-
sleep periods. The whole system uses three steps:
face extraction method using the SVM face detec-
tor, eyes region localization applied on gradient image
and eye state analysis method to identify the drowsy
driver. In the last step, we apply the CHT on our pro-
posed edge detectors in order to find irises. With 98%
accuracy of CCR and rate of 95% of kappa statis-
tic, it is obvious that our driver’s drowsiness detec-
tion system is robust compared to some existing sys-
tems. Note that, the iris detection method provides a
detection rate of 99% and kappa statistic value attain-
ing 88%. As future works, we plan to generalize the
system to detect driver’s inattention. We are study-
ing some other indicators such yawning frequency to
detect fatigue, and head pose and gaze orientation to
determine the focus of attention of the driver. We also
plan to use multiple cameras in order to detect irises
in various head orientations.
REFERENCES
Bergasa, L., Nuevo, J., Sotelo, M., and Vazquez, M. (2004).
Real-time system for monitoring driver vigilance. In
IEEE Intelligent Vehicle Symposium, pages 78–83.
Burge, C. (1998). A tutorial on support vector machines for
pattern recognition. In Data Mining and Knowledge
Discovery, pages 121–167.
D’Orazio, T., Leo, M., Spagnolo, P., and Guaragnella,
C. (2004). A neural system for eye detection in a
driver vigilance application. In The 7th International
IEEE Conference on Intelligent Transportation Sys-
tems, pages 320–325.
Duda, R. and Hart, P. (1972). Use of the hough transforma-
tion to detect lines and curves in picture. In Commun.
ACM, pages 11–15.
Fleissa, J., Cohen, J., and Everitt, B. (1969). Large sam-
ple standard errors of kappa and weighted kappa. In
Psychological Bulletin, pages 323–327.
Grace, R., Byrne, V., Bierman, D., Legrand, J., Gricourt,
D., Davis, B., Staszewski, J., and Carnahan, B. (2001).
A drowsy driver detection system for heavy vehicles.
In Proceedings of the 17th Digital Avionics Systems
Conference, volume 2, pages I36/1– I36/8.
Hrishikesh, B., Mahajan, S., Bhagwat, A., Badiger, T.,
Bhutkar, D., Dhabe, S., and Manikrao, L. (2009). De-
sign of drodeasys (drowsy detection and alarming sys-
tem). In Advances in computational algorithms and
data analysis, pages 75–79.
Kienzle, W., Franz, M., Bakir, G., and Scholkopf, B.
(2005). face detection efficient and rank deficient. In
Advances in Neural Information Processing Systems,
pages 673–680.
Papanikolopoulos, N. and Eriksson, M. (2001). Driver fa-
tigue: a vision-based approach to automatic diagnosis.
In Transportation Research Part C: Emerging Tech-
nologies, pages 399–413.
Parsai, R. and Bajaj, P. (2007). Intelligent monitoring sys-
tem for drivers alertness (a vision based approach). In
International Conference KES.
Roman, B., Pavel, S., Miroslav, P., Petr, V., and Lubomr,
P. (2001). Fatigue indicators of drowsy drivers based
on analysis of physiological signals. In Medical Data
Analysis, pages 62–68.
Smith, P., Shah, M., and da Vitoria Lobo, N. (2000). Mon-
itoring head/eye motion for driver alertness with one
camera. In Proceedings of the International Confer-
ence on Pattern Recognition (ICPR00), pages 636–
642.
Tripathi, D. and Rath, N. (2009). A novel approach to solve
drowsy driver problem by using eye-localization tech-
nique using cht. In International Journal of Recent
Trends in Engineering.
Wang, P. and Ji, Q. (2007). Multi-view face and eye de-
tection using discriminant features. In Computer Vi-
sion and Image Understanding, volume 105, pages
99–111.
Wang, T. and Shi, P. (2005). Yawning detection for deter-
mining driver drowsiness. In IEEE Int. Workshop on
VLSI Design and Video Tech., pages 373–376.
Zhang, G., Cheng, B., Feng, R., and Zhang, X. (2008). A
real- time adaptive learning method for driver eye de-
tection. In Digital Image Computing: Techniques and
Applications, pages 300–304.
EYE STATE ANALYSIS USING IRIS DETECTION TO EXTRACT DRIVER'S MICRO-SLEEP PERIODS
351
