A PROGRESSIVE DATA WAREHOUSE OF INSTITUTIONAL
RESEARCH WITH WEB API AND MASHUP VISUALIZATION
Masao Mori, Toshie Tanaka
Institutional Reserach Office, Kyushu University, Fukuoka, Japan
Sachio Hirokawa
Research Institute for Information Technology, Kyushu University, Fukuoka, Japan
Keywords:
University evaluation, Accreditation, Institutional research, Data warehouse, Mashup.
Abstract:
We propose a progressive data warehouse which provides functions of operating statistics and their visualiza-
tion for institutional research. The proposed data warehouse has a mashup programming environment with
GUI and the users can share their programs. By sharing programs of data analysis, persons in charge of
self-assessment seize an opportunity not only to create reports efficiently, but also to be able to improve their
activities.
1 INTRODUCTION
For the last decade, it has become very important
to establish PDCA cycles (an iterative process in
business improvement, acronym of ’Plan-Do-Check-
Action’) in private enterprises as well as universities
and research institutions. There are a number of rea-
sons why this action has occurred, butthe needs to im-
plement quality assurance systems and to fulfill gov-
ernment grant requirements have provided the ratio-
nale for the improvement cycle of universities and re-
search institutions. Quality assurance is realization of
the ’Check’ and the ’Action’ processes of PDCA cy-
cle. The ’Check’ phase is mostly conducted as self-
assessment.
In the ’Check’ phase of PDCA cycle, we cre-
ate self-assessment reports and collect their evidence.
Evidence consists of text data (committee materials
and documents, namely qualitative) and numerical
data (statistics of students and faculties, namely quan-
titative).
All Japaneses universities are obliged to be eval-
uated by certified organization, called Institutional
Certified Evaluation and Accreditation (ICEA, for
short). In addition, all Japaneses national universi-
ties must be evaluated for the purpose of informa-
tion disclosure to government and nation, called Na-
tional University Corporation Evaluation (NUCE, for
short). They are called university evaluationswhich is
undergone every six years. Universities must prepare
self-assessment reports and their evidence. Figure 1
shows examples of classification for evidence which
are necessary in the university evaluations. Figure 2 is
total number of graphs and tables which we actually
offered in the university evaluations.
Text Data Numerical Data
Individuals
awards
features
papers,
grants
Organizations
materials,
regulation,
publication
statistics of
education
and students
Figure 1: Examples classification of institutional informa-
tion used in the university evaluations which were con-
ducted in Kyushu University.
text data numerical data
ICEA 145 50
Education(NUCE) 58 47
Research(NUCE) 12 12
total 215 109
Figure 2: Number of items and statistics in university eval-
uations which were conducted in Kyushu University.
How to store and manage text data efficiently is
important, but in this paper we focus on management
of numerical data. In Kyushu University, as there
are 16 research faculties, 17 graduate schools, 11 un-
dergraduate schools and 7 research institutions with
323
Mori M., Tanaka T. and Hirokawa S..
A PROGRESSIVE DATA WAREHOUSE OF INSTITUTIONAL RESEARCH WITH WEB API AND MASHUP VISUALIZATION.
DOI: 10.5220/0003346303230329
In Proceedings of the 3rd International Conference on Computer Supported Education (CSEDU-2011), pages 323-329
ISBN: 978-989-8425-50-8
Copyright
c
2011 SCITEPRESS (Science and Technology Publications, Lda.)

the hospital, numbers of statistics of numerical data
amounts to over 1500. Since the authors has been
working on supporting the self-assessment reports of
Kyushu University, we recognize that the problem of
large numbers of statistics is crucial. Those statistics
in the context of university evaluations are acquired
by sorting and cross-tabulating tables of numerical
data. Persons in charge of assessment in each school
have to study such skills as cross-tabulating and SQL
language. Though these persons are not full-time as-
sessment staff, they must learn those skills in addtion
to jobs of self-assessment.
The purpose of self-assessment is not creating re-
ports, but reflecting activities of the university. To do
so, it is useful to visualize statistics of numerical data
in time series. Fundamental visualizations of numeri-
cal data are line or bar graphs, their combination, pie
chart, radar chart and so on. It is difficult to choose
generally which type of visualization is suitable for
each statistic.
In order to manage statistics and their visualiza-
tion, we propose a data warehouse with sharing skills
on statistics and visualization using mashup technol-
ogy. Data warehouse has become popular in insti-
tutional research. In our approach, mashup tech-
nology is introduced in data warehouse. By facil-
ity of mashup technology, persons in charge of self-
assessment can become familiar with statistics and
analyse from data warehouse.
The rest of paper consists as follows. In section
2, we will introduce related work and argue an issue
of data warehouse that enterprise data warehouse is
not suitable for institutional research. In section 3,
we propose a system sharing programs for statistics
and their visualization. In section 4, we conclude our
approach.
2 RELATED WORK
Enterprise data warehouse has two styles, Inmon’s
style (Inmon, 1999) and Kimball’s style (Kimball and
Ross, 2002). While Inmon’s style is a collection of
data tables in 3rd normal form, called data warehouse
and user interface of analysing tools, called data mart,
data warehouse of Kimball’s style forms a dimen-
sional data model from which data mart extracts nec-
essary data.
Considering problems mentioned in the introduc-
tion, common issue of both style data warehouse is
that users are not supposed to develop analysing tools
and visualizing skills. Staff in institutional research
should be analysts as well as they are respected to
develop data analysing programs. A feature of our
approach is that every user can contribute to devel-
opment of data warehouse tools without expertise on
programming.
Interaction between users and data warehouse
would be useful. Ferr´andez and Peral (2010) pro-
posed such interaction that data warehouse offers
question to users. Our approach focus on interaction
between users in order to share their tools and skills.
Mashup is a new concept to combined web ser-
vices and web databases with existing technologies
such as XML and HTTP communications. Swashup
DSL(Maximilien et al., 2007) and WMSL(Sabbouh
et al., 2007) are domain specific language (DSL) for
mashup, which do not assume programming skills
like JavaScript, CGI and so on. Integrated user in-
terfaces of mashup are proposed, for instance, Ya-
hoo! Pipes, Mashup Feeds (Tatemura et al., 2007)
and Damia (Altinel et al., 2007).
From viewpoint of simple and easy mashup pro-
gramming and visualizing mashup data, we proposed
and implemented a mashup programming environ-
ment (Mori et al., 2006) with GUI (Mori et al., 2007)
which combines web databases. In our study Web
databases are supposed to have Web API which of-
fers structured data with HTTP requests. The system
has four features. Firstly, every source of structured
data, including search engines and local CSV files
1
,
is defined an abstract I/O machine in the system, we
call them resource component. Secondly we general-
ize UNIX-like pipeline and filters on the system. In
the architecture of our system, UNIX-like filter oper-
ations like sorting and creating histogram are imple-
mented. Graph generation programs are also imple-
mented as kinds of filter operation as well. Thirdly,
the system provides a GUI programming environment
which helps users to create mashup programs intu-
itively and easily. Finally the system is served as a
multiuser content management system in which users
share mashup programs.
3 THE PROPOSED SYSTEM
Our proposing system consists of three parts.
Overview is shown in figure 6.
The first part is a data warehouse for institutional
research with Web API. The mashup programming
environment can include the data warehouse as a re-
source component. The second part is a GUI mashup
programming environment for visualization and its
execution environment. The GUI mashup program-
ming environment serves fundamental data opera-
1
User can upload CSV files as resource components
CSEDU 2011 - 3rd International Conference on Computer Supported Education
324
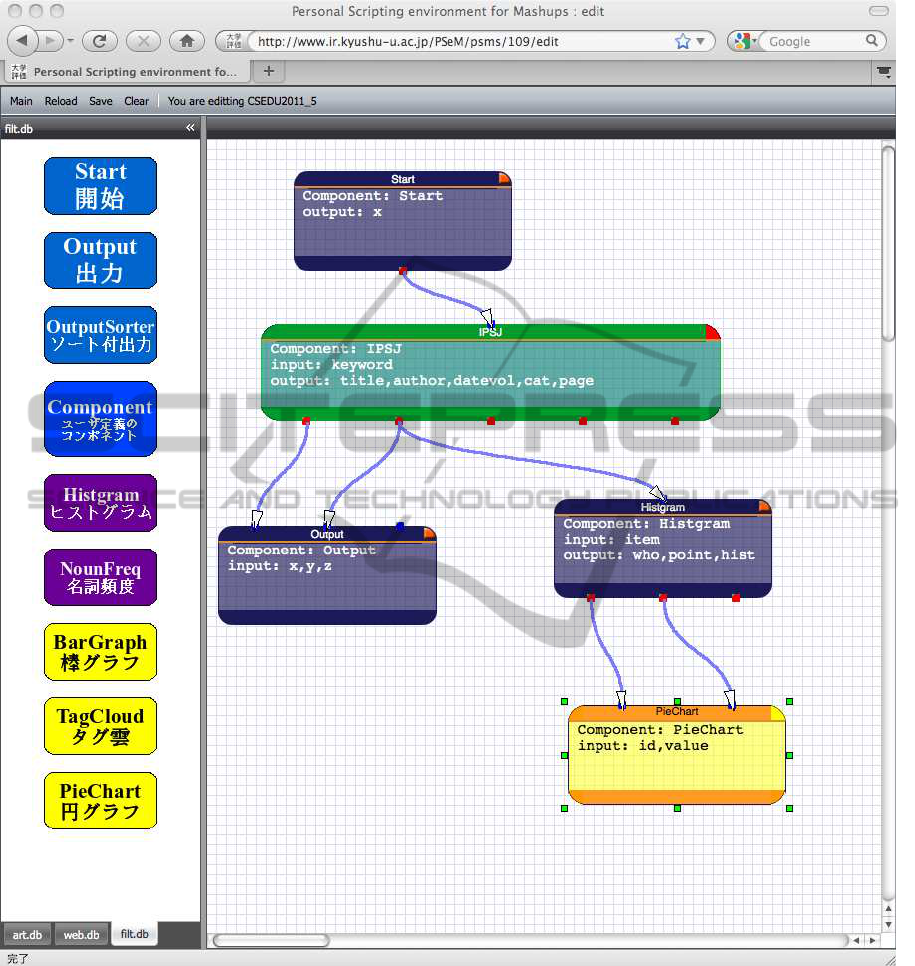
Figure 3: GUI editor of mashup.
tions, for instance, sorting and counting words. More-
over Fundamental visualizations can implemented in
the environment. The third part is a contents man-
agement system to share mashup programs of visual-
ization with other users. By sharing programs, user
can copy and revise those programs more easily than
create programs from scratch.
Figure3 shows a mashup program example,
named
CSEDU2011-5.cgi
, which processes a article
databases (Web database of articles published by In-
formation Processing Society of Japan, IPSJ for short)
with a histogram filter (counting authors’ name) and
one graphic (pie chart). A green rectangle is a re-
source component (an article database of IPSJ) in
which red dots on upper side and down side rep-
resent input (search words) and output (search re-
sult) respectively. While the left blue rectangle at
the bottom is a browser, the right blue rectangle is
a histogram filter which counts appearance of authors
from search result. The yellow rectangle shows a pie
A PROGRESSIVE DATA WAREHOUSE OF INSTITUTIONAL RESEARCH WITH WEB API AND MASHUP
VISUALIZATION
325
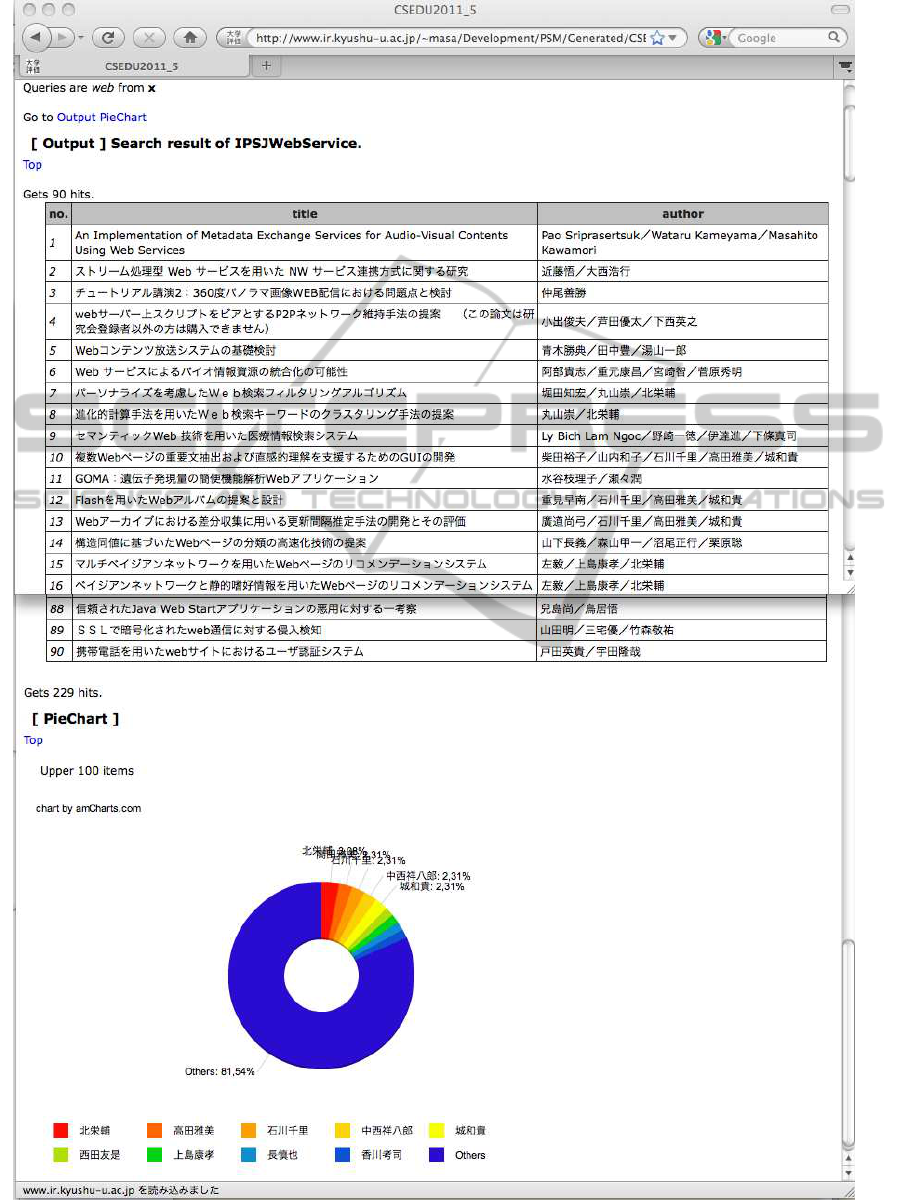
Figure 4: Executing visualization of mashup.
CSEDU 2011 - 3rd International Conference on Computer Supported Education
326
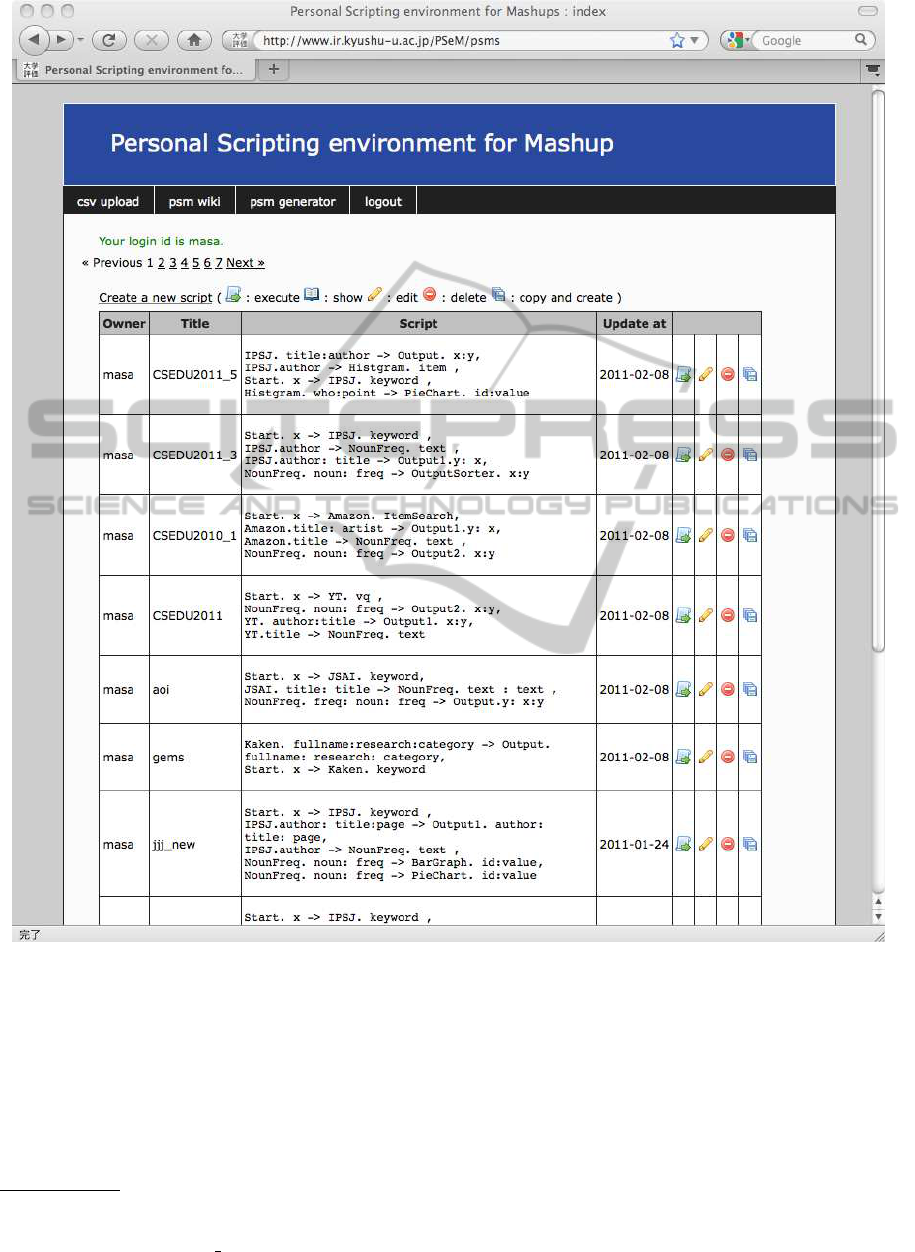
Figure 5: Sharing mashup.
chart visualizing results of the histogram filter. Ar-
rows between rectangles represent correspondence of
attributes of structured data. Figure4 shows an ex-
ecution of
CSEDU2011-5.cgi
2
. Given search word
’web’, the program returns search result of IPSJ with
a pie chart which represents proportion of numbers
of authors in the search result. Figure5 is the con-
tent management system of the mashup programming
2
This program can be executed if one access the
URL http://www.ir.kyushu-u.ac.jp/∼masa/Development/
PSM/Generated/CSEDU2011 5.cgi.
environment in which users share mashup programs.
Implementation is progressing and will be completed
in April 2011.
4 CONCLUSIONS
The proposed system has two contribution. Firstly,
simple and easy programming environment with GUI
increase programming users. This means that web ap-
plication programmers as well as data analysts cre-
A PROGRESSIVE DATA WAREHOUSE OF INSTITUTIONAL RESEARCH WITH WEB API AND MASHUP
VISUALIZATION
327
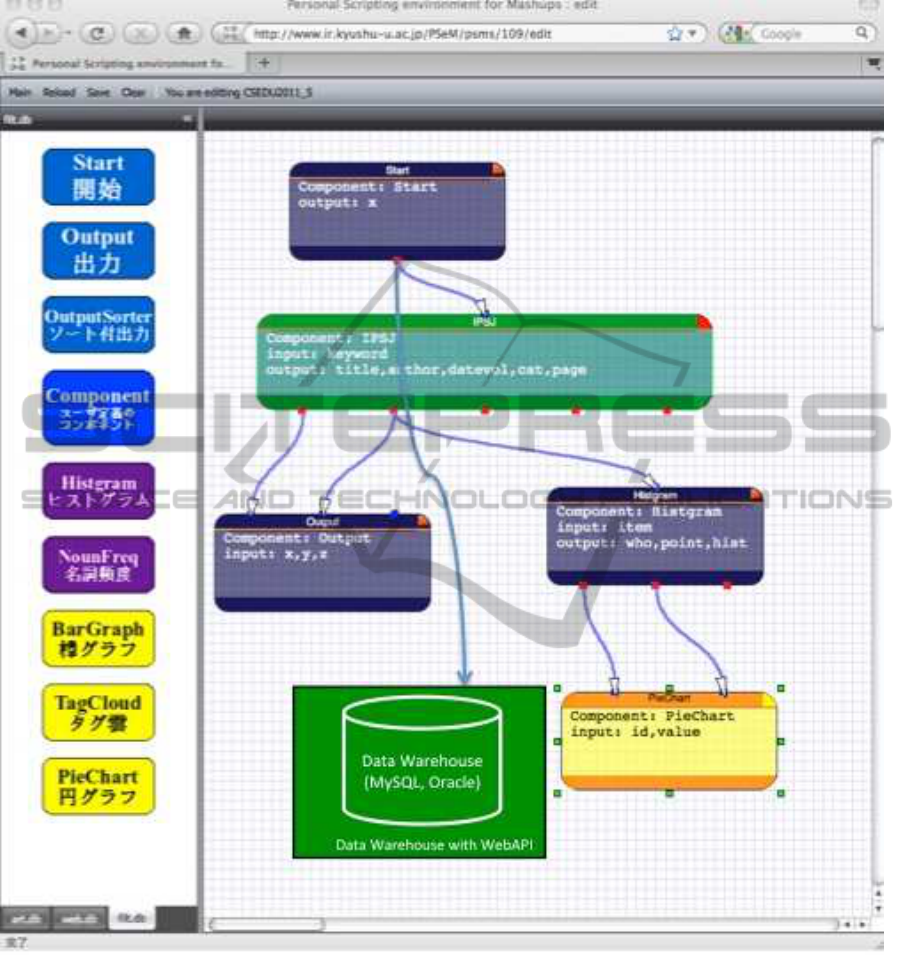
Figure 6: Overview of the proposing system.
ate mashup programs. Secondly, by sharing programs
in the proposed system, one can curbs the develop-
ment cost of application programs for data analysis.
One of the problems of data analysis in institutional
information is diversity rather than quantity. Users
can create a new analysing program by reusing and
composing shared programs. The proposed mashup
programming methods enables us to combine internal
institutional information as well as external informa-
tion.
In this paper we propose a progressive data ware-
house which cooperates with a GUI environment of
mashup visualization. The next step of our approach
is to classify shared programs of statistics and their
visualization.
ACKNOWLEDGEMENTS
This work was supported by KAKENHI(22530921).
CSEDU 2011 - 3rd International Conference on Computer Supported Education
328

REFERENCES
Altinel, M., Brown, P., Cline, S., Kartha, R., Louie, E.,
Markl, V., Mau, L., Ng, Y.-H., Simmen, D., and
Singh, A. (2007). Damia: a data mashup fabric for
intranet applications. In Proceedings of th 33rd inter-
national conference on Very Large Databases, pages
1370–1373. VLDB Endowment.
Ferr´andez, A. and Peral, J. (2010). The benefits of the inter-
action between data warehouses and question answer-
ing. In Proceedings of the 2010 EDBT/ICDT Work-
shops, volume 426 of ACM International Conference
Proceeding Series.
Inmon, W. (1999). Data Warehouse Performance. Wiley.
Kimball, R. and Ross, M. (2002). The Data Webhouse
Toolkit : 2nd edition. Wiley.
Maximilien, E. M., Ranabahu, A., and Tai, S. (2007).
Swashup: Situational web applications mashups. In
22nd International Conference on Object-Oriented
Programming Systems, Languages, and Applications,
OOPSLA 2007 - Companion, pages 797–798.
Mori, M., Nakatoh, T., and Hirokawa, S. (2006). Functional
composition of web databases. In Proceedings of In-
ternational Conference Asian Digital Libraries 2006,
Lecture Note in Computer Science 4312, pages 439–
448. Springer Verlag.
Mori, M., Nakatoh, T., and Hirokawa, S. (2007). Links
and cycles of web databases. In The 4th Italian Work-
shop on Semantic Web Applications and Perspectives,
pages 21–30. Dip. di Informatica, Universit´a degli
Studi di Bari.
Sabbouh, M., Higginson, J., Semy, S., and Gagne, D.
(2007). Web mashup scripting language. In Proceed-
ings of the 16th international conference on World
Wide Web 2007, pages 1305 – 1306. ACM Press.
Tatemura, J., Sawires, A., Po, O., Chen, S., Candan, K. S.,
Agrawal, D., and Goveas, M. (2007). Mashup feeds:
Continuous queries over web services. In Proceedings
of the 2007 ACM SIGMOD international conference
on Management of data, pages 1128 – 1130. ACM
Press.
A PROGRESSIVE DATA WAREHOUSE OF INSTITUTIONAL RESEARCH WITH WEB API AND MASHUP
VISUALIZATION
329
