
EVENT DETECTION IN A SMART HOME ENVIRONMENT USING
VITERBI FILTERING AND GRAPH CUTS IN A 3D VOXEL
OCCUPANCY GRID
Martin Hofmann, Moritz Kaiser, Nico Lehment and Gerhard Rigoll
Institute for Human-Machine Communication, Technische Universit
¨
at M
¨
unchen, Arcisstr. 21, Munich, Germany
Keywords:
Event detection, Smart home, Voxel occupancy grid, Graph cuts, Viterbi tracking.
Abstract:
In this paper we present a system for detecting unusual events in smart home environments. A primary appli-
cation of this is to prolong independent living for elderly people at their homes. We show how to effectively
combine information from multiple heterogeneous sensors which are typically present in a smart home sce-
nario. Data fusion is done in a 3D voxel occupancy grid. Graph Cuts are used to accurately reconstruct people
in the scene. Additionally we present a joint multi object Viterbi tracking framework, which allows tracking
of all people, and simultaneously detecting critical events such as fallen persons.
1 INTRODUCTION
In recent years, automatic assistance and safety sys-
tems for supporting elderly people at their homes have
gained increasing research interest. Video cameras,
microphones and computer processing power have
become powerful and cheap enough to potentially al-
low for full time surveillance and assessment of the
home environment.
In order to prolong independent living at home,
specialized communication equipment has long been
utilized to allow a person to call for assistance when
needed. However, typically a person in need of help is
unable to call for help or press the alarm button him-
self. Thus it is desirable to have a surveillance system,
which automatically detects such a crucial condition
and calls for assistance in case of an accident.
In this paper we present a system which can au-
tomatically detect those events. For this purpose,
a smart home environment, equipped with multiple
multi-modal sensors is used. Our method is twofold:
First data from all available sensors is fused in a 3D
voxel occupancy grid, where we apply Graph Cuts to
accurately reconstruct the 3D scene. Our algorithm is
capable of fusing information from CCTV, thermal,
infrared, and PMD-range cameras.
Secondly, we apply a Viterbi tracking algorithm,
which not only tracks every person, but simultane-
ously detects whether they are standing, or have fallen
down. Depending on the tracking output and based on
meta data, the system is capable of detecting events
such as ”entering”, ”exiting”, ”sitting on the sofa” and
most importantly falling to the floor.
We begin with a review of related work. In Section
3, we present the 3D voxel occupancy grid and the re-
construction using Graph Cuts. Section 4 presents our
extension to the Viterbi Tracking algorithm for event
detection. Experiment on the PROMETHEUS dataset
(Ntalampiras et al., 2009) are shown in Section 5 and
we conclude in Section 6.
2 RELATED WORK
The systems currently deployed to elderly people are
non intelligent and require manual interaction. The
person has means of sending an emergency call, such
as a remote transponder, however in the event of an
accident the person has to be conscious and must be
able to press an emergency button.
There exists quite a number of automated systems
which use environmental sensors. For example (For-
oughi et al., 2008) uses Support Vector Machine clas-
sification on human silhouette shape changes. How-
ever their system requires a very specific camera setup
in front of a monochrome background, which is un-
natural for real world scenarios. In (Diraco et al.,
2010) a single Photonic Mixer Device is used to find
the centroid of a person. Similarly in (Shoaib et al.,
2010) the authors classify on the foreground blobs ex-
tracted from a single camera with monochrome back-
ground.
242
Hofmann M., Kaiser M., Lehment N. and Rigoll G..
EVENT DETECTION IN A SMART HOME ENVIRONMENT USING VITERBI FILTERING AND GRAPH CUTS IN A 3D VOXEL OCCUPANCY GRID.
DOI: 10.5220/0003315402420247
In Proceedings of the International Conference on Computer Vision Theory and Applications (VISAPP-2011), pages 242-247
ISBN: 978-989-8425-47-8
Copyright
c
2011 SCITEPRESS (Science and Technology Publications, Lda.)
Thus most of the current approaches use data from
a limited number of visual sensors or need very spe-
cific camera setup. Our approach in contrast is capa-
ble of fusing data from a multitude of distributed and
heterogeneous sensors into one common scene recon-
struction. Tracking and event detection in this joint
observation space is much more robust and leads to
better results because the reasoning can be done in
3D space.
For 3D reconstruction we decided to use a 3D
voxel occupancy grid. 3D voxel occupancy dates
back the early 1980’s (Martin and Aggarwal, 1983).
This method uses silhouettes from multiple views
and projects them back into the voxel grid where the
shapes of the objects are inferred by intersection of
the back projected silhouettes. The method is there-
fore often also called shape-from-silhouette (Cheung
et al., 2003)(Cipolla and Blake, 1992).
However, the general shape-from-silhouette
method is very sensitive to noise and errors in the
generation of the silhouettes. For example, if a pixel
in the foreground silhouette from one view is falsely
detected as background, the resulting 3D structure
will typically have a hole. To avoid this, morpho-
logical operations (Serra, 1983) are often applied
to the silhouettes or the 3D volume to enhance the
quality. However, morphological operations typically
introduce deforming artifacts.
In order to avoid artifacts and to get a more precise
reconstruction, we use a soft fusion of the silhouettes
similar to (Snow et al., 2000). To this end, a global
energy function is defined on the 3D voxel occu-
pancy grid. This energy function contains a data term,
which alone is equivalent to the standard shape-from-
silhouette method. Additionally, the energy contains
a smoothness term, which in essence allows to pad
holes without introducing artifacts.
As mentioned in the introduction, we use an ex-
tended state tracker to follow people and to find out
if they are standing, sitting or fallen down. We use
an extension to the Viterbi tracking algorithm. This is
similar to (Fleuret et al., 2007). However, the main
difference is that we extend the state space to not
only include the (x
t
, y
t
) coordinates, but also a flag
l
t
, which states whether the person is standing, or has
fallen down.
3 3D VOXEL OCCUPANCY GRID
In the following we present an approach for recon-
structing the 3-dimensional shapes of objects from
multiple multi-modal distributed camera sources. To
this end, the scene is quantized to a three dimensional
Sensor
input
Background
Segmentation
Silhouette
extensions
Fusion
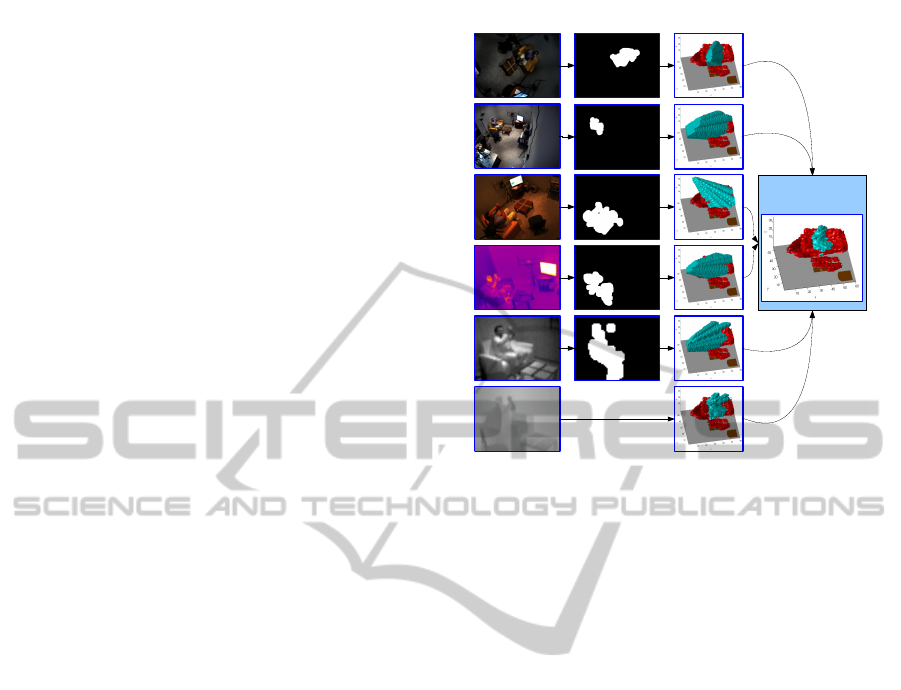
Figure 1: The 3D voxel occupancy grid is calculated as
follows: For each input sensor, foreground silhouettes are
generated using background subtraction. The visual hulls
of the foreground silhouettes are fused in the 3D space us-
ing either intersection of the visual hulls or graph cuts. The
range channel is a special case: Instead of using background
subtraction, the visual hull is generated using the range in-
formation.
voxel occupancy grid. The occupancy of each of the
voxels is determined by the joint observations of all
available sensors. The method is able to utilize het-
erogeneous sensors such as CCTV, thermal, infrared
and range sensors.
With this method it is possible to generate accu-
rate 3D detections, as well as an accurate reconstruc-
tion of the scene. All the processing is done in 3D
and therefore allows reasoning in a 3D environment
as opposed to just flat 2D camera images. The pro-
posed method is especially applicable to short range
environments just like the smart home indoor scenar-
ios.
We show two methods for fusing data: One is by
intersection of the visual hulls. The other uses graph
cuts (Boykov et al., 2001). The later gives much better
results.
3.1 Definition and Sensor Projection
The reconstruction of the scene is done in a 3-
dimensional occupancy grid V , with a neighborhood
system N ⊂ V ×V which connects each voxel to its
adjacent voxels. For every voxel v ∈ V there is a bi-
nary labeling f
v
which is 1, if the voxel is occupied,
and 0, if it is not occupied.
EVENT DETECTION IN A SMART HOME ENVIRONMENT USING VITERBI FILTERING AND GRAPH CUTS IN
A 3D VOXEL OCCUPANCY GRID
243

The input to the algorithm comes from multi-
modal visual sensors, i.e. visual cameras, infrared
cameras as well as the photonic mixer device (PMD)
which produces a near infrared image (NIR) and a
range image. We distinguish between two principal
categories of sensors: intensity and range. There are
m intensity sensors and n range sensors. In our ex-
periments we have m = 5 intensity sensors and n = 1
range sensors. Details of our specific setup can be
found in Section 5.1.
The set of pixels in camera k is denoted as C
k
. We
use background modeling (Zivkovic and van der Hei-
jden, 2006) to determine, which of the pixels in C
k
are foreground. The subset F
k
⊂ C
k
denotes all the
pixels which are determined to be foreground by the
background modeling method. All of the cameras are
calibrated using the Tsai camera calibration method
(Tsai, 1986). With the use of this calibration, each
pixel c
k
∈ C
k
of camera k intersects with a set of vox-
els, which is denoted as V (c
k
) ⊂ V . Consequently,
each voxel v corresponds to a multitude of pixels in
the corresponding camera k. The visual observation
set O(v) describes for each voxel v, which sensors see
it as foreground:
O(v) =
k|∃c
k
with c
k
∈ V
−1
(v) ∧ c
k
∈ F
k
(1)
The range sensor is a special case. The function
r(v) describes, if the voxel v is foreground, based on
the range information.
r(v) =
(
1 range(V
−1
(v)) < dist(v, PMD)
0 else
(2)
Here dist(v, PMD) denotes the Euclidean distance
from the voxel v to the center of the PMD camera
and range(c
k
) denotes to distance measured with the
PMD device at pixel c
k
.
3.2 Fusion using Intersection
First experiments of fusing projected data in the 3D
voxel occupancy grid is by intersection of the visual
hulls. The fusion then efficiently becomes:
f
v
=
(
1 kO(v)k+ r(v) ≥ k + 1 − µ
0 else
, with µ = 0
(3)
This means that a voxel v is labeled as foreground
if it can be observed as foreground by all visual sen-
sors, and if in addition the voxel can be explained as
foreground by the PMD range channel.
In the case that detections are erroneous and suf-
fer from misses, the proposed algorithm can easily
be made more robust by setting µ > 0. In this case
only k − µ out of the available views have to intersect,
which leads to better detections at the cost of more
false positives.
3.3 Fusion using Graph Cuts
To further improve the reconstruction quality, we used
a global energy function with a data term D
v
( f
v
) and
a smoothness term S( f
v
, f
v
0
). This allows to naturally
include a smoothness constraint. Minimizing this en-
ergy function is superior to silhouette intersection,
which has no means of incorporating a smoothness
term. The energy function is given as
E( f ) =
∑
v∈V
D
v
( f
v
) + µ
∑
v,v
0
∈N(v)
S( f
v
, f
v
0
) (4)
For each voxel v, the data term D
v
( f
v
) as-
signs a cost depending on the label f
v
. We de-
fine the visibility ratio h(v) =
kO(v)k+r(v)
k
ˆ
O(v)k
,
ˆ
O(v) =
k|∃c
k
with c
k
∈ V
−1
(v)
, which defines for each
voxel the ratio of the number of cameras observing
the voxel as foreground divided by the total number
of cameras which can see the voxel. This is an impor-
tant measure, because voxels can be oberserved by a
variable number of cameras. We then define the data
term as follows:
D
v
( f
v
) =
(
h(v) f
v
= 1
1 − h(v) f
v
= 0
(5)
The smoothness term is defined on the close
neighborhood as:
S( f
v
, f
v
0
) =
(
0 f
v
= f
v
0
1 else
(6)
The final labeling f = argmin
f
E( f ) is obtained
using graph cuts (Kolmogorov and Zabih, 2002). In
all our experiments we set µ =
1
100
in Equation 4. This
factor weighs the influence of the data term versus the
smoothness term.
4 EVENT TRACKER
In this section we present a combined low and high
level action recognition framework for smart home
scenarios. The basic idea is to formulate the event
detection stage jointly with the tracking stage. In
other words, we use a multi object tracking algorithm,
which not only tracks all the people in the scene, but
simultaneously tracks the configuration (standing or
fallen down) of the person. The output of this ex-
tended tracking framework is rich enough to detect
VISAPP 2011 - International Conference on Computer Vision Theory and Applications
244

a multitude of events without further classification or
recognition steps.
The event tracker takes input solely from the ob-
servation space generated using the 3D voxel occu-
pancy grid described in the previous section. This 3D
reconstruction proved highly accurate and robust for
the purpose of event detection.
The main focus in this work is on detecting fallen
persons. However, as a byproduct, the method is also
capable of recognizing four additional events. More
specifically, ”Sitting down”, ”Standing up”, as well as
”Entering home” and ”Exiting home”.
4.1 Viterbi Formulation
In this section we present the optimization method of
the joint tracking and event detection framework. We
use a maximum a posteriori method, more specifically
the Viterbi algorithm, to find the optimal trajectories.
To begin, we will first introduce the state vari-
ables. At each time t, the state of a person i
is given by S
i
t
=
x
i
t
, y
i
t
, l
i
t
. Thus the state not
only contains the position (x
i
t
, y
i
t
), but an additional
flag l
i
t
which can hold one of three values: l
i
t
∈
{
outside, standing, f allen). We denote by S
t
=
S
1
t
, . . . , S
N
t
the joint state space of all people at
time t. Here N is the maximum number of people
that can potentially be in the scene. Consequently,
S
i
=
S
i
1
, . . . , S
i
T
denotes the trajectory of person i.
The complete state of the full sequence containing T
frames is then given by S = (S
1
, . . . , S
T
).
Given the set of observations I = (I
1
, . . . , I
T
), we
seek to maximize the state sequence S, given the ob-
servations I.
ˆ
S = arg max
S
P(S|I) (7)
There are many possibilities to optimize such a poste-
rior, for example using particle filters such as the con-
densation algorithm or Markov Chain Monte Carlo
methods. Because we already have a heavily dis-
cretized occupancy grid (and thus a rather low num-
ber of states), we propose to use the Viterbi algorithm
to find the optimal state sequence. The Viterbi algo-
rithm is an iterative algorithm, which at each time step
returns the optimal trajectory up until this time step.
However, despite the discretized occupancy grid, the
optimal solution is intractable, because the number of
states increases exponentially with a higher number
of people.
A solution to this problem is to compute the tra-
jectories for each person one after the other:
ˆ
S
1
= argmax
S
1
P(S
1
|I) (8)
ˆ
S
2
= argmax
S
2
P(S
2
|I,
ˆ
S
1
) (9)
.
.
.
ˆ
S
N
= argmax
S
N
P(S
N
|I,
ˆ
S
1
,
ˆ
S
2
, . . . ,
ˆ
S
N−1
) (10)
This means that the optimization of a trajectory is
conditioned on the results from optimizing all the pre-
vious trajectories. The conditioning implies that tra-
jectories cannot use locations which are already oc-
cupied by other trajectories. Assuming perfect ob-
servations this sequential approach does not do any
harm and the optimal trajectories can still be ob-
tained. However in practice, the observations suffer
from spurious detections, miss detections and noise.
Obviously the described greedy optimization fails in
these cases.
An elegant solution(Fleuret et al., 2007) is to pro-
cess the data in temporal batches of a certain length
T = T
0
. The basic idea is as follows: After the opti-
mization (Equations 8-10) is performed, only the first
10% of the tracking results are kept and the rest is dis-
carded. The temporal batch is then shifted forward.
The trajectories are sorted such that for the next op-
timization the trajectory with the highest confidence
is computed first. This ensures that trajectories with
stable observations are optimized first, while trajecto-
ries with weak observations cannot interfere with the
stable trajectories.
Optimizing a single trajectory then becomes a
matter of running the standard Viterbi algorithm (For-
nay, 1973). We need to find the most likely path
through the state sequence, which maximizes the pos-
terior probability:
ˆ
S = arg max
S
P(S|I) = arg max
S
P(I
1
, . . . , I
T
, S
1
, . . . , S
T
)
(11)
This is achieved with an iterative procedure. At each
time t,
Ψ
t
(k) = max
S
1
,...,S
t−1
P(I
1
, . . . , I
t
, S
1
, . . . , S
t−1
, S
t
= k)
(12)
denotes the maximum probability of ending up in
state k at time t. With the markov assumptions, the
current state is only dependent on the previous state
P(S
t
|S
t−1
, S
t−2
, . . .) = P(S
t
|S
t−1
) and the observations
are independent given the state P(I|S) =
∏
t
P(I
t
|S
t
).
Therefore the iterative Viterbi equation can be
written as:
Ψ
t
(k) = P(I
t
|S
t
= k) max
λ
P(S
t
= k|S
t−1
= λ)Ψ
t−1
(λ)
(13)
EVENT DETECTION IN A SMART HOME ENVIRONMENT USING VITERBI FILTERING AND GRAPH CUTS IN
A 3D VOXEL OCCUPANCY GRID
245
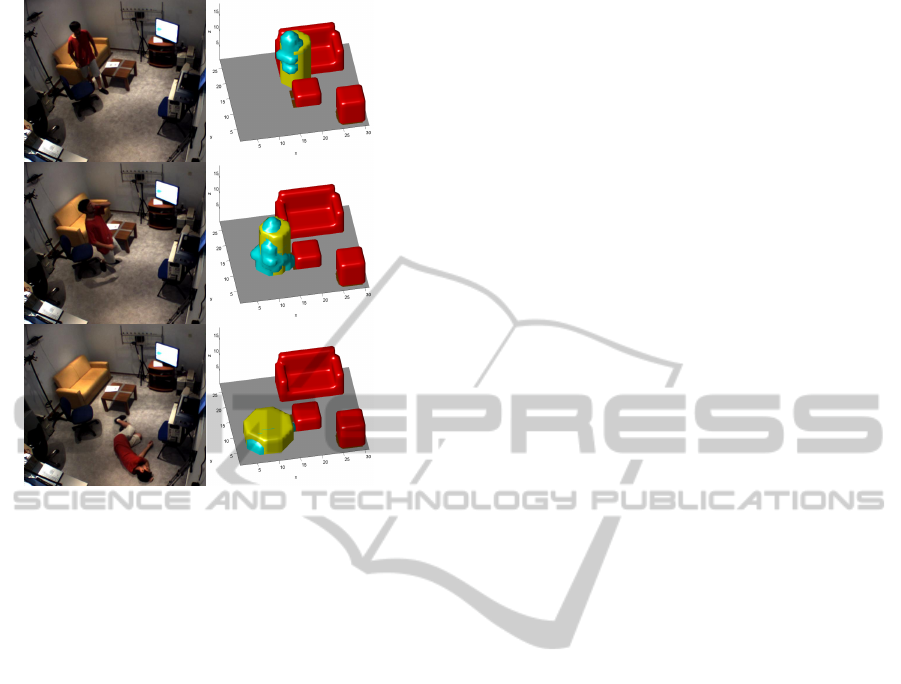
Figure 2: Sequence of a falling person and the correspond-
ing observation in the 3D voxel occupancy grid. The 3D
voxel occupancy grid is correlated with a tall thin template,
and a flat wide template to get the observation likelihood
P(I|S). Manually modeled background objects (red); Ob-
servations in the 3D voxel occupancy grid (blue); human
correlation templates at the tracked position (yellow).
The maximization operator in Equation 13 finds the
optimal predecessor in frame t −1 when going to state
k at time t. Thus a backtracking starting from the final
optimum at t = T yields the optimal trajectory.
4.2 Motion Model
The motion model is given by the term P(S
t
=
k|S
t−1
= λ). It is the probability of entering state
k, if the system was in state λ in the previous time
step. We model this probability with a Gaussian dis-
tribution centred at λ and with a standard deviation
of σ = 100mm. This way, motions of approximately
0.1 meter per time step and less are encouraged, while
bigger motions are not likely (but still possible).
4.3 Appearance Model
Here P(I
t
|S
t
= λ) is the observation model. Given a
hypothesized state S
t
= λ, this is the likelihood of ob-
serving that state. This observation likelihood is de-
termined as follows: First we correlate the 3D voxel
occupancy grid with two templates. One template is
a thin and tall cylinder, representing a standing hu-
man (see Figure 2(top row)). The other template is
a flat and wide template representing a fallen human
(see Figure 2(bottom row)). Then the output from the
correlation is normalized to a probability distribution.
4.4 Event Detection
Detecting events becomes very straight forward after
the rich output from the tracking module. The tracker
gives for each person the position and the stand-
ing/fallen flag. Setting appropriate thresholds on the
position readily give results for ”entering”, ”exiting”,
”sitting down” and ”standing-up”. For example, a tra-
jectory which starts close to the entrance region will
invoke the ”entering” event. The event ”falling down”
can be directly detected from the standing/fallen flag
l
t
. The event is detected at each transition from
l
t
= standing to l
t+1
= f allen.
5 EXPERIMENTS
5.1 Database and Setup
The data used in this paper has been recorded during
the 7th Framework EU Project PROMETHEUS (Nta-
lampiras et al., 2009). We use data from two smart
home indoor scenarios. In these scenarios up to 4 in-
dividuals, played by actors, portray daily behavior in
a living room. The data is therefore captured in a very
controlled environment.
The database contains two recordings which, be-
sides others, contain several instances of the falling
down events. The recordings are 15min and 30min
respectively. The scenario is recorded from five cam-
eras with a total of six image channels. These include
three visual channels from CCTV cameras, one ther-
mal channel from a thermal camera, as well as a near
infrared (NIR) channel and a range channel from a
Photonic Mixer Device. We divide the six channels
into two different kinds of data sources (intensity and
range), as described in Section 3.1. The m = 5 in-
tensity sensors consist of the three visual cameras,
the thermal camera and the NIR channel of the PMD
device. The PMD device generates the n = 1 range
channel.
The visual cameras deliver high resolution
(1024 × 768 and 768 × 576) color images. The ther-
mal camera has a medium resolution of 240 × 320.
The PMD sensor, a CMOS time of flight Camera
(PMD[Vision]3k-S), delivers a range image with a
spatial resolution of 64 × 48 pixels for a range of up
to 7.5m in a depth resolution of ≈ 1cm as well as a
64 × 48-pixel NIR (Near-infrared) image.
VISAPP 2011 - International Conference on Computer Vision Theory and Applications
246

Table 1: Performance results for the five detectable events.
Precision Recall F1-measure
falling down 85.7% 100% 96.1%
sitting down 100% 100% 100%
standing up 100% 100% 100%
entering home 83.2% 71.4% 76.8%
exiting home 80.0% 66.6% 72.7%
5.2 Evaluation and Results
For evaluation, the processing results are compared
against manually annotated ground truth. In order
to account for annotation errors and detection un-
certainty, we allow a temporal window of ∆ f = 30
frames for matching ground truth to detection results.
The final results of our event detection method are
shown in Table 1. It can be seen that the event ”falling
down” has been recognized with 100% recall and a
few false positives. A few false positives are admis-
sible because in safety applications, the focus is on a
high recall rate. In our experiments a few false pos-
itives occured when people leaned down to help up
a person who has fallen down before. Our algorithm
is able to detect the ”sitting down” and ”standing up”
events with perfect precision and recall. The ”enter-
ing” and ”exiting” events are harder to detect, espe-
cially because in our dataset, people often enter or exit
the scene in groups of two or three.
6 CONCLUSIONS
In this paper we have shown how data from multi-
ple, heterogeneous image sensors can be efficiently
combined to detect a number of events with applica-
tion to surveillance in a smart home environment. We
have shown that for fusing multiple heterogeneous
data sources, a 3D voxel occupancy grid is beneficial.
Furthermore, we demonstrated simultaneous tracking
and event detection using an extended multi-object
Viterbi tracking framework. We applied our method
to the multi-camera, multi-modal Prometheus smart
home database. In this specific application, our al-
gorithm is capable of detecting falling people and a
number of other events. We showed excellent results
on this smart home database and showed that the pro-
posed application setup can in fact be used for assis-
tance systems for the elderly.
REFERENCES
Boykov, Y., Veksler, O., and Zabih, R. (2001). Fast approxi-
mate energy minimization via graph cuts. IEEE Trans.
Pat. Analysis and Machine Intelligence, 23(11):1222–
1239.
Cheung, G. K., Baker, S., Simon, C., and Kanade, T. (2003).
Visual hull alignment and refinement across time: A
3D reconstruction algorithm combining shape-from-
silhouette with stereo. Comp. Vis. Pat. Rec.
Cipolla, R. and Blake, A. (1992). Surface shape from the
deformation of apparent contours. Int. J. Comput. Vi-
sion, 9(2):83–112.
Diraco, G., Leone, A., and Siciliano, P. (2010). An active
vision system for fall detection and posture recogni-
tion in elderly healthcare. In Design Automation &
Test, pages 1536–1541.
Fleuret, F., Berclaz, J., Lengagne, R., and Fua, P. (2007).
Multi-camera people tracking with a probabilistic oc-
cupancy map. IEEE Trans. Pat. Analysis and Machine
Intelligence.
Fornay, G. D. (1973). The viterbi algorithm. Proceedings
of the IEEE, 61(3):268–278.
Foroughi, H., Rezvanian, A., and Paziraee, A. (2008).
Robust fall detection using human shape and multi-
class support vector machine. In Proc. Indian Conf.
on Computer Vision, Graphics & Image Processing,
pages 413–420.
Kolmogorov, V. and Zabih, R. (2002). What energy func-
tions can be minimized via graph cuts? In Proc. Eu-
ropean Conf. on Computer Vision, pages 65–81.
Martin, W. and Aggarwal, J. (1983). Volumetric descrip-
tions of objects from multiple views. IEEE Trans. Pat.
Analysis and Machine Intelligence, 5(2):150–158.
Ntalampiras, S., Arsi
´
c, D., St
¨
ormer, A., Ganchev,
T., Potamitis, I., and Fakotakis, N. (2009).
PROMETHEUS database: A multi-modal cor-
pus for research on modeling and interpreting human
behavior. In Proc. Int. Conf. on Digital Signal
Processing.
Serra, J. (1983). Image Analysis and Mathematical Mor-
phology. Academic Press, Inc., Orlando, FL, USA.
Shoaib, M., Elbrandt, T., Dragon, R., and Ostermann, J.
(2010). Altcare: Safe living for elderly people. In 4th
Int. ICST Conf. on Pervasive Computing Technologies
for Healthcare 2010, volume 0.
Snow, D., Viola, P., and Zabih, R. (2000). Exact voxel oc-
cupancy with graph cuts. In IEEE Conf. on Computer
Vision and Pattern Recognition, pages 345–352.
Tsai, R. (1986). An efficient and accurate camera calibra-
tion technique for 3-D machine vision. In IEEE Conf.
on Computer Vision and Pattern Recognition, pages
364–374.
Zivkovic, Z. and van der Heijden, F. (2006). Efficient
adaptive density estimation per image pixel for the
task of background subtraction. Pattern Recogn. Lett.,
27(7):773–780.
EVENT DETECTION IN A SMART HOME ENVIRONMENT USING VITERBI FILTERING AND GRAPH CUTS IN
A 3D VOXEL OCCUPANCY GRID
247
