
BIOINFORMATICS INSPIRED ALGORITHM
FOR STEREO CORRESPONDENCE
Romain Dieny, Jerome Thevenon, Jesus Martinez-del-Rincon and Jean-Christophe Nebel
Digitial Imaging Research Centre, Kingston University, Kingston-Upon-Thames, KT1 2EE, U.K.
Keywords: Stereo correspondence, Dynamic programming, Sequence alignment, Bioinformatics, Parameter estimation.
Abstract: In this paper, we exploit the analogy between protein sequence alignment and image pair correspondence to
design a bioinformatics-inspired framework for stereo matching based on dynamic programming. This
approach also led to the creation of a meaningfulness graph, which helps to predict matching validity
according to image overlap and pixel similarity. Finally, we propose an automatic procedure to estimate
automatically all matching parameters. This work is evaluated qualitatively and quantitatively using a
standard benchmarking dataset and by conducting stereo matching experiments between images captured at
different resolutions. Results confirm the validity of the computer vision/bioinformatics analogy to develop
a versatile and accurate low complexity stereo matching algorithm.
1 INTRODUCTION
Stereo matching is an essential step in the process of
3D reconstruction from a pair of stereo images.
Since it has many applications including robot
navigation, security and entertainment, it has been
an important field of computer vision for several
decades. The problem of finding correspondences
between pixels belonging to a pair of stereo images
has been tackled using a wide range of techniques
such as block correlations, dynamic programming,
graph cut and simulated annealing; excellent reviews
of the literature can be found in (Scharstein &
Szeliski 2002) and (Lazaros, et al., 2008). Among
these techniques, those based on dynamic
programming (DP) have proved particularly
attractive. They provide good accuracy and are
computationally efficient (MacLean, et al., 2010):
they are able to find the global minimum for
independent scanlines in polynomial time.
Although the design of some of these DP
algorithms was inspired by that of Needleman and
Wunsch (1970), e.g. (MacLean, et al., 2010), which
was developed for alignment of protein sequences,
to our knowledge, no author has exploited fully the
analogy between protein and image correspondence.
In this paper, we present a DP algorithm for stereo
matching inspired by bioinformatics techniques. Not
only does the bioinformatics analogy allow the
design of an efficient stereo-matching algorithm, but
it also permits investigating the limits of
applicability of the algorithm in term of image
overlap and pixel occlusion. This is illustrated here
by producing dense disparity maps from images
captured at different resolutions. Finally, we also
propose a methodology allowing automatic
configuration of all algorithm parameters.
The structure of this paper is organised as
follows. After reviewing relevant literature, we
detail our novel stereo matching algorithm. Then,
experiments are conducted on a benchmark dataset
to validate our method. Finally, conclusions and
future work are presented.
1.1 Related Work
First applications of DP to the problem of stereo
matching produced sparse disparity maps using edge
information (Baker & Binford 1981) and (Ohta &
Kanade 1985). In order to generate dense maps,
correspondences between scanlines were computed
using pixel colour values. This task highlighted
complications which were not present when dealing
only with edges: they include image noise, indistinct
image features and half occlusion, e.g. object points
which can be seen only in one of the two images.
Statistical frameworks have been proposed to
explicitly tackle these issues (Geiger, et al., 1992),
(Belhumeur, 1996), (Cox, et al., 1996) and (Torr &
Criminisi 2004). Alternatively, (Bobick & Intille
465
Dieny R., Thevenon J., Martinez-del-Rincon J. and Nebel J..
BIOINFORMATICS INSPIRED ALGORITHM FOR STEREO CORRESPONDENCE.
DOI: 10.5220/0003312304650473
In Proceedings of the International Conference on Computer Vision Theory and Applications (VISAPP-2011), pages 465-473
ISBN: 978-989-8425-47-8
Copyright
c
2011 SCITEPRESS (Science and Technology Publications, Lda.)

1999) suggested to pre-process images by producing
a ‘disparity-space image’ based on block
correlations and, then, use DP to find the optimal
correspondences. In addition to rely on additional
free parameters, all these approaches required
additional calculations, which affect significantly the
computational complexity of the stereo matching
process.
Since traditional DP algorithms compute line-
based global optimisations, they do not take into
account vertical consistency between scanlines.
Although some early methods attempted to address
this issue (Ohta & Kanade 1985), (Belhumeur,
1996), (Cox, et al., 1996) and (Bobick & Intille
1999), they only refine results produced from
scanline optimisation. In order not to bias
optimisation towards one direction, e.g. scanline, a
new class of DP algorithms, which can be applied
efficiently to tree structures, has been recently
proposed (Veksler, 2005) and (Deng & Lin 2006).
Results show they are significantly more accurate
than scanline based methods with only a marginal
increase of computational cost.
In the last few years, the main emphasis has been
on designing real-time solutions by adapting
previous DP algorithms (Forstmann, et al., 2004),
(Wang, et al., 2006) and (Salmen, et al., 2009).
Eventually, the first FPGA hardware implementation
of a DP-based stereo matching algorithm has just
been proposed (MacLean, et al., 2010). Its
performance demonstrates DP-based approaches
provide the best compromise between accuracy and
speed.
2 METHODOLOGY
We propose a new matching algorithm particularly
suitable for the scanline to scanline correspondence
problem, which can be applied to pairs of rectified
stereo images. First, we introduce the bioinformatics
technique on which it is based. Then, we explain
how it can be extended to image processing.
2.1 ‘Needleman-Wunsch’ Algorithm
The publication of the first ‘Atlas of Protein
Sequence and Structure’ (Dayhoff, et al., 1965)
which comprised the sequences of 65 proteins,
arguably founded the field of bioinformatics. This
gave researchers the opportunity to compare
sequences to establish evolutionary relationship
between proteins. Since protein sequences have an
average length of 400 characters and mutate through
substitution, insertion and deletion of characters, the
alignment of a protein pair is not a trivial matter.
The ‘Needleman–Wunsch’ algorithm (Needleman &
Wunsch 1970) has provided an effective automatic
method to produce an exact solution to the global
alignment of two protein sequences. It is still at the
core of the latest search engines (Altschul, et al.,
1997) and (Mackey, et al., 2002), which allow
finding the best alignment between a given protein
sequence and a large database such as UniProt
(Leinonen, et al., 2004), which contains more than
20 million entries.
The ‘Needleman–Wunsch’ (N&W) algorithm is
based on a dynamic programming approach which
optimises the global alignment of character strings
according to a scoring function taking into account
possible mutations. In practice, alignments are
produced by, first, filling in a scoring matrix and,
then, ‘backtracking’ from the highest score in either
the last column or the last line of the matrix.
Each matrix cell stores the maximum value
which can be achieved by extending a previous
alignment (see Table 1). This can be done either by
aligning the next character of the first sequence with
the next character of the second sequence or
extending either sequence by an empty character to
record a character insertion or deletion (‘indel’).
In the case of character alignment, i.e. diagonal
motion in the matrix, the score depends on their
values. A reward, match, is allocated if the two
characters are identical, otherwise a penalty,
mismatch, is applied since this highlights a mutation
(substitution). When a sequence is extended, i.e.
from either north or west, this is also penalised, gap,
because it reveals that a mutation (insertion or
deletion) occurred. While completing the matrix, in
addition to the score of each cell, the direction(s)
from which the score is coming must be recorded
since they are used in the ‘backtracking’ process.
The scoring matrix, M, is initialised by setting
the initial score (top left cell) to zero and the first
line and column according to cumulated gap
penalties. Then, M is filled in using the following
pseudo-code:
for i = 1 to length(sequence1)
{
for j = 1 to length(sequence2)
{
north <- M(i-1,j) +gap
if( character1 = character2 )
diagonal <- M(i-1,j-1) +match
else
diagonal <- M(i-1,j-1) +mismatch
endif
west <- M(i,j-1) +gap
M(i,j) <- max(north, diagonal, west)
}
}
VISAPP 2011 - International Conference on Computer Vision Theory and Applications
466

Once the matrix is completed, the optimal
alignment is extracted using the ‘backtracking’
process (see Table 2). First, the highest score cell in
either the last column or row is identified. Then,
using direction information, a path to the origin of
the matrix is constructed. Finally, this path is
converted into an alignment. It is important to note
that, although the algorithm always finds the best
global alignment(s) for a given scoring scheme,
there may be several alignments with the optimal
score.
The whole process is illustrated with an example
in Table 1 and 2, where the following scoring
scheme is used: match=2, mismatch=0 and gap=-1.
Representing gaps by ‘-‘, the resulting alignment is:
EDECE
AD-CE
Table 1: Extension of initial alignment. The new cell score
is shown in blue; 3 possible scores are shown in green.
-
E D E
-
0
−1
→
−2
→
−3
→
A
−1
↓
0
↘
−1
→
↘
−2
→
↘
D
−2
↓
−1
↓
↘
2
↘
Table 2: Completed scoring matrix and optimal path
highlighted in red.
-
E D E C E
-
0
−1
→
−2
→
−3
→
−4
→
−5
→
A
−1
↓
↘
−1
→
↘
−2
→
↘
−3
→
↘
−4
→
↘
D
−2
↓
−1
↓
↘
↘
→
0
→
−1
→
C
−3
↓
−2
↓
↘
1
↓
2
↘
↘
2
→
E
−4
↓
−1
↘
0
↓
3
↘
2
↓
→
↘
↘
2.2 Application to Stereo Matching
An analogy can be made between aligning protein
sequences and matching pixels belonging to
scanlines, since both tasks aim at establishing
optimal correspondence between two strings of
characters. In addition, the ‘right’ image of a stereo
pair can be seen as a mutated version of the ‘left’
image: noise and individual camera sensitivity alter
pixel values (i.e. character substitutions); and
different view angle reveals previously occluded
data and introduces new occlusions (i.e. insertion
and deletion of characters). Consequently, the N&W
approach is a very good starting point for developing
a stereo matching algorithm, as seen in (MacLean, et
al., 2010). The novelty of this work is that, first, it
takes full advantage of the protein sequence/scanline
analogy by refining the N&W based stereo matching
algorithm with the relevant extensions proposed in
the field of bioinformatics. Secondly, this analogy is
exploited further by producing a graph which
suggests the limits of applicability of the algorithm
in term of image overlap and pixel occlusion.
2.2.1 Scoring Matrix
Scoring matrices are filled in using scoring functions
which quantify the cost of possible mutations.
Different substitutions in protein sequences affect
differently protein functions. However, this is not
reflected in the match/mismatch dichotomy used in
N&W. This was addressed by customising mismatch
costs according to estimated rates of mutations
between pairs of characters (Dayhoff, 1978) and
(Henikoff & Henikoff 1992). Although it would be
possible to perform a statistical study to establish the
mutation frequency between pixel values, here we
use a linear model which is context independent.
The mismatch penalty of aligning a pair of pixels,
where p
i
and p
j
are their values, is expressed by the
absolute value of their difference, so that extending
an alignment along the diagonal alters the global
score by:
ℎ − |
−
|
In genetics, ‘indels’ are rare and dramatic events
which usually have negative effect on protein
functions. Although the N&W can penalise this type
of mutations by associating them with a higher cost
than substitutions, it does not take into account that
an ‘indel’ of n characters is much more likely than n
‘indels’ of one character. For this reason, the initial
scoring scheme was completed with a lower penalty
for extended gaps, egap, which encourages gaps to
cluster. We believe this concept is also valid in
stereo matching where one would expect that a few
occlusions of several-pixel length would be more
frequent than a large number of 1-pixel occlusions:
due to the nature of stereo matching, different
camera viewpoints create occlusion areas associated
with each object present in a scene. Accordingly, we
implemented extended gaps in our algorithm.
As a consequence of these changes, our scoring
matrix is filled in using the following pseudo-code:
for i = 1 to length(sequence1)
{
for j = 1 to length(sequence2)
{
mismatch = -|IL(line,i) -IR(line,j)|
if( M(i-1,j) is a gap )
north <- M(i-1,j) +egap
else
north <- M(i-1,j) +gap
endif
diagonal <- M(i-1,j-1) +match
+mismatch
BIOINFORMATICS INSPIRED ALGORITHM FOR STEREO CORRESPONDENCE
467
if( M(i,j-1) is a gap )
west <- M(i,j-1) +egap
else
west <- M(i,j-1) +gap
endif
M(i,j) <- max(north, diagonal, west)
}
}
2.2.2 Backtracking
The N&W backtracking process is straight forward.
In the matrix, the cell with the highest score in either
the last column or the last line of the matrix is
identified. Then from that cell to the origin of the
matrix, the global alignment is extracted using the
stored direction information associated with each
cell. This process usually produces a set of optimal
alignments, see Fig. 1. Consequently, new
information needs to be supplied to allow selecting a
single solution. In bioinformatics, this is usually
resolved by providing additional alignments
involving other related sequences. They are used to
produce a single multiple alignment which optimises
all pair-wise alignment constraints (Higgins, et al.,
1994), (Notredame, et al. 2000), (Edgar, 2004) and
(Lassmann & Sonnhammer 2005).
Several strategies have been offered to deal with
this issue in the context of stereo matching. Many
suggest selecting the ‘smoothest’ solution in term of
horizontal and vertical discontinuities along and
across scanlines (Cox, et al., 1996) and (Bobick &
Intille 1999). Some are based on high confidence
matches, such as edge intersections, which are
identified during a pre-processing phase. These good
matches are exploited as extra constraints in the
choice of a unique solution (Bobick & Intille 1999)
and (Torr & Criminisi 2004).
In this work, we follow the traditional
bioinformatics approach. The general principle is
that each scanline can be seen as a mutation of both
the previous and the following lines. Therefore,
alignments involving these lines can be used to
select among several solutions by enforcing some
vertical discontinuities.
However, this approach is only valid if those
lines are, indeed, mutations of the scanline of
interest. Since usage of a neighbouring line does not
ensure that the scanlines are related – there may be a
horizontal edge – we impose that the pixel
sequences used as constraints are composed of the
mean values between the scanline and neighbouring
line pixels. For instance, in addition to the alignment
between the scanline, i, on the left image (l
i
) and its
corresponding line on the right one (r
i
), we can
calculate a constraining alignment between l
i
and the
average between r
i
and r
i+1
. Those solutions present
in both alignments are more likely to be a correct
solution. Following this reasoning, using all
combinations between (l
i
), (l
i
+l
i+1
), (l
i-1
+l
i
), (l
i-
1
+l
i
+l
i+1
), and (r
i
), (r
i
+r
i+1
), (r
i-1
+r
i
), (r
i-1
+r
i
+r
i+1
), and
reading scanlines from right to left, a total number of
32 constraints are generated.
In practice, in order to reduce the added
computational cost of this strategy, we generate only
constraining alignments for the subsections of
scanline pairs which display several optimal
correspondences, see Fig. 1. Then, for a given
subsection, each initial solution is scored according
to the number of constraining alignments which
reach the same solution. The solution with the
highest number of votes is selected. In the case of a
draw, it is chosen at random.
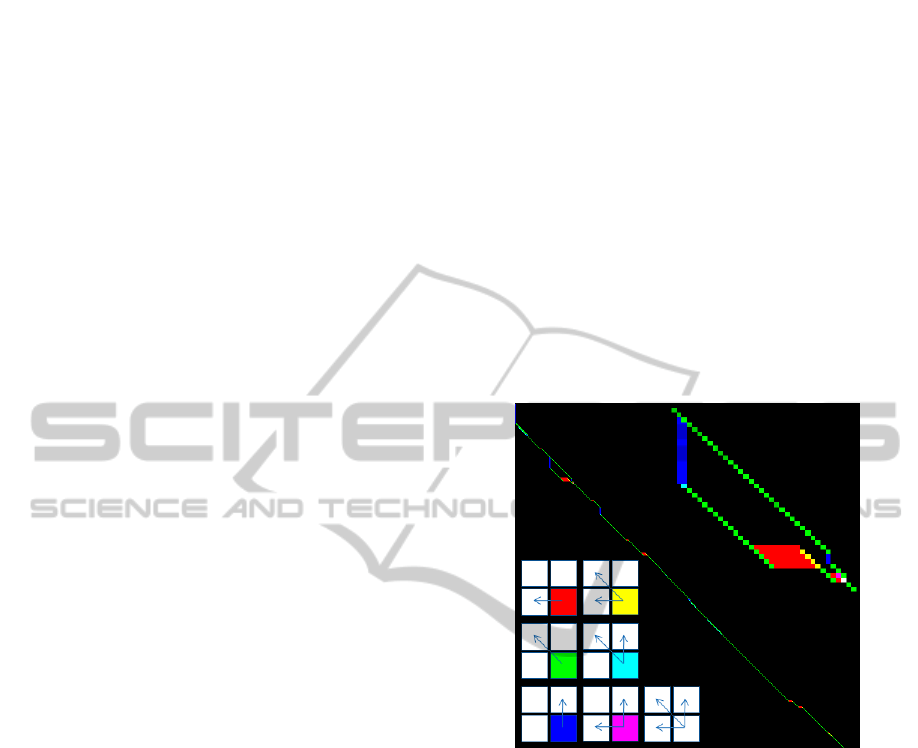
Figure 1: Paths returned for a pair of scanlines. Colours –
legend given in the bottom left – show valid direction(s)
which can be followed to produce an optimal alignment.
Zoom on an area with alternative paths is provided in the
top right of the figure.
2.2.3 Scope
Traditional stereo matching algorithms are applied
on rectified pair of images which share a ‘sufficient’
amount of overlap. To our knowledge, no
statistically reliable study has quantified that
amount. Since we use a bioinformatics-inspired
framework, we propose to get an insight about this
by investigating the confidence which is given to
protein alignments according to the amounts of
overlap and mutations.
Due to the availability of protein sequences, e.g.
more than 20 million entries in UniProt (Leinonen,
et al., 2004), and its usage in major international
projects such as the Human Genome Project
(International Human Genome Sequencing
VISAPP 2011 - International Conference on Computer Vision Theory and Applications
468
Consortium, 2001), the validity of sequence
alignments have been the subject of statistical and
experimental studies (Karlin & Altschul 1990),
(Pearson, 1998) and (Rost, 1999). Those statistics
were integrated in the main sequence alignment
servers (Altschul, et al., 1997) and (Mackey, et al.,
2002). The outcome of these studies can be
illustrated by the graph produced by Rost (Rost,
1999), where alignment meaningfulness is expressed
according to the number of characters which can be
aligned (i.e. overlap) and the percentage of
characters with identical values (see Fig. 2).
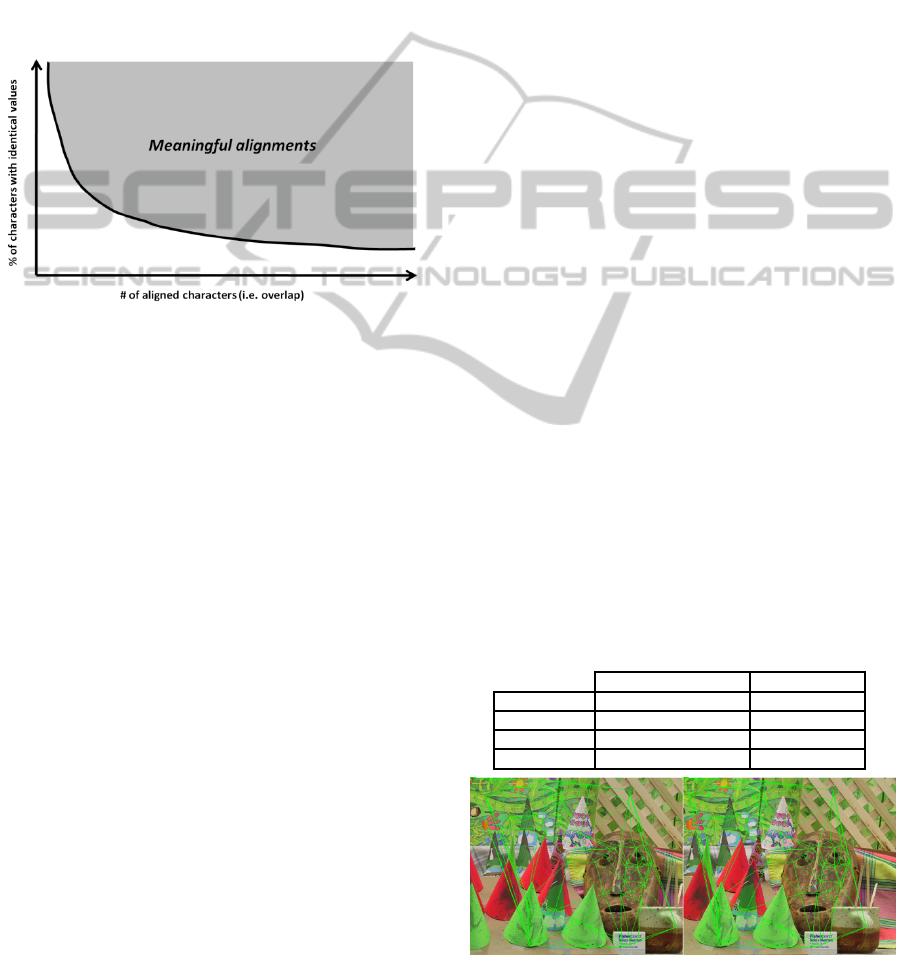
Figure 2: Expression of protein alignment meaningfulness
according to the number of characters which can be
aligned (i.e. overlap) and the percentage of characters with
identical values, adapted from (Rost 1999).
In this paper, we propose to produce such a curve for
stereo pair images and infer from it if alignments are
meaningful.
3 RESULTS
3.1 Experimental Setup
In order to validate our algorithm, experiments are
conducted using the benchmarking framework from
Middlebury (Scharstei et al. 2002-2003), which has
been largely accepted by the computer vision
community for objective comparison of stereo
matching algorithms.
When several optimal solutions are returned by
our algorithm, the selection of a unique solution is
achieved by applying the 32 different constraints
imposing scanline continuity. Finally, when
specified, disparity maps are post-processed by a
median filter (MF), which has been shown as a
powerful and simple way to improve results
(Mühlmann, et al., 2002).
3.1.1 Automatic Parameter Configuration
First score parameters, i.e. match, gap and extended
gap, must be configured. Since they are sensitive to
image characteristics, they need to be customised for
each stereo pair. If the actual disparity map is
known, an optimisation function can be applied to
maximise matching accuracy. Although such
process allows evaluating the best possible
performance of an algorithm, it does not have
practical applications.
Therefore, a methodology for automatic
parameter configuration is required. We propose to
generate a pseudo ground truth disparity map by
establishing sparse pixel correspondences using the
SIFT algorithm (Scale Invariant Feature Transform).
Key points on corresponding scanlines are paired
and used to calculate disparity values (code available
at www.cs.ubc.ca/~lowe/keypoints/). However,
since only a few pairs are detected (fewer than 100
for images from the Middlebury dataset), this initial
set is not suitable for parameter optimisation. In
order to increase this number, Delaunay
triangulation is applied to estimate the disparity of
more pixels (see Fig. 3). Using the key points as
vertices, homographic transformations between both
meshes can be calculated for each triangle. These
transformations are then used to estimate a larger set
of disparity values. Obviously, this approximation
can only be considered as valid for small triangles:
in this work, only triangles whose sides are shorter
than 15 pixels are used. As Table 3 shows, those
disparity values are very accurate since they have an
average pixel error below 0.5. Consequently, such
disparity maps can be considered as ground truth
and used for parameter optimisation.
Table 3: Automatic ground truth generated for parameter
configuration and its estimated error.
# of disparity points Average error
Cones
657 0.36
Teddy
190 0.46
Venus
211 0.27
Tsukuba
600 0.45
Figure 3: Delaunay triangulation of left and right images
using the generated pairs of key points.
BIOINFORMATICS INSPIRED ALGORITHM FOR STEREO CORRESPONDENCE
469
3.2 Performances
3.2.1 Stereo-pair Correspondences
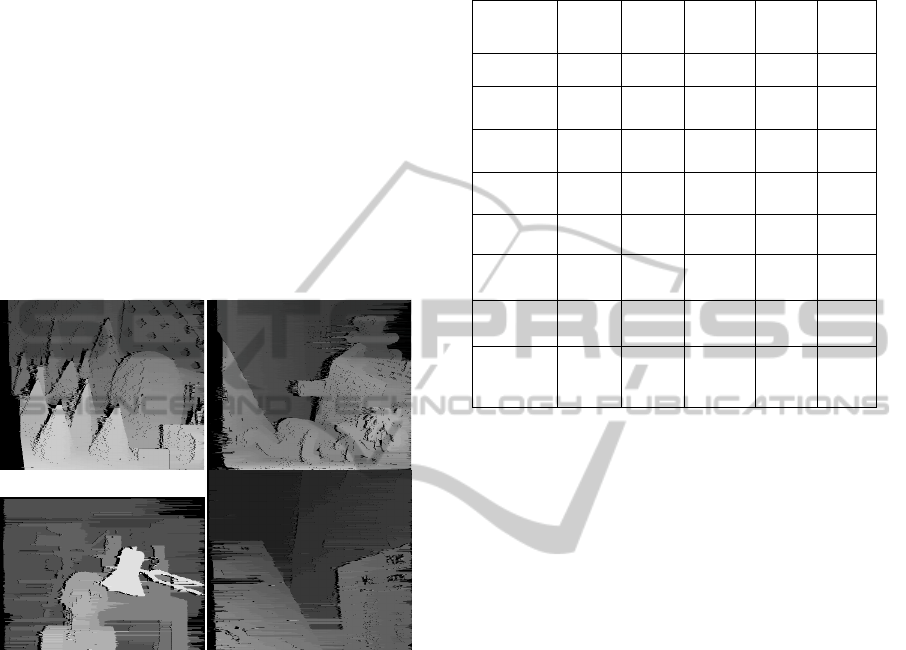
Fig. 4 shows raw disparity maps, i.e. without
smoothing, obtained for the images used in the
Middlebury framework. In Table 4, quantitative
results are provided to validate our algorithm. The
table quantifies the introduction of extended gaps
(EG) and the procedure for automatic parameter
selection (AP). In addition performances are
provided for state of the art methods: the reference
for scanline-based DP (Bobick & Intille 1999), tree-
based DP which addresses inter-scanline coherence
in the optimisation process (Veksler, 2005) and
(Deng & Lin 2006), and a segment-based stereo
matcher (Klaus et al. 2006).
Figure 4: Disparity maps.
When optimising parameters using the ground truth
disparity map as other methods do, in its most
advanced configuration (i.e. our approach +EG
+MF) the proposed framework outperforms
Bobick’s (Bobick & Intille 1999). Although, in
terms of accuracy it cannot compete with the more
computationally expensive approaches, ours could
operate in real time as shown by (MacLean, et al.,
2010).
Analysis of Table 4 confirms that the inclusion
of extended gaps suits the nature of occlusions since
performances are significantly improved. Moreover,
as expected, the application of a median filter on
disparity maps, which introduces some inter-
scanline coherence, increases accuracy. Finally,
results obtained using the AP configuration
demonstrates that, although performances are
degraded compared to those produced by a system
using optimal parameters, they are still satisfactory.
For example, our approach outperforms Bobick’s
(Bobick & Intille 1999) in 3 image pairs out of 4.
Table 4: Performance comparison.
%
Tsukuba
(non occ)
Venus
(non occ)
Teddy
(non occ)
Cones
(non occ)
All (bad
pixels)
Klaus et al.
2006
1.11 0.11 4.22 2.48 4.23
Veksler 2005
1.99 1.41 15.9 10.0 11.7
Deng & Lin
2006
2.21 0.46 9.58 3.23 6.82
Bobick &
Intille 1999
4.12 10.1 14.0 10.5 14.2
Our
approach
6.67 12.0 15.5 12.7 18.6
Our
approach
+EG
6.74 10.7 14.1 11.0 16.7
Our
approach
+EG +MF
4.63 7.40 10.7 7.75 13.4
Our
approach
+AP +EG
+MF
7.61 7.87 10.8 8.59 14.9
EG: with extended gaps
AP: with automatic parameter selection
MF: with median filter
These results confirm the validity of the analogy
made between stereo matching and protein sequence
alignment.
3.2.2 Stereo Matching Meaningfulness
Following the efforts of Rost (Rost 1999) who
experimentally defined a curve under which protein
alignment may become meaningless (see Fig. 2), we
have produced a similar graph plotting accuracy as a
function of image overlap and pixel similarity to
express the meaningfulness of matching an image
pair.
In this section, we consider that the alignment
between two scanlines L and R is meaningful if the
optimal score obtained for this alignment according
to the scoring matrix is the highest score that L can
achieve against any scanline of the right image.
In the original paper by Rost, results were plotted
in a graph showing the number of residues aligned
versus the percentage of character similarity. In our
particular case, we can assimilate the number of
aligned characters as the number of pixels matched
between the images, or equivalently, the percentage
of overlap between the images. Regarding the
second axis, it can be understood as the percentage
of identical pixels existing between both images.
VISAPP 2011 - International Conference on Computer Vision Theory and Applications
470
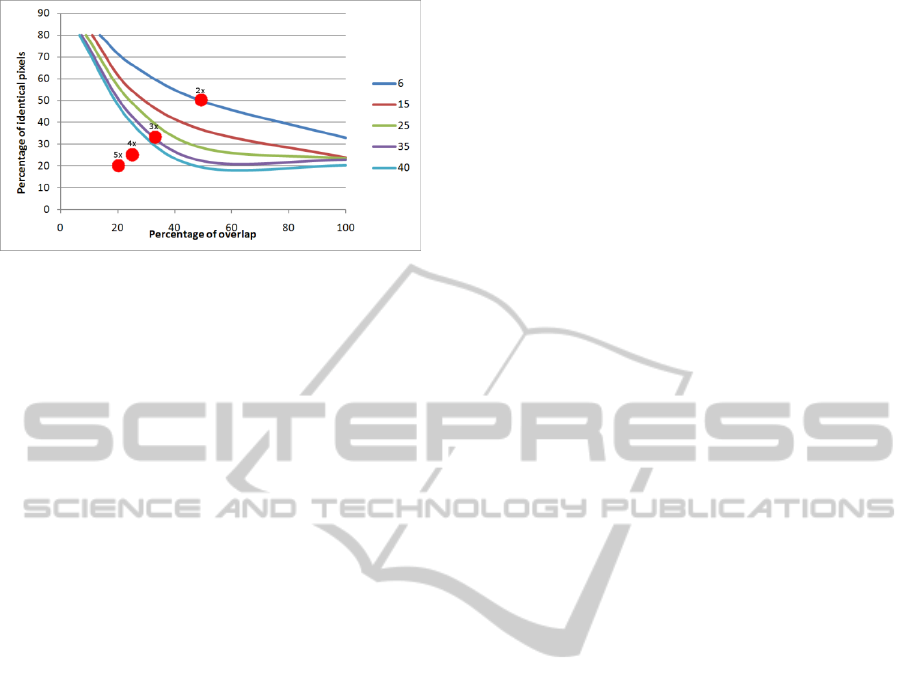
Figure 5: Scanline correspondence errors according to
overlap and pixel similarity. Red dots show where
matching experiments between an image and its zoomed
version (from 2x to 5x) would fit on this graph.
Unlike in bioinformatics, pixel value changes have a
continuous nature, Consequently, the estimation of
pixel similarity between a pair of stereo images
would depend on a threshold. In order to have an
absolute control of all variables, the conditions of
the matching experiments were simplified. Our
algorithm was applied to match an image with a
tranformed version of itself. Pixel identity was
controlled by adding ‘salt and pepper’ noise to the
image, while the percentage of overlap was
simulated by removing the required number of pixel
columns. On Fig. 5, points are connected according
to the measure accuracy in terms of percentage of
scanlines matching the correct scanlines (see Fig. 6).
Thus, a set of curves were created highlighting the
image pair characteristics required to obtain
matching errors between 6% and 40%. As expected
the shape of these curves is very similar to Rost’s
(Fig. 2), which reinforces the value of our analogy
between stereo matching and protein sequence
alignment. As in Rost’s case, we believe the graph in
Fig. 5 can estimate the meaningfulness of stereo
correspondences using image overlap and the
number of identical pixels as parameters.
In order to test this hypothesis, we propose to
predict the outcome of matching image pairs
captured at different resolution. On Fig. 5, we have
plotted in red the estimated overlap and pixel
similarity between images where the second one was
taken with a zoom of 2x, 3x, 4x and 5x. Using the
predictive accuracy suggested by the curve set, one
can infer that matching with 2x or 3x image should
provide meaningful results, whereas results obtained
for pairs including a 4x or 5x zoomed image should
be meaningless. These predictions are tested in the
next section.
3.2.3 Matching Images Captured
at Different Resolutions
First, to evaluate the predictions made from the
meaningfulness graph, the ‘cone’ image and its
zoomed versions were processed using our
algorithm. Here, the extended gap feature is
deactivated since the assumption it is based on is not
valid when dealing with images captured at different
resolutions. Each scanline of the standard image was
aligned against all scanlines of the zoomed image.
The alignment with the highest score in the scoring
matrix is then automatically selected to determine
matching scanline pairs.
Fig. 7 shows the results of this procedure for
different zoom values. As expected, the
performances worsen with zoom increase. In the
case of x2 and x3 zooms, correspondences between
lines are usually correct or shifted by only a few
lines, correlations between actual and predicted
corresponding scanlines are 0.997 and 0.643
respectively. However, matching using x4 and x5
zooms produces associations which are often
meaningless as quantified by the calculated
correlations, i.e. 0.495 and 0.209 respectively. These
experimental results confirm the predictions
formulated using the meaningfulness graph.
Although finding meaningful correspondences
between lines is essential for accurate stereo
matching, it is not sufficient to assess the quality of
pixel matching itself. Consequently, we undertook a
second experiment where we calculated pixel
correspondences between the left and the right
images of the ‘cone’ stereo pair, where the right
image was subject to a zoom transformation. Here,
we assume that line pairings between the left and
right images are known. In practice, if dealing with
static cameras, this can be calculated if the zoom
ratio is known. Otherwise, the procedure described
in the previous experiment can be used to initialise a
line pairing optimisation algorithm. Colour images
in Fig. 6 show pairs of images, i.e. a) and b) where
the lines of the left image were removed so that both
images have the same number of scanlines. Images
c) and d) display calculated and actual disparity
maps. In agreement with the previous experiment,
only usage of x2 and x3 zooms produces meaningful
results, even if, in the case of x3 zoom experiment,
the accuracy is poor.
BIOINFORMATICS INSPIRED ALGORITHM FOR STEREO CORRESPONDENCE
471
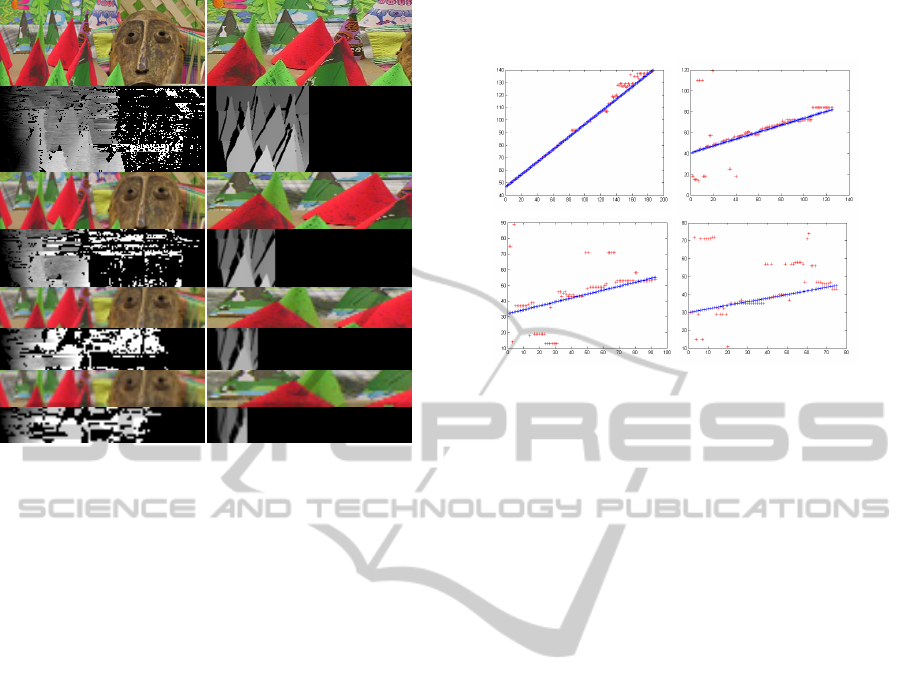
Figure 6: a) Left and b) right images used for zoom x2, x3,
x4 and x5, c) corresponding computed and d) ground truth
disparity maps.
4 CONCLUSIONS
The main contribution of this paper resides in the
exploitation of the analogy between protein
sequence alignment and image pair correspondence
to design a bioinformatics-inspired framework for
stereo matching based on dynamic programming.
Not only does this approach offer accurate results
with an algorithm which is suitable for real-time
implementation, but it motivated the creation of a
meaningfulness graph, which helps to predict
matching validity according to image overlap and
pixel similarity. This graph led to the application of
the proposed method to the unexplored scenario of
stereo matching between images captured at
different resolutions. Experimental results reveal
that good performance can be obtained when there is
a ratio of 2 between the resolutions of a pair of
images.
Another contribution of this work is an automatic
procedure to estimate automatically all matching
parameters. Conducted experiments showed that
high quality sparse pixel correspondences generated
by the SIFT algorithm could be extended using a
Delaunay triangulation approach to generate a
partial disparity map suitable for parameter
optimisation.
In future work, we intend to exploit further the
computer vision/bioinformatics analogy by
considering video frames as leaves of a phylogenetic
tree.
Figure 7: Correspondences between lines on the standard
and zoomed images for zooms of a)2x, b)3x, c)4x and
d)5x: calculated (red) and ground truth (blue).
REFERENCES
Altschul, S. F., Madden, T. L., Schäffer, A. A., Zhang, J.,
Zhang, Z., Miller, W., Lipman, D. J., 1997. Gapped
BLAST and PSI-BLAST: a new generation of protein
database search programs. Nucleic Acids Research, 25,
pp.3389-3402.
Baker, H., Binford, T., 1981. Depth from edge and
intensity based stereo. In IJCAI81, pp.631–636.
Belhumeur, P. N., 1996. A Bayesian approach to binocular
stereopsis. International Journal of Computer Vision,
19(3), pp.237–260.
Bobick, A. F., Intille, S. S., 1999. Large occlusion stereo.
International Journal of Computer Vision, 33(3),
pp.181–200.
Cox, I. J., Hingorani, S. L., Rao, S. B., Maggs, B. M.,
1996. A maximum likelihood stereo algorithm.
Computer Vision and Image Understanding, 63(3),
pp.542–567.
Dayhoff, M. O., Eck, R. V., Chang, M. A., Sochard, M.
R., 1965. Atlas of Protein Sequence and Structure
1965, National Biomedical Research Foundation,
Silver Spring, Maryland.
Dayhoff, M. O., 1978. Atlas of Protein Sequence and
Structure, Suppl 3, National Biomedical Research
Foundation, Silver Spring, Maryland.
Deng, Y., Lin, X., 2006. A fast line segment based dense
stereo algorithm using tree dynamic programming. In
European Conference on Computer Vision, Graz,
Austria, May 7 - 13, 2006.
Edgar, R. C., 2004. MUSCLE: a multiple sequence
alignment method with reduced time and space
complexity. BMC Bioinformatics, 5, pp.113.
Forstmann, S., Kanou, Y., Ohya, J., Thuering, S., Schmitt,
A., 2004. Real-Time Stereo by using Dynamic
Programming, In Computer Vision and Pattern
VISAPP 2011 - International Conference on Computer Vision Theory and Applications
472

Recognition Workshop, Washington, DC, USA, 27
June-2 July 2004.
Geiger, D., Ladendorf, B., Yuille, A., 1992. Occlusions
and binocular stereo. In European Conference on
Computer Vision, pp.425–433.
Henikoff, S., Henikoff, J., 1992. Amino acid substitution
matrices from protein blocks. Proceedings of the
National Academy of Sciences, 89, pp.10915-10919.
Higgins, D., Thompson, J., Gibson, T., Thompson, J. D.,
Higgins, D. G., Gibson, T. J., 1994. CLUSTAL W:
improving the sensitivity of progressive multiple
sequence alignment through sequence weighting,
position-specific gap penalties and weight matrix
choice. Nucleic Acids Research, 22, pp.4673-4680.
International Human Genome Sequencing Consortium,
2001. Initial sequencing and analysis of the human
genome. Nature, 409, pp.860-921.
Karlin, S., Altschul, S. F., 1990. Methods for assessing the
statistical significance of molecular sequence features
by using general scoring schemes. Proceedings of the
National Academy of Sciences, 87, pp.2264-2268.
Klaus, A, Sormann, M, Karner, K, Segment-based stereo
matching using belief propagation and a self-adapting
dissimilarity measure, ICPR 3, pp. 15–18.
Lassmann, T., Sonnhammer, E. L. L., 2005. Kalign - an
accurate and fast multiple sequence alignment
algorithm. BMC Bioinformatics, 6, pp.298.
Lazaros, N., Sirakoulis, G. C., Gasteratos A., 2008.
Review of Stereo Vision Algorithms: From Software
to Hardware. International Journal of
Optomechatronics, 2(4), pp.435 – 462.
Leinonen, R., Diez, F. G., Binns, D., Fleischmann, W.,
Lopez, R., Apweiler, R., 2004. UniProt Archive.
Bioinformatics, 20, pp.3236-3237.
Mackey, A. J., Haystead, T. A., Pearson, W. R., 2002.
Getting more from less: algorithms for rapid protein
identification with multiple short peptide sequences.
Molecular and Cellular Proteomics, 1(2), pp.139-147.
MacLean, W. J., Sabihuddin, S., Islam, J., 2010.
Leveraging cost matrix structure for hardware
implementation of stereo disparity computation using
dynamic programming. Computer Vision and Image
Understanding, In Press.
Mühlmann, K., Maier, D., Hesser, J., Männer, R. 2002.
Calculating Dense Disparity Maps From Color Stereo
Images, An Efficient Implementation. International
Journal of Computer Vision, 47(3), pp.78–88.
Needleman, S. B., Wunsch, C. D., 1970. A general method
applicable to the search for similarities in the amino
acid sequence of two proteins. Journal of Molecular
Biology, 48(3), pp.443–53.
Notredame, C., Higgins, D., Heringa, J., 2000. T-Coffee:
A novel method for multiple sequence alignments.
Journal of Molecular Biology, 302, pp.205-217.
Ohta, Y., Kanade, T., 1985. Stereo by intra- and
interscanline search using dynamic programming.
IEEE TPAMI, 7(2), pp.139–154.
Pearson, W. R., 1998. Empirical statistical estimates for
sequence similarity searches. Journal of Molecular
Biology, 276, pp.71-84.
Rost, B., 1999. Twilight zone of protein sequence
alignments. Protein Engineering. 12(2), pp.85-94.
Salmen, J., Schlipsing, M., Edelbrunner, J., Hegemann, S.,
Lueke, S., 2009. Real-time stereo vision: making more
out of dynamic programming. In International
Conference on Computer Analysis of Images and
Patterns, Münster, Germany, Sept. 2-4, 2009.
Scharstein, D., Szeliski, R, 2002. A taxonomy and
evaluation of dense two-frame stereo correspondence
algorithms. International Journal of Computer Vision,
47(1), pp.7-42.
Scharstein, D., Szeliski, R., 2003. High-accuracy stereo
depth maps using structured light. In IEEE Computer
Society Conference on Computer Vision and Pattern
Recognition (CVPR 2003), vol. 1, pp. 195-202, June
2003.
Torr, P. H. S., Criminisi, A., 2004. Dense stereo using
pivoted dynamic programming.
Image and Vision
Computing, 22(10), pp.795-806.
Veksler, O., 2005. Stereo correspondence by dynamic
programming on a tree. In Computer Vision and
Pattern Recognition, San Diego, CA, USA, 20-26
June 2005.
Wang, L., Liao, M., Gong, M., Yang, R., Nistér, D., 2006.
High-quality real-time stereo using adaptive cost
aggregation and dynamic programming. In 3D Data
Processing, Visualization and Transmission. Chapel
Hill, USA, June 14-16, 2006.
BIOINFORMATICS INSPIRED ALGORITHM FOR STEREO CORRESPONDENCE
473
