
Vowel-consonant Speech Segmentation
by Neuromorphic Units
Pedro Gómez-Vilda, Roberto Fernández-Baíllo, Victoria Rodellar-Biarge
GIAPSI, Facultad de Informática, Universidad Politécnica de Madrid
Campus de Montegancedo, s/n, 28660 Boadilla del Monte, Madrid, Spain
José Manuel Ferrández-Vicente
Universidad Politécnica de Cartagena, Campus Universitario Muralla del Mar
Pza. Hospital 1, 30202 Cartagena, Spain
Abstract. For the time being speech is still a much complex process far from
being fully understood. To gain some insight on specific open problems in its
automatic treatment (recognition, synthesis, diarization, segmentation, etc.)
neuromorphisms and knowledge derived from the understanding on how the
Auditory System proceeds may be of crucial importance. The present paper
must be seen as in a series of preliminary work carried out trying to translate
some of this understanding to solve specific tasks as speech segmentation and
labelling in a parallel way to the neural resources found in the Auditory
Pathways and Cortex. The bio-inspired (neuromorphic) design of some
elementary units covering simple tasks as formant tracking or formant
dynamics is exposed. In a further step it is shown how simply neural circuits
employing these units may convey successful vowel-consonant separation
independently of the speaker. The paper is completed with the discussion on
how this processing may be used to develop specific applications as in Speech
Segmentation and Diarization and in Speaker Characterization.
1 Introduction
Speech Processing remains a very open field to research on which much progress has
been done, but understanding how speech is processed by the human brain is still far
from being complete. Besides, there is a feeling that speech processing may benefit
from bioinspired knowledge, since the view-broadening work of [10]. In this way new
paradigms helping to better understand the underlying brain processes involved in
speech perception and comprehension are being sought [7], [13]. In previous research
it has been shown that Neuromorphic Speech Processing may be carried out using
Hebbian neuron-like units and simple neural circuits implemented with them to
reproduce the behaviour of dynamic formant detection typical in consonant-like
sounds [5], [6]. The objective of the present work is aimed to extend previous work
which defined a layered architecture of artificial Neuron-like Units derived from the
functionality of the main types of neurons found in the Auditory Pathways from the
Cochlea to the Primary and Secondary Auditory Cortex. This architecture is made of
Gómez-Vilda P., Fernández-Baíllo R., Rodellar-Biarge V. and Ferrández-Vicente J..
Vowel-consonant Speech Segmentation by Neuromorphic Units .
DOI: 10.5220/0003306000140027
In Proceedings of the 1st International Workshop on AI Methods for Interdisciplinary Research in Language and Biology (BILC-2011), pages 14-27
ISBN: 978-989-8425-42-3
Copyright
c
2011 SCITEPRESS (Science and Technology Publications, Lda.)

simple units based on a General Neuromorphic Computing Unit (GNCU). This
structure was defined using well-known paradigms from mask Image Processing [11].
In previous work the configuration of different masks to implement Lateral Inhibition
and Formant Tracking was discussed. In the present work the patterning of stable and
unstable formant tracking will be presented to deepen in the detection of vowel-like
and consonant-like speech fragments as an extension towards a fully Bio-inspired
Speech Processing Architecture. For such, a brief description of formants and formant
dynamics is given in section 2. In section 3 a brief review of the units found in the
Auditory Pathway will be given. The structure of the GNCU is summarized, the
interested reader being addressed to Gómez [4] for further details. In section 4 simple
circuits implementing Lateral Inhibition, Formant Tracking (static and dynamic) and
Mutual Exclusion are presented, as well as the results produced by each one of them.
An example of vowel-consonant detection is also given. Conclusions and future work
are presented in section 5.
2 Dynamics in Speech
Speech may be defined as a communication-oriented activity consisting in the
production of a sequence of sounds which convey a complex information code
derived from language. These sounds are radiated mainly through lips and when
captured by a microphone result in recorded speech. When observed in the time
domain, speech looks like a chain of pseudo-periodic spike-like patterns, which
correspond mainly to vowel bursts (beads-on-a-string paradigm). If observed in the
frequency domain the FFT spectrogram is composed by horizontal bands spaced by a
common interval in frequency, which is the fundamental frequency f0 or pitch. The
articulation capabilities of the vocal and nasal tracts reduce or enhance the frequency
contents of the resulting sound, which is perceived by the human Auditory System as
a flowing stream of stimuli distributed accordingly with the dominant frequencies
present in it. An injection of complex spike-like neural stimuli is released from the
Cochlea to the Auditory Nerve fibres [1] which are distributed to the Auditory
Primary and Secondary Areas over the Cortex. Speech Perception is a complex
process which results as a combination of different pattern recognition tasks carried
out by neural structures hidden in these areas. Two important observations may be
highlighted in Speech Perception: That speech sounds are dominated by certain
enhanced bands of frequencies called formants in a broad sense, and that the
assignment of meaning is derived both from dominant frequency combinations as
well as from the dynamic changes observed in these combinations in time. Therefore
speech perception can be seen as a complex parsing problem of time-frequency
features. The most meaningful formants in message coding are the first two: f
1
(for
male voice may roughly lay in the range of 250-650 Hz) and f
2
(sweeping a wider
range, from 700 to 2300 Hz) in order of increasing frequency. The present paper is
devoted in its most part to establish good strategies to differentiate static (vowel-like)
vs dynamic (consonant-like) formant dynamics to further serve in speech labelling.
As such, a good example mixing vowels and semi-consonant sounds as the one in 0 is
taken as an examination target. The structure of the sentence is very much dominated
15
by formant dynamics, and vowels are perceived as evanescent and short, therefore
static-dynamic detection is relatively complicate in this example.
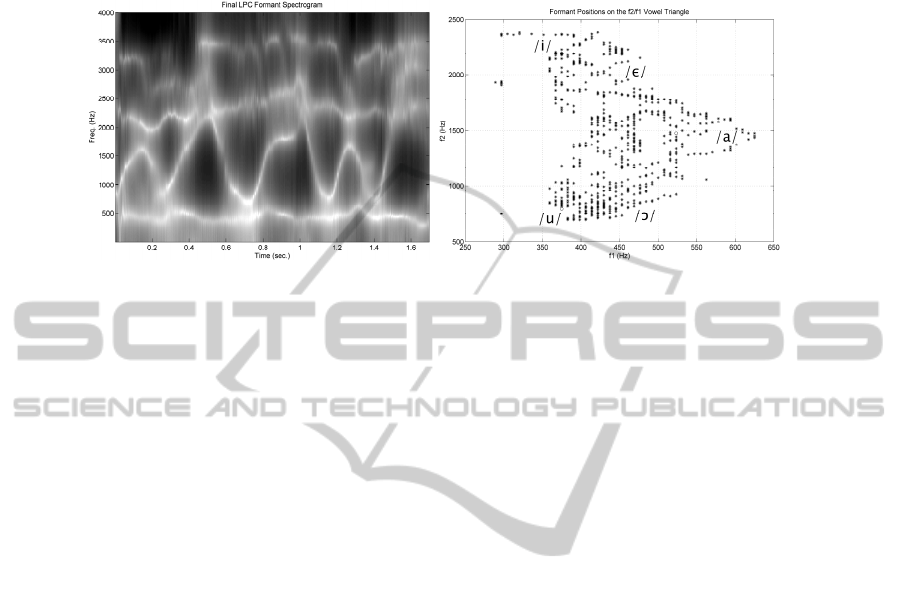
Fig. 1. Top: Linear Predictive Coding (LPC) Spectrogram of the speech frame /Where were you
while you were away/, phonetically described as [hωεſωεſjuhωaeljuωεſaωεj] uttered by a male
speaker. The IPA has been used for annotation (see IPA). Bottom: Vowel triangle showing five
reference vowels in English framing the formant trajectories of the utterance.
In the figure it can be observed that the first formant is oscillating between 350
and 650 Hz, whereas the second formant experiences abrupt fluctuations between 700
and 2200 Hz. Higher positions of the second formant point to front vowel-like [ε, i] or
consonant-like [j] sounds, whereas lower ones correspond to back vowel-like [u] or
consonant-like [ω] sounds. The positions of [ε, i, a, u] correspond to the zones where
the formant positions are stable or slightly changing, as around the peaks of f
2
whereas the positions of [j, ω] correspond to the complementary intervals where
strong dynamic changes of formant positions can be observed. When plotting f
2
vs f
1
formant trajectories appear as clouds of dots showing the dispersion of formants on
the vowel triangle. The vertices mark the positions of the extreme front [i], back [u]
and middle [a] vowels. Stable positions produce clouds of dots where formant plots
are denser, whereas dynamic or changing positions produce trajectories, appreciated
in the figure as bead-like lines. Formant transitions from stable Characteristic
Frequencies (CF) to new CF positions (or virtual loci, [16]) are known as FM
(frequency modulation) components.
3 Neuromorphic System
The structure responsible for Speech Perception is the Auditory System, described in
0 as a chain of different sub-systems integrated by the Peripheral Auditory System
(Outer, Middle and Inner Ear) and the Higher Auditory Centres. The most important
organ of the Peripheral Auditory System is the Cochlea (Inner Ear), which carries out
the separation in frequency and time of sound and its transduction from mechanical to
neural activity. Electrical impulses propagate from the Cochlea (Hair Cells) to higher
neural centres through auditory nerve fibres with different characteristic frequencies
(CF) responding to the spectral components (or harmonics f
0
, f
1
, f
2
...) of speech.
Within the cochlear nucleus (CN) different types of neurons are specialized in
16

specific processing. The Cochlear Nucleus feeds information to the Olivar Complex,
where sound localization is derived from inter-aural differences, and to the Inferior
Colliculus (IC) organized in orthogonal iso-frequency bands. Delay lines are found in
this structure to detect temporal features. The thalamus (Medial Geniculate Body) acts
as a last relay station, and as a tonotopic mapper of information to the Primary
Auditory cortex (AI).
Fig. 2. Speech Perception Model. Simplified main structures found in the Auditory Pathways.
The functionality of the different types of neurons found in the Auditory Pathways
is the following:
• Pl: Primary-like Units. Reproduce the firing stream found at its input (relay
stages).
• On: Onset Units. Detect the leading edge of a firing stream.
• Ch: Chopper Units. Divide a continuous stimulus into slices of different size.
• Pb: Pauser Units. Delay lines, firing sometime after the stimulus onset.
• CF: Characteristic Frequency Units. Respond to narrow bands tonotopically
organized.
• FM: Frequency Modulation Units. Detect changes in the characteristic frequency
(dynamic speech features).
• NB: Noise Burst Units. React to broadband stimuli, as those found in unvoiced
consonants.
• Bi: Binaural Units. Specific of binaural hearing by contrasting phase-shifted
stimuli.
• Cl: Columnar Units. Organized linearly in narrow columns through the layers of
the Auditory Cortex. Their function seems to be related with short-time storage and
retrieval of pre-learned patterns [12].
• Ec: Extensive Connectors. The outer layers of the Auditory Cortex seem to be
dominated by extensive connections among distant columns.
The Neuromorphic Speech Processing Architecture defined in 0 is intended to cover
some of the functionalities of vowel-like and consonant-like detection and labelling. It
is composed of different neurons (GNCU's) as the one defined in
[4] organized in
consecutive layers to mimic some of the speech processes of interest in the present
study. It is important to remark that the basic structure and functionality of the GNCU
is specifically based on the Hebbian Neuron [9]. This architecture is composed by
different layers of specific GNCU’s mimicking the physiological units found in the
Auditory Pathways accordingly with the description given above as follows:
• LIFP: Lateral Inhibition Formant Profilers, reducing the number of fibres firing
simultaneously.
17
• +f
M1-K
,
-f
M1-K
: Positive and Negative Slope Formant Trackers (K bands) detecting
ascending or descending formant activity.
• f1
1-K
, f2
1-K
: First and Second Energy Peak Tracker, intended for formant detection
mimicking CF neurons.
• +fM
1-k1
, -fM
1-k1
, +fM
1-k2
, -fM
1-k2
: These are integrators of activity from previous
Formant Tracker Integration Units on certain specific bands (350-650 Hz for the first
formant, or 700-2300 Hz for the second formant).
• +fM
1
, -fM
1
, +fM
2
, -fM
2
: First and Second Formant Mutual Exclusion Units
(positive and negative slopes).
• NB
1-k
: Noise Burst Integration Units for wideband activity.
• VSU: Voiceless Spotting Units. These units integrate the outputs of different
ΣNB’s acting in separate bands to pattern the activity of fricative consonants.
• WSU: Vowel Spotting Units. These integrate the activity of Σf1 and Σf2 units to
detect the presence of vowels and their nature, and are a main target of the present
study.
• DTU: Dynamic Tracking Units. These integrate the activity of different dynamic
trackers on the first two formants to detect consonant dynamic features, and are also
described in detail.
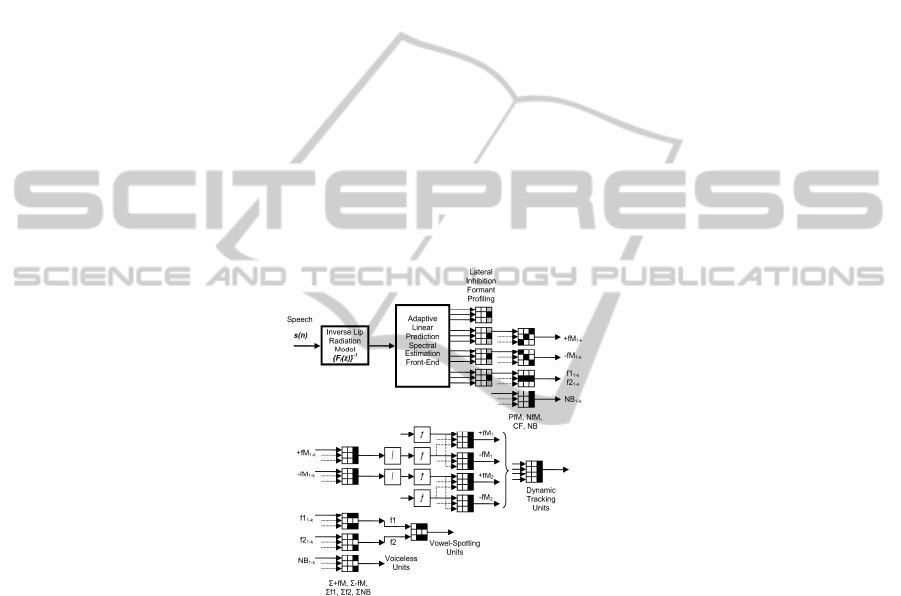
Fig. 3. Neuromorphic Speech Processing Architecture for a mono-aural channel. Each neuron
is implemented as a GNCU [4], represented by its mask. Blocks (∫) and (ƒ) are integrators and
non-linear thresholds.
4 Results
From what has been exposed a clear consequence may be derived: formant structure
plays a major role in the vowel and consonantal structure of speech. Formant
detection, tracking and grouping in semantic units must play a crucial role in speech
understanding. Therefore the simulation of these functionalities by neural-like simple
units may be of most importance for neuromorphic speech processing. In what
follows some of the capabilities of these structures will be shown with emphasis in
18

the detection of static vs dynamic features. For such, some of the structures described
in the Neuromorphic Speech Processing Architecture shown in 0 will be briefly
reviewed and simulated, and the results obtained from their activity will be presented
and discussed. These are the following:
• Lateral Inhibition Formant Profiling Units
• Positive Slope Formant-Tracking Units (+f
M1-K
)
• Negative Slope Formant-Tracking Units (-f
M1-K
)
• First and Second Peak Trackers (f1
1-K
, f2
1-K
)
• First-Formant Uphill Units (+fM
1
)
• First-Formant Downhill Units (-fM
1
)
• Second-Formant Uphill Units (+fM
2
)
• Second-Formant Downhill Units (-fM
2
)
The details of the architecture are the following: K=512 units are used as
characteristic frequency outputs from the Auditory Peripheral Front-End, defining a
resolution in frequency of little less than 8 Hz for a sampling frequency of 8000Hz.
These 512 channels are sampled each 2 msec. to define a stream of approximately 500
pulses/sec per channel.
Lateral Inhibition Formant Profiling Units. The first neuromorphic task simulated
is formant profiling from the auditory broad-band spectrogram as shown in 0 below.
In the figure a possible layered structure is represented where the activity expressed
by Channel Units excite an output m-Channel Unit, and inhibit the neighbour ones, as
given by the function:
)}n(x)n(x)n(x{u
)n(y
AmAmAm
Bm
11
2121
+−
−−=
=
(1)
The results of sweeping the auditory spectrogram in 0 (top) with one such layer
produces the results shown in 0, where the pre-threshold (A: top) and post-threshold
activity (B: Bottom) are presented. The threshold function u{.} is the unit step. The
pre-threshold activity shows the typical “Mexican Hat” behaviour. The transition
from time-frequency detailed spatiotemporal structure of the responses of the auditory
nerve to specific CF/CF and FM/FM responses found in the primary auditory cortex
(AI) of the moustached bat by Suga (2006) show important reductions in spike firing
rates.
Fig. 4. Formant profiling from LPC broad-band spectrogram in 0 (top) by lateral inhibition
units (Ascending Auditory Pathway). Dark synapses mean inhibition, white ones stand for
excitation. Pre-threshold (A) and post-threshold (B) clipped spots monitor activity.
19
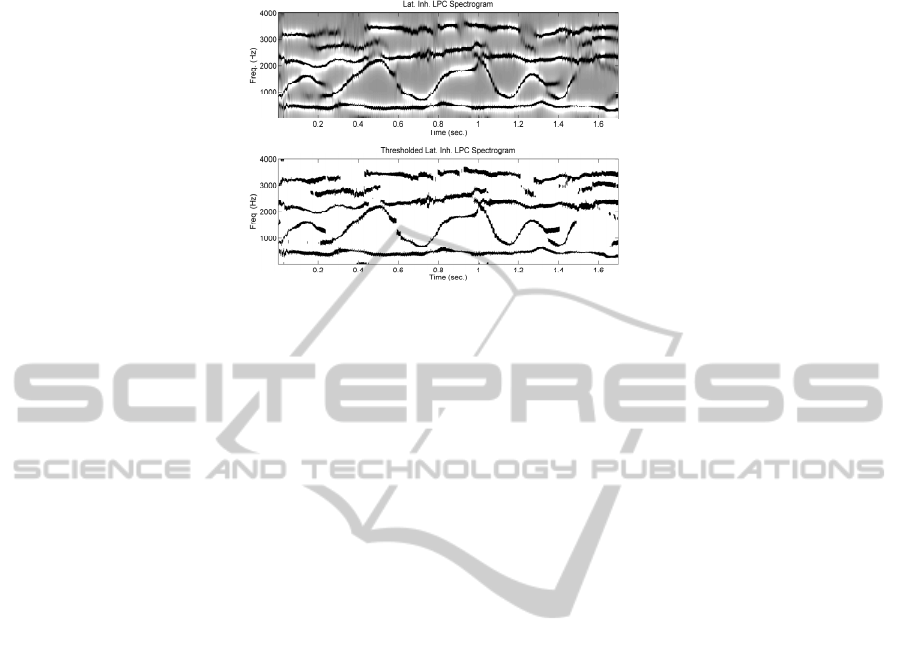
Fig. 5. Top: Pre-threshold activity as hypothetically measured in (A). Bottom: Post-threshold
activity, as in (B). Compare the formant patterns produced against the input broad-band
spectrum.
This reduction may be due to lateral inhibition, which is a strategy well documented
in natural neural systems. This belief is also supported by the strong reduction in
spike firing rates found in the lower levels of the auditory pathways as compared with
the firing rates in the human AI areas which suggest the presence of compression
mechanisms both in the time and in the frequency domain [8].
Static Formant-profiling Units (CF). The units implementing CF detection are
similar to the ones used for slope-tracking (see 0), as this may be seen as a special
case for small or near-zero slopes. To obtain the results shown in 0 a 9-delay unit has
been used. In the upper part of the figure the patterns corresponding to the formant
detection by CF units reproduce the trajectories of the first four formants. The pauser-
delay units introduce different delays (between 2 and 16 msec) in the afferent paths
from an m-th channel unit, and these are summed and integrated as:
})in(x{u)n(y
m
J
Jj
I
i
jAmBm
θ
−−=
∑∑
−==
+
0
(2)
where θ
m
is a given threshold evaluated adaptively to meet a given optimization
criterion, as is the minimization of the energy of the unbiased firing rate. The double
integration (summation in j) accounts for the accumulative integration of the
membrane action potential in A, and for the CF frequency sweeping (summation in i).
The results show that the activity of the first formant is almost symbolic (indeed
this formant is mostly associated with the voicing/unvoicing intervals, which are not
noticeable in this case as there are not unvoicing intervals except at the beginning and
ending of the sentence. The dynamic activity of the second formant is determinant to
establish the presence of vowel-like intervals, although to conclude specifically on
this subject this information has to be contrasted against formant dynamics by Mutual
Exclusion as will be shown in the sequel.
Positive and Negative Slope-tracking Units. The Positive and Negative Slope
Formant Trackers detecting ascending or descending formants by masks in 0
correspond to the cell columns to the uppermost right-hand side, labelled as +fM
1-K
and -fM
1-K
, where k is the respective order of the frequency bin bands being searched,
20
and the sign + or – refers to the positive or negative sense of the slope. In the specific
case shown in simulations throughout the paper the dimensions of the +fM and -fM
units are 8x8, which means that the connectivity in frequency extends from +4 to -4
neighbour neurons, whilst the delay lines in the pauser units responsible for the delay
go from 0 to 16 msec, as 2 msec is the delay unit (corresponding roughly to a
maximum firing rate of 500 spikes/sec., just out of the limits of real neurons). 0 shows
a possible morphology of the delay and detecting units.
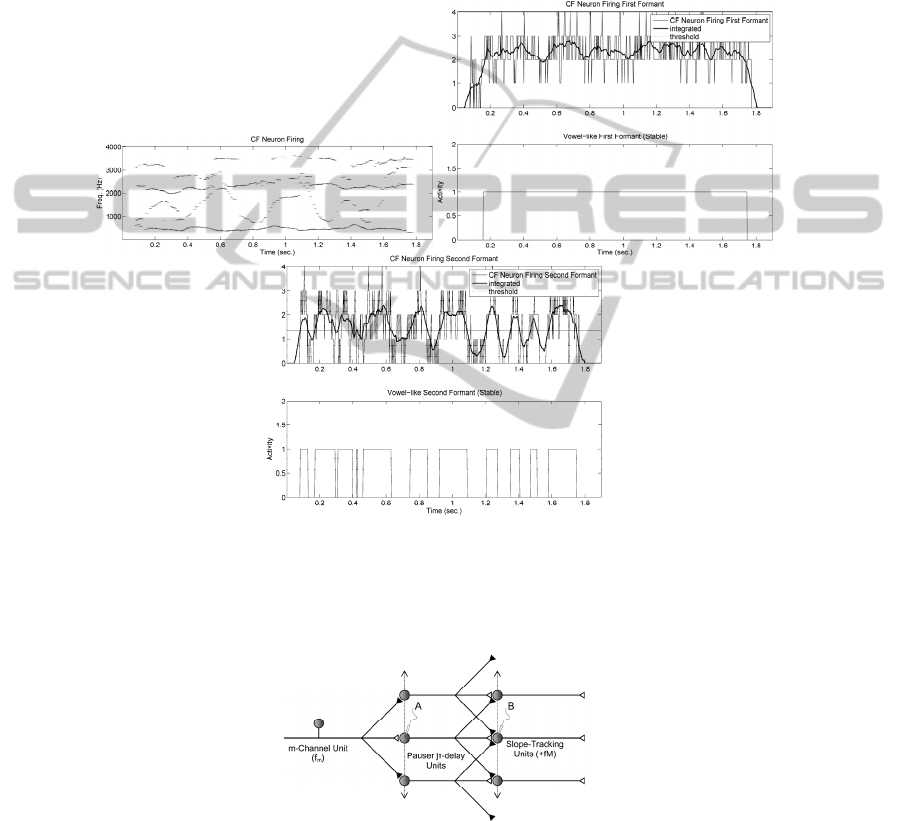
Fig. 6. CF Formant profiling by Static (CF) units. The profiling is coded in the number of
accumulated firings, which is weak for dynamic fragments (slopes) and intensifies for
fragments where the formants remain more stable. It may be seen that the first formant is
almost stable throughout the whole sentence, whereas the second formant accumulates most of
the dynamics.
Fig. 7. Positive and Negative Slope Tracking Units. Pauser Units (A) are activated by m-
Channel Units. Pausers respond with a delay j time delay intervals (τ) different for each unit.
These activate spatial summation units (B). The positive or negative slope-tracking capability
of the unit is based on delay and channel configurations.
21
The resulting activity as detected per each of the 512 channel units is given in 0. It
may be seen that the strong activity compression produced from lateral inhibition
results in a few units firing simultaneously at a given time instant (typically up to 5
units fire at a time).
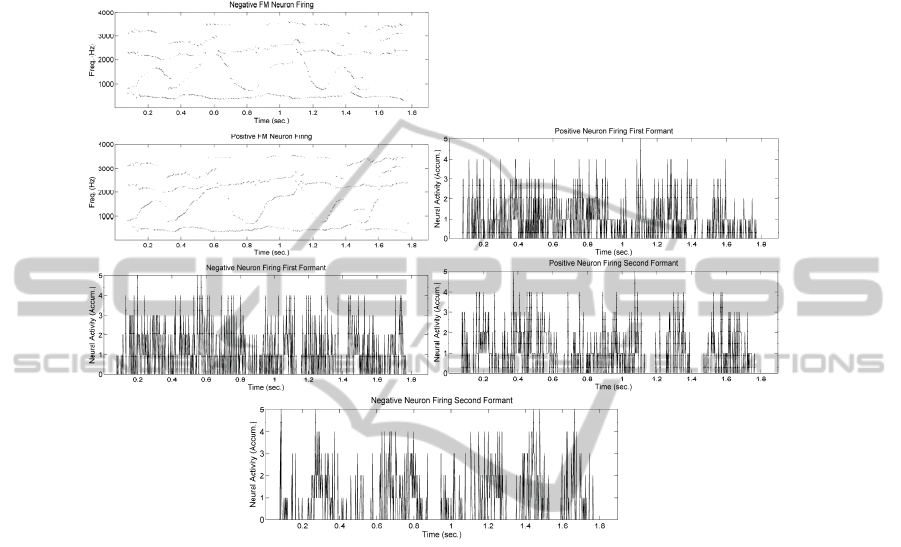
Fig. 8. Positive and Negative Slope Tracking Units. Top: Activity of +fM1-512 Units detecting
upwards formant trajectories. Top-1: Activity of -fM1-512 Units for downwards formant
trajectories. Top-2 to Bottom: Simultaneous firing rates (accumulated) at the outputs of
neighbour channels. It may be seen that spurious undesired firing events happen unavoidably
due to the noisy nature of the natural neural processing.
In the general outcome, it may be said that the units detect the main episodes of
formant ascent and descent with enough accuracy, although a certain amount of noisy
artefacts may be present due to the glittering nature of formant detection in itself.
Nevertheless these problems can be solved easily by massive integration (averaging)
and threshold, as will be seen in the sequel, ambiguities being resolved by Mutual
Exclusion, which is a very efficient natural process related also with Lateral
Inhibition.
Positive and Negative Slope Detection Units (Mutual Exclusion). The structure and
operation of positive and negative formant slope detectors as the ones summarized in
the middle level of 0 (Dynamic Tracking Units) will be discussed here and some
results shown.
22

Fig. 9. Structure of +fM300-700 and -fM300-700 Units coding the activity of the first formant
f1. A similar structure may be hypothesized as well for the second formant (+fM700-2300 and -
fM700-2300). Dark synapses mean inhibition, white ones stand for excitation. The patterns
detected at each of the spots (A, B, C, D) is given in 0.
Formant theory of speech perception is mainly based on psychophysical grounds.
Its plausibility comes from the facts that vowel structures play the role of combined
frequency robust primitive communication codes [3]. Therefore resources to
distinguish vowel from non-vowel pitched sounds must be available at the level of
auditory interpretation centres located in the Auditory Cortex. As the possibilities are
both for ascending or descending first and second formants, at least four different
types of formant slope tracking units should be hypothesized. The real existence and
the number of these structures present in the human auditory cortex remains as a
question put forth to neurophysiologists [14]. In 0 the structure of two of such units
interlocked for mutual exclusion is depicted. Conceptually formant ascent and descent
are mutually excluding, therefore mutual exclusion mechanisms should be
implemented through lateral inhibition. This is provided by the inter-locking
inhibitory synapses running from each axon’s output (B and D) to the bodies of the
counterpart unit (~D to A and ~B to C). In the simulations it is assumed that the
stronger output inhibits the weaker. In this way inconsistencies are removed from the
resulting firing activity shown in the templates of 0 (top to bottom).The top part of 0
shows the activity present at the input of the First-Formant Positive-Slope Tracking
Unit as provided by 52 synaptic connections coming out from the Positive-Slope
Tracking Units in the band 300-700 Hz, which corresponds to the band of frequencies
where the average first formant can be found. It may be seen that barely two or three
of these synapses may be firing at a time with a maximum of 5. The unit is based in
the Mculloch-Pitts paradigm in 0, producing the output line in bold. When its value
jumps over the threshold (ƒ) the output (B) is activated high. The correspondence
between (A) jumping over the threshold and the activation of (B) is not straight
23
forward, as the activation (C) of the First-Formant Negative-Slope Tracking Unit has
to be taken also into account, because it will be trying to inhibit the Positive-Slope
Tracking Unit at the same time. As a result, both (C) and (D) outputs will mark
intervals where either one or the other output will be active, or both of them will
remain inactive (when the formant remains stable, as in certain vowels). A similar
structure activated with synapses in the band 700-2300 Hz must be built for the
detection of second formant dynamics (not shown). The output will only be activated
(fired) when the accumulated stimuli (integrated with a certain forgetting factor) jump
over the threshold (signalled by a horizontal line). Similar comments are pertinent to
the remnant templates in the figure from top to bottom.
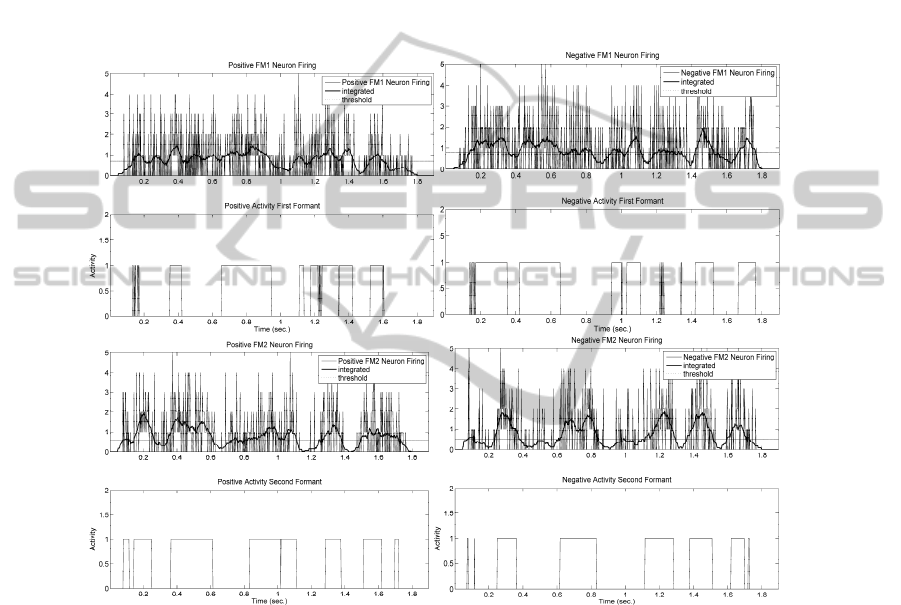
Fig. 10. Top: Firing activity accumulated at the input (A) of the First-Formant Uphill Unit (thin
spiky pattern). Integration of the firing activity (B) at the input (bold line). The threshold is
given as a reference. Top -1: Activity of the First Formant Uphill Integration Unit +fM1
showing the time intervals where the first formant ascends. Top-2 and Top-3: Similar results
for the First Formant Downhill Integration Unit -fM1. Bottom+3 and Bottom+2: Idem for the
Second Formant Uphill Integration Unit +fM2. Bottom+1 and Bottom: Idem for the Second
Formant Downhill Integration Unit -fM2.
Application to Neuromorphic Phonetic Labelling. An example on how specifically
Speech Processing may benefit from Neuromorphic Computing will be given in the
present section. Phonetic Labelling is a technique consisting in highlighting or
spotting specific segments of speech accordingly with some property, as the presence
of voicing, nasality, or spotting vowels, specific phonemes and even words. It is very
24
useful for certain applications as speech annotation, audio and video diarization, or
forensic studies, among others. In Phonetic Labelling features as static or dynamic
formant positions are used as referencing marks for spotting.
The specific example studied as a working case in the present paper was selected for
the spotting of dynamic consonants and approximants as [j, ω], which have been set
as targets within the speech frame used. The complete outcome to the LPC
spectrogram in 0 (input) reproduced in the top part of 0 is given as well as the four
outputs labelling the first and second formant ascents and descents (middle and
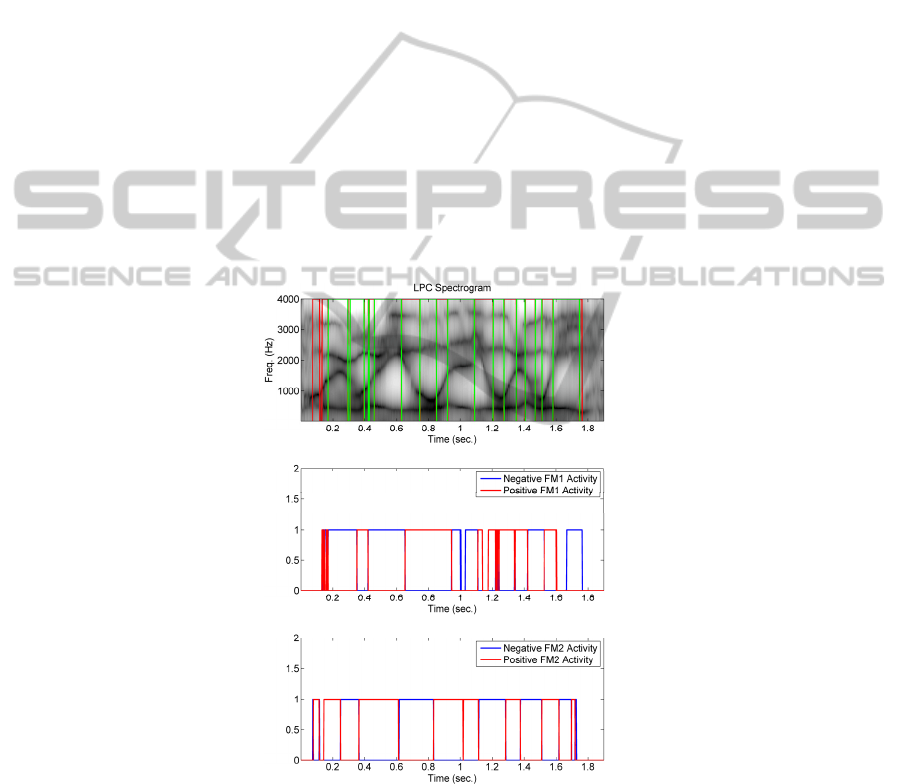
bottom templates). The red and green lines mark the boundaries between the dynamic
and static fragments of speech. For example, vowel-like fragments appear in the
intervals 0.18-0.30, 0.45-0.62, 0.75-0.84, 0.92-1.10, 1.20-1.26, 1.35-1.40, 1.45-1.48
and 1.58-1.75 (all in sec.). It may be seen as well that the first and second negative
and positive slope tracking outputs (in blue and in red) overlap almost perfectly as
complementary signals (when one is high its complementary is down, and viceversa).
For instance, a situation where FM1=’ascend’ and FM2=’descend’ as is the case in
voiced phonemes / ĵ/, and /ζ/ would be signalled by NFM1=’0’, PFM1=’1’,
NFM2=’1’, PFM2=’0’. Specifically, for the speech frame being labelled, the presence
of the phoneme [ω
ε
] is spotted by the combination PFM1=’1’ and PFM2=’1’. The
reader may check that this is precisely the number of times the phonetic pattern
targeted appears in the reference speech frame.
Fig. 11. Top: Formant spectrogram of the sentence under study with the resulting vowel-
consonant segmentation superimposed. Middle: Activity at the output of LIFP Units in the band
of the second formant. Bottom: Output of the Second Formant Integration Unit +fM2
reproducing the positive slope intervals in the second formant.
25

5 Discussion and Conclusions
Through the present paper it has been shown that formant-based speech processing
may be carried out by well-known bio-inspired computing units. Special emphasis has
been placed in the description of the biophysical mechanisms which are credited for
being responsible of formant dynamics detection, as related to the perception of
vowel-like (static or quasi static) and consonant-like sounds (strongly dynamic). A
special effort has been devoted to the definition of a plausible neuromorphic or bio-
inspired architecture composed of multiple moduli of a general purpose computing
unit. The use of such units in vowel and consonantal formant dynamics
characterization as positive and negative frequency tracking and grouping has also
been presented. The structures studied correspond roughly to the processing centres in
the Olivar Nucleus and the Inferior Colliculus. The systemic bottom-up building of
layered structures reproducing dynamic feature detection related to plausible neuronal
circuits in the Auditory Cortex has also been introduced. Results from simulations
explaining the behaviour of these layered structures have been presented as well,
confirming that robust formant trackers built from simple Hebbian units may carry
out important tasks in Speech Processing eventually related with the perception of
dynamic consonants. The utility of this methodology is to be found in the automatic
phonetic labelling of the speech trace, as shown in this study, as well as in typical
tasks related with Cognitive Audio Processing [13].
Acknowledgements
This work has been funded by grants TIC2003-08756, TEC2006-12887-C02-01/02
and TEC2009-14123-C04-03 from Plan Nacional de I+D+i, Ministry of Science and
Technology, by grant CCG06-UPM/TIC-0028 from CAM/UPM, and by project
HESPERIA (http.//www.proyecto-hesperia.org) from the Programme CENIT, Centro
para el Desarrollo Tecnológico Industrial, Ministry of Industry, Spain.
References
1. Allen, J. B., 2008. Nonlinear Cochlear Signal Processing and Masking in Speech
Perception. In Springer Handbook of Speech Processing (Chapter 3), Eds.: J. Benesty, M.
M. Sondhi and Y. Huang, Springer Verlag, pp. 27-60.
2. IPA: http://www.arts.gla.ac.uk/IPA/ipachart.html
3. Geissler, D. B and Ehret, G., 2002. Time-critical integration of formants for perception of
communication calls in mice. Proc. of the Nat. Ac. of Sc. 99-13 pp. 9021-9025.
4. Gómez, P., Ferrández, J. M., Rodellar, V., Fernández, R., 2009a. Time-frequency
Representations in Speech Perception, Neurocomputing 72 820-830.
Gómez, P., Ferrández, J. M., Rodellar, V., Álvarez, A., Mazaira, L. M., Martínez, R.,
2009b. Detection of Speech Dynamics by Neuromorphic Units. Lecture Notes on Computer
Science 5602, Springer Verlag pp. 67-78.
26

5. Gómez, P., Ferrández, J. M., Rodellar, V., Mazaira, L. M. and Muñoz, C., 2010. Modeling
Short-Time Parsing of Speech Features in Neocortical Structures. Lecture Notes in
Artificial Intelligence, 6098, Springer Verlag, pp. 159-168.
6. Greenberg, S. and Ainsworth, W. H., 2006. Auditory Processing of Speech. In Greenberg,
S. and Ainsworth, W. H., Listening to Speech: An Auditory Perspective. Lawrence
Erbaum
Associates, pp. 3-17.
7. Greenberg, S., and Ainsworth, W. H., 2004. Speech Processing in the Auditory System: An
Overview. In W. A. S. Greenberg, Speech Processing in the Auditory System. Springer,
New York, pp. 1-62.
8. Hebb, D. O., 1949. The Organization of Behavior (Wiley Interscience New York 1949 -
reprinted 2002).
9. H. Hermansky, “Should recognizers have ears?” Speech Communication, vol. 25, pp. 3–27,
Aug. 1998.
10. Jähne, B., (2005). Digital Image Processing. Springer, Berlin.
11. Mountcastle, V. B., 1997. The columnar organization of the neocortex. Brain 120 pp. 701-
722.
12. Munkong, R. and Juang, B. H., 2008. Auditory Perception and Cognition. IEEE Signal
Proc. Magazine 98 pp. 98-117.
13. Rauschecker, J. P., & Scott, S. K., 2009. Maps and streams in the auditory cortex:
nonhuman primates illuminate human speech processing. Nature Neuroscience 12-6 pp.
718-724.
14. Suga, N., 2006. Basic Acoustic Patterns and Neural Mechanisms Shared by Humans and
Animals for Auditory Perception. In Greenberg, S. and Ainsworth, W. H., Listening to
Speech: An Auditory Perspective. Lawrence Erbaum Associates pp. 159-181.
15. Sussman, H. M., McCaffrey, H. A., and Mathews, S. A., 1991. An Investigation of Locus
Equations as a Source of Relational Invariance for Stop Place Categorization, Journal of the
Acoustical Society of America 90 pp. 1309-1325.
27
