
EXPLOITING VISUAL OBSERVATIONS FOR EFFICIENT
WORKFLOW SCHEDULING IN PRODUCTION
ENVIRONMENTS
Anastasios Doulamis
Technical University of Crete, D5 building, University Campus, Chania, Greece
Keywords: Visually observed industrial operations, Workflow scheduling, Tracking, Incremental spectral clustering.
Abstract: This paper proposes a new production scheduling algorithm that exploits (a) visual observations of
industrial operations to estimate the actual completion times for tasks and (b) incremental graph
partitioning-based clustering algorithms. The latter are implemented through an incremental implementation
of the spectral clustering. Computer vision tools are applied to identify industrial operations via visual
observations.
1 INTRODUCTION
Production scheduling/planning is probably one of
the most critical managerial tasks within an industry
with many benefits for the production. In particular,
it (i) can determine whether delivery promises can
be met and identify time periods for preventive
maintenance, (ii) gives personnel an explicit
statement of what should be done so that supervisors
and managers can measure their performance, (iii)
minimizes the average flow time through the system,
(iv) minimizes setup times and (v) maximizes
machine and/or worker utilization.
The main difficulty of production
scheduling/planning stems from the fact that many
real-world manufactories are complex in nature and
it is a real challenge to find an efficient scheduling
method that satisfies the production requirements as
well as utilizes the resources efficiently. To
overcome these difficulties, simulation approaches
have been proposed to “model” complex real-world
systems. Simulations develop models for generating
detailed plans to control the real-world industrial
operations. However, usually the real world
(severely) differs than the idealized computer
models so that scheduling/planning derived through
simulation (significantly) deviates from the actual
conditions.
One possible way to monitor current
processes/operations is through the use of Radio
Frequency Identification -RFID sensors (Gonzalez
Fernandez et. al, 2010) (Ilic et al., 2010). These,
however, are efficient only for specific industrial
environments, while their reliability under harsh
industrial conditions is questionable. Another
possibility is the use of cameras. Nevertheless,
cameras that do not support machine learning
technologies and computer vision methods actually
result in a manual survey of the industrial operations
fact that eliminates any possibility for a dynamic
(non-rigid) industrial planning. It is impossible for
the survey employees to continually concentrate on
monitors that display different activities in different
areas. Additionally, there is a subjective
interpretation as far as humans’ behaviours are
concerned, let alone additional cost and exploitation
of humans’ resources.
The recent advances in computer vision and
machine learning society have endowed the cameras
with smart capabilities. They can detect salient
objects, track moving entities, interpret important
events taking place in the industry and finally adapt
their performance to environmental changes. Thus,
they can endow modern factories with new cognition
capabilities transforming them to “smart industries”.
Most of the current approaches for industrial
scheduling exploit concepts derived from
computational processors (Shaik et. al. 2007),
(Drotos et; al., 2009). The incorporation of computer
vision tools able to understand the actual (real-time)
execution of industrial processes is rather limited. A
survey of industrial vision systems has been reported
531
Doulamis A..
EXPLOITING VISUAL OBSERVATIONS FOR EFFICIENT WORKFLOW SCHEDULING IN PRODUCTION ENVIRONMENTS.
DOI: 10.5220/0003305905310537
In Proceedings of the 3rd International Conference on Agents and Artificial Intelligence (ICAART-2011), pages 531-537
ISBN: 978-989-8425-40-9
Copyright
c
2011 SCITEPRESS (Science and Technology Publications, Lda.)

in (Malamas et. al., 2003), while extraction of salient
features for defining and detecting industrial events
has been discussed in (Motai, 2005). Assistance
towards an efficient visual supervision of an
industrial plant can be achieved by exploiting
distributed cameras as well as communication issues
among them (Karakaya and Hairong Qi, 2009).
Surveying industrial tasks and workflows using web
services has been presented in (Idoughi et. 2010).
The main objective of that work is to handle
complex and concurrently executed services on
large-scale industries. The adoption of Service
Oriented Architectures (SOA) and the use of web
services enable a flexible and transparent interaction
between the field devices and human operators
(Doulamis and Matsatsinis, 2011).
In this paper, we propose a new production
scheduling algorithm which is related on defining
events, actions and workflows on visual surveyed
areas of an industry. The algorithm is based on a
new dynamic spectral clustering methodology. This
means that instead of using the conventional spectral
clustering algorithm (Bach and Jordan, 2004), we
adopt a modified version of it so that dynamic
arrivals of tasks’ workflows and dynamic deviations
of the actual to the estimated completion times are
allowed (Huazhong Ning et. al, 2010).
In particular, the proposed algorithm initially
statically schedules the submitted industrial
workflows by constructing a graph whose nodes
refer to the industrial operations while the edges to
the non-overlapping degree among the tasks. The
main, however contribution of the presented paper is
the fact that it incorporates computer vision and
pattern recognition algorithms in the industrial
process so as to approximate as much as possible the
actual completion times of the already executed
tasks, or in other words, to estimate possible
deviations between the actual and the requested
completion times. To accomplish this,we introduce
visual trackers able to self-correct their performance
with respect to environmental changes (Section 4),
and part-to-whole curve matching techniques
(Section 5), so as to estimate the delays or
accelerations in the actual task execution.
2 OVERVIEW OF PROPOSED
ARCHITECTURE
Figure 1 shows an overview of the proposed
industrial scheduling algorithm which exploits
events analysis and detection tasks. Initially, we
consider that the requested start and finish times for
a set of industrial operations are available to the
architecture. Based on this static information, we
calculate the overlapping degree among the
submitted tasks (or equivalently the non-overlapping
degree). Then, we construct a graph and we solve
the static scheduling problem as a graph partitioning
problem considering the spectral clustering
algorithm (Bach and Jordan, 2004). At this point the
process resembles our earlier work of (Delias et. al,
2011) in which the spectral clustering algorithm has
been adopted to allocate complex business
workflows into the available resources. However,
this results in a static scheduling.
Figure 1: Overview of the methodology.
In this paper, we improve the static workflows
scheduling by incorporating computer vision
algorithms in the process. In particular, a set of
cameras’ sensors observe the trace of an industrial
task as it is executed by the workers. This
identification is carried out by the use of a tracking
algorithm, which “observes” the industrial processes
by tracing the trajectory that the persons follow. For
tracking, a new self-initialized tracking algorithm is
proposed to trace the trajectory of the moving
objects in a scene. The algorithm automatically
selects new confident data from the current image
frame whenever the tracker performance is not
adequate so as to re-initialize its performance, and
thus to improve the object’s tracing in harsh
industrial environments. Towards this direction, we
propose a modification of the data selector algorithm
of (A. Doulamis, 2010) so as to be robust to
industrial applications by using an adaptive non-
linear classifier (Section 4). A modification of (A.
Doulamis, 2010) has been also proposed in
(Doulamis and Matsatsinis, 2011) to fit the
particularities of an industrial environment.
However in (Doulamis and Matsatsinis, 2011),
linear adaptive methodologies are proposed in
contrast to the current work.
Then, we apply a curve matching algorithm to
predict the deviations of the estimated execution
durations based on the visual observations. Part-to-
whole curve matching methods are implemented so
as to estimate the current completion time for
executing a job based on the current on-going
process. Instead of the part-to-whole approach
adopted in the Service Oriented Architecture of
ICAART 2011 - 3rd International Conference on Agents and Artificial Intelligence
532

(Doulamis and Matsatsinis, 2011), in this paper, a
guided search algorithm is adopted to improve the
minimization of the optimal criterion so that better
matched points are firstly identified.
Apart from the computer vision and pattern
analysis techniques, a new dynamic scheduling
algorithm is applied to take into account the
dynamic modifications of the start and finish times
for the executed tasks. This is achieved in this paper
by incrementally refining the static scheduling
results (Huazhong Ning et. al, 2010). Instead, the
“from scratch” application of a static spectral
scheduling algorithm would be computationally very
expensive, making its use preventable. We also
extend the work of (Doulamis and Matsatsinis,
2011) by proposing an optimized method for data
scheduling in terms of dynamicity and optimality.
3 SPECTRAL CLUSTERING
FOR SCHEDULING
INDUSTRIAL WORKFLOWS
Assuming that we have calculated the requested start
(S
i
) and finish times (F
i
) for the ith workflow W
i
(let
N be the total number of operations contained in all
the workflows), we can model their relations as an
indicator of their overlapping, say
ji
a
,
. Instead of
(Delias et. al, 2011) in which the
ji
a
,
is defined as a
binary measure, in this paper we adopt a continuous
modification of the overlapping measure to make it
more robust to the dynamic changes. This means
that
⎩
⎨
⎧
=
otherwise
overlap and operations if0
,
ϕ
ji
a
ji
(1)
We introduce two objective optimization criteria,
which can measure the plan’s efficiency with respect
to the overall goal. The first one is associated with
the violation of the deadlines. The corresponding
optimization criterion is mathematically formulated
as
∑
∑
∈∈
∉∈
=
WjOi
ji
OjOi
ji
m
m
mm
a
a
V
,
,
,
,
(2)
where m indicates that the optimization metric refers
to the m
th
resource,
m
O is the set of the operations
that is planned for allocation to the m
th
resource, and
W is the set of all the operations that require to be
executed. Additionally,
m
V is a marginal
optimization criterion. The overall criterion is
calculated by the summation of these marginal
criteria over all the available resources M, and as
stated before, an efficient scheduling plan should
keep it at a minimum value.
The second optimization criterion concerns the
thriftiness of the plan, namely how resources should
be utilized so as to prevent wasteful schedules. This
criterion can be mathematically expressed as
∑
∑
∈∈
∈∈
=
WjOi
ij
OjOi
ij
m
m
mm
a
a
U
,
,
(3)
Once again
m
U is a marginal optimization criterion
(with respect to the m
th
resource). The overall
criterion is calculated similarly with the deadlines’
violation criterion, i.e., as the sum of all the
m
U
over all the M available resources.
As it is shown in a previous work (Delias et. al,
2011), it is possible to jointly optimize the above
mentioned criteria through the use of the Ky-fan
theorem (Ky Fan, 1951).
Actually, the solution matrix S needs an
additional step to provide a schedule, as it contains
real values while the assignment method requires for
values which are either 1 /0. In this paper, we
initially apply the above mentioned methodology to
get a first approximate estimate for the production
schedules, that is, a schedule based on the requested
start and finish times.
4 SELF CORRECTED TRACKING
FOR INDUSTRIAL PROCESSES
In this paper, we modify the self initialized tracker
of (A. Doulamis, 2010) so as to be appropriate for
industrial applications. More specifically, the
architecture of (A. Doulamis, 2010) is only adequate
for scenes that contain moving objects. This is not,
however, an industrial case since workers can
remain almost still for a relatively long time interval
in order to fulfil some of their activities. In addition,
the background complexity of an industrial
environment imposes significant deviations from a
good performance.
To address this difficulty, in this paper we
modify both the data selector module of (A.
Doulamis, 2010) and the object labelling adapter. In
particular, a non-linear classifier is proposed as an
efficient background model, which in the sequel is
EXPLOITING VISUAL OBSERVATIONS FOR EFFICIENT WORKFLOW SCHEDULING IN PRODUCTION
ENVIRONMENTS
533

used as a more suitable data selector. The classifier
is based on a neural network structure. Neural
network-based background modelling has been also
proposed in (Culibrk et. al, 2007). The weights,
however, of the classifier do not remain static but
they are modified during the video streaming so that
the model can be adapted to the dynamics of the
current conditions. This is achieved in our algorithm
via the object labelling adapter. In (Culibrk et. al.
2007), the observed statistics are exploited to
dynamically modify the neural network weights,
while in this paper an optimal network retraining
strategy is adopted as in (Doulamis A. D et. al,
2000).
More specifically, initially the Gaussian
Mixtures are used to give approximate estimates of
the background content. These mixtures are
automatically updated from frame to frame to
capture small and/or periodic modifications of the
visual content on the background. As we have stated
above, the neural network classifier is actually used
for separating the foreground region from the
background based on a non-linear mapping of the
Gaussian mixtures information with respect to the
specific background content. However, since the
background is modified from frame to frame the
weights of the neural network classifier cannot be
considered constant. Instead, they should be
updated. The generalized neural network retraining
algorithm of (Doulamis A.D et. al, 2000) is adopted
in this paper for an optimal updating of the network
parameters. With respect to our knowledge, this is
the first time that a non-linear and dynamic classifier
with optimal retraining strategies will be applied for
background content modelling. In addition, the
exploitation of the self initialized architecture of (A.
Doulamis, 2010) for the purpose of an industrial
plant constitutes another contribution of the
proposed work.
5 ESTIMATING THE ACTUAL
WORKFLOWS COMPLETION
TIMES
In this paper, we modify the technique of (Cui et. al,
2009) by applying guided search in order to find the
most appropriate correspondence points among the
two curves. This is due to the fact that the main
challenging issues of our partial to whole match
approach is that we do not know the last point of the
partial curve but only the first (start) one. This is due
to the fact that we do not know the current execution
time.
In particular, we initially model both curves
using the integral of the curvature measures, i.e., the
integral of the norm of the second derivative,
∫
′′
=
2
1
),():(
21
s
s
dsyxsssC
(4)
where
),( yxs
′
′
is the second derivative of a curve,
that is either of t or of f. In (Cui et. al, 2009), it is
proved that
):(
21
ssC is invariant under a similarity
transform. Thus, this measure can be used to
represent the curve complexity. However, it is still
problematic to match parts of two curves, sine the
starting value of the integral of (4) can be of any
number.
To solve this problem, we initially consider that
the curvature points, as well as their averaging, are
the most characteristics points of the curve. Then,
we use a cross correlation criterion as a similarity
matching for both curves. In particular, if we have
defined the most appropriate last point of curve f,
then we could take a part of it starting from the first
point to the last one and find its correlation to the
traced curved t. Let us denote as
)(),(
0
fPfP
last
the
first and the last point of curve f and as
)(),(
0
trPtrP
last
the respective first and last point of
curve t. Then, the correlation coefficient can be
considered as a measure for their matching.
22
)]():([*)]():([
)]():([*)]():([
))(),((
tPPtrfPPf
tPPtfPPf
trPfPCorr
lastolasto
lastolasto
lastlast
μμ
μμ
−−
−−
=
=
(5)
In equation (5), ):(
lasto
PPf refers to a part of the f curve
starting from
)(
0
fP and ends to )( fP
last
. Similarly, we
define the
):(
lasto
PPtr
curve. The function )(
⋅
μ
returns the average of each curve. It is worth to note that
Corr function actually depends on the last points of both
curves since the first ones are already available and
known.
Then, the optimal last point of f is found through
the following minimization
{
}
))(),((max:)(
ˆ
trPfPCorrfP
lastlast
SP
last
f
∈
(6)
A genetic algorithm is adopted then to find an
optimized solution to the above mentioned
minimization problem.
ICAART 2011 - 3rd International Conference on Agents and Artificial Intelligence
534
6 UPDATING THE SPECTRAL
CLUSTERING
The proposed scheduling algorithm although very
efficient, is computationally expensive to be used
from scratch in every case that the start or finish
times are modified. There is a need to exploit the
updated information that comes from the visual
tracker and the curve-matching algorithm with a fast
yet reliable way. In this paper the following
approach is proposed: Since the visual tracker and
the curve-matching algorithms detect modifications
in the normal workflow (i.e., modifications of the
start and finish times of the operations), the initial
affinity matrix of operations which indicates the
overlapping among the operations is modified as
well. In fact, only some distinct elements of the
affinity matrix are affected. These changes may
induce alterations to both the degree matrix D and
the eigenvectors matrix E. As it is proved in
(Huazhong et. al, 2010), it is possible to approximate
the increment of the eigenvalues and the
eigenvectors, without needing to re-solve the
generalized eigenvalue problem.
The exact sub-process of the incremental update
is described by the following steps:
(a) Get informed about the modified start and
finish times of operations (via the visual
tracker and the curve matching algorithm),
(b) Update the affinity (overlapping indicators)
matrix according to the new overlapping
conditions,
(c) Iteratively refine matrices E (eigenvectors)
and D (degree). (d) Apply the k-means
algorithm to the updated solution matrix S and
get the new schedule.
7 EXPERIMENTAL RESULTS
Our experiments are carried out on a real-life
industrial environment, the one of Nissan Iberica
Automobile Construction company in Barcelona
Spain. The dataset collected include three full days
video capturing in the industry that describe any
complex activity (www.scovis.eu).
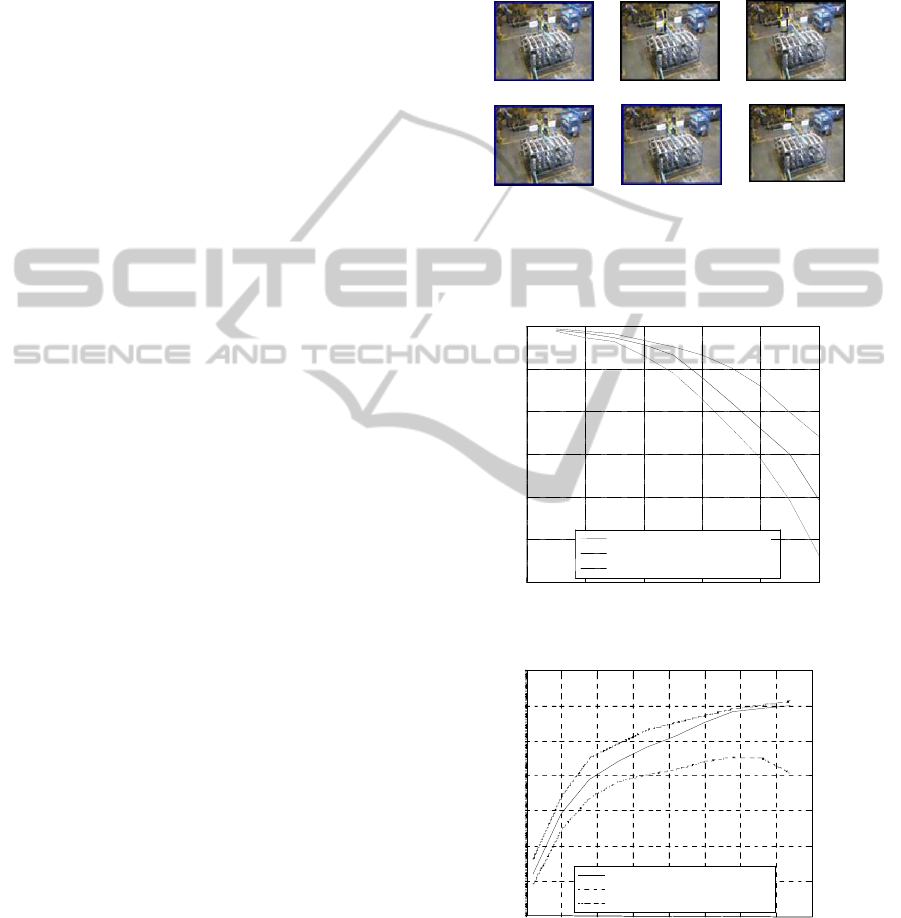
Figure 2 shows the tracking results using the
proposed modified self corrective algorithm. The
boxes have been shown in black colour. Similarly,
Figure 2 compares the tracking performance using
the methodology described in (Doulamis and
Matsatsinis, 2011) (with yellow colours). As we can
observe, a slightly better tracking improvement is
derived in our case than when the algorithm of
(Doulamis and Matsatsinis, 2011) is used. We need
to stress that the original performance of the self
initialized algorithm of (A. Doulamis, 2010) gives
much more worsened results in such complex
industrial cases.
Figure 2: The tracking performance of the proposed
algorithm (black boxes) as being compared with the
results of the (Doulamis and Matsatsinis, 2011) approach
(yellow boxes).
0 0.2 0.4 0.6
0.8
1
0.4
0.5
0.6
0.7
0.8
0.9
1
N
ormalized Number of Industrial Operations (in %)
Percentage in Gain Decrease (in %)
Scheduling Performance vs Number of Industrial Operations
MBF with Prediction Capabilities
MBF with Prediction Capabilities
Incremental Spectral Clustering
(a)
0 0.5 1 1.5 2 2.5 3 3.5 4
0.4
0.5
0.6
0.7
0.8
0.9
1
Standard Deviation by Mean Value (in %)
Percentage in Gain Decrease (in %)
Scheduling Performance vs Standard Deviation of Work flows Duration
MB F with P rediction Capa biliti es
EDF wit h Prediction C apa bilit ies
Incre ment al S pec tr al Cluste ring
(b)
Figure 3: Comparison of scheduling performances.
In the following, we compare the performance of
the proposed incremental spectral clustering
EXPLOITING VISUAL OBSERVATIONS FOR EFFICIENT WORKFLOW SCHEDULING IN PRODUCTION
ENVIRONMENTS
535

algorithm with the heuristic method of Maximum
Benefit First (MBF), proposed in (Doulamis and
Matsatsinis, 2011) and the Earliest Deadline First
(EDF) algorithm. We follow the same setup as in
(Doulamis and Matsatsinis, 2011). In particular, we
divide the total scheduling time horizon into 10
uniform intervals and we randomly generate 100
operations per interval, i.e., we totally create 1000
workflows. At each interval the scheduler is
activated to assign to resources the already
submitted workflows (the 100 newly generated and
the ones that have not been assigned / executed yet).
The start and finish times of the operations are
uniformly distributed within three time intervals
starting from the current one. We set as delivery
deadline per each operation a 20% time extension
beyond its finish time. Furthermore, we consider that
each operation completed before its deadline yield
the economic gain to the industry which also follows
a normal distribution, while each violation of the
operations deadline burdens with a constant
compensation of 20% of the maximum gain among
all workflows. This means that negative cost
(damages) can be derived.
Figure(a) shows the scheduling efficiency
derived by the use of the proposed incremental
spectral clustering algorithm and the MBF method
of (Doulamis and Matsatsinis, 2011) versus the
number of operations. This number has been
normalized with respect to the maximum number of
1000 for clarity purposes. We observe that the
proposed algorithm schedules better the operations
than the method of (Doulamis and Matsatsinis,
2011). We need to recall that this algorithm deviates
from (Huazhong Ning et. al, 2009) in the sense that,
due to the different nature of our problem,
incremental clustering should be followed. To
emulate the effect of the computer vision tools we
assume a delay on the 80% of the already executed
operations which is uniformly distributed between
the requested finish time and a 100% extension of it.
The remaining 20% of the currently running
workflows are left intact.
In these results, we have randomly generated
workflows of Gaussian probability density function
(pdf) which present a standard deviation equal to
their mean value. The effect of the proposed
scheduling scheme versus standard deviation values
is depicted in Figure(b). In this Figure, we have also
presents results obtained apart from the MBF along
with the EDF algorithm as well.
ACKNOWLEDGEMENTS
The author would like to thank SCOVIS, “Self
Configurable Video Supervision” European Union
Project for providing the data sets results and its
support to this work.
REFERENCES
Gonzalez Fernandez, J., Yelmo Garcia, J. C., Martin
Garcia Yo.-S., and de Gracia Santos J., “Transf-ID:
Automatic ID and Data Capture for Rail Freight Asset
Management”, IEEE Internet Computing Mag.
Jan./Feb. 2010.
Ilic, A., Andersen, T., and Michahelles, F., “Increasing
Supply-Chain Visibility with Rule-Based RFID Data
Analysis”, IEEE Internet Computing Jan./Feb. 2010.
Shaik, M. A., Floudas, C. A., Kallrath, J., Pitz, H.-J,
“Production scheduling of a large-scale industrial
continuous plant: Short-term and medium-term
scheduling,” Computer Aided Chemical Engineering,
Vol. 24, pp. 613-618, 2007.
Drotos, M., Erdos, G., Kis, T., “Computing lower and
upper bounds for a large-scale industrial job shop
scheduling problem,” European Journal of
Operational Research, Vol. 197, No,1, pp. 296-306,
August 2009.
Malamas, E. N., Petrakis, E. M., Zervakis, M., Petit, L.,
Legat, J.-D., “A survey on industrial vision systems,
applications and tools,” Image and Vision Computing,
Vol. 21, No. 2, pp. 171-188, 2003.
Motai, Y., “Salient feature extraction of industrial objects
for an automated assembly system,” Computers in
Industry, Vol. 56, Nos. 8-9, pp, 943-957, December,
2005.
Karakaya M. and Hairong Qi, “Target Detection and
Counting using a Progressive Certainty Map in
Distributed Visual Sensor Networks,” 3
rd
ACM/IEEE
International Conference on Distributed Smart
Cameras, ICDSC 2009.
Idoughi, D., Kerkar, M., Kolski, C., “Towards new web
services based supervisory systems in complex
industrial organizations: Basic principles and case
study,” Computers in Industry, Vol. 61, No. 3, pp.
235-249, 2010.
Doulamis A., and N. Matsatsinis, “Visual Understanding
Industrial Workflows under Uncertainty,” submitted to
the Future Generation Computer Systems Journal.
Bach F. R., and Jordan M. I., “Learning spectral
clustering,” In S. Thrun, L. Saul, and B. Schoelkopf
(Eds.), Advances in Neural Information Processing
Systems (NIPS) 16, 2004.
Huazhong Ning, Wei Xu, Yun Chi, Yihong Gong and T.
S. Huang “Incremental spectral clustering by
efficiently updating the eigen-system,” Patter
Recognition, Vol. 43, No. 1, pp.113-127, 2010.
ICAART 2011 - 3rd International Conference on Agents and Artificial Intelligence
536

Delias, P., Doulamis A., Doulamis N., and Matsatsinis N.,
“Optimizing Resource Conflicts in Workflow,” IEEE
Trans. on Knowledge Engineering, accepted for
publication.
Doulamis A., “Dynamic Tracking Re-Adjustment: A
Method for Automatic Tracking Recovery in Complex
Visual Environments,” Multimedia Tools and
Applications, Springer Press, 1380-7501 (Print) 1573-
7721 (Online).
Ky Fan, “Maximum properties and inequalities for the
eigenvalues of completely continuous operators,”
Proceedings of the National Academy of Sciences pp.
760–766, 1951
Culibrk, D., Marques, O., Socek, D., Kalva H., Furht, B.
“Neural Network Approach to Background Modeling
for Video Object Segmentation,” IEEE Trans. on
Neural Networks, Vol. 18, No.6, pp.1614-1627,
Nov.2007.
Doulamis A. D., Doulamis N. D. and Kollias, S. D., “On
Line Retrainable Neural Networks: Improving the
Performance of Neural Network in Image Analysis
problems,” IEEE Trans. on Neural Networks, Vol. 11,
No. 1, pp. 137-155, January 2000.
www.scovis.eu
Cui, M., Femiani, J., Hu, J., Wonka, P., Razdan, A.,
“Curve matching for open 2D curves,” Pattern
Recognition Letters, Vol. 30, pp. 1–10, 2009.
EXPLOITING VISUAL OBSERVATIONS FOR EFFICIENT WORKFLOW SCHEDULING IN PRODUCTION
ENVIRONMENTS
537
