
Breast Masses Classification using a Sparse
Representation
Fabi
´
an Narv
´
aez, Andrea Rueda and Eduardo Romero
BioIngenium Research Group
Universidad Nacional de Colombia, Bogot
´
a, Colombia
Abstract. Breast mass detection and classification in mammograms is consid-
ered a very difficult task in medical image analysis. In this paper, we present a
novel approach for classification of masses in digital mammograms according
with their severity (benign or malign). Unlike other approaches, we do not seg-
ment masses but instead, we attempt to describe entire regions of interest (RoIs)
based on a sparse representation. A set of patches selected by a radiologist in a
RoI are characterized by their projection onto learned dictionaries, constructed
previously from classified regions. Finally, the region class was identified using
a decision rule algorithm. The strategy was assessed in a set of 80 masses with
different shapes extracted from the DDSM database. The classification was com-
pared with a ground truth already provided in the data base, showing an average
accuracy rate of 70%.
1 Introduction
Breast cancer is the most frequent disease in women and is considered as the largest
public health problem in women population [1]. This disease is fully curable if diag-
nosis is achieved early and mammography is the more efficient method for visualizing
abnormalities in the very early stages [17, 4]. However, mammographic interpretation
is really hard and there exist studies showing that between 10% and 25% of breast can-
cer are not detected in mammography [3]. Abnormal lesions that are directly related
to the presence of breast cancer are masses and calcifications. In clinical practices, a
final diagnosis is determined by pathological analysis of abnormal lesions, an invasive
procedure well known as biopsy. In order to reduce innecessary biopsies and interpre-
tation variability between radiologists, the American College of Radiology diffused the
Breast and Imaging Report and Database System (BI-RADS) as a classification stan-
dard to reporting breast lesions, which allows to classify different pathologies as well
as their severity [2]. This standard established a basic classification for masses based on
their shape, margin and density, which usually correspond to low level descriptors, and
the severity level is defined a semantic interpretation of the first two features. In real
clinical scenario, the radiologist identified the severity level of masses by visual fea-
tures analysis, as circumbscribed margin of lesions, which are compact and lobular or
circular shaped, and spiculated margin of lesions, which consist of a central mass with
radiating spicules in some or many directions. Therefore , edge and shape information
of mass defined a severity level (malign or benign lesion).
Narváez F., Rueda A. and Romero E..
Breast Masses Classification using a Sparse Representation.
DOI: 10.5220/0003304300260033
In Proceedings of the 2nd International Workshop on Medical Image Analysis and Description for Diagnosis Systems (MIAD-2011), pages 26-33
ISBN: 978-989-8425-38-6
Copyright
c
2011 SCITEPRESS (Science and Technology Publications, Lda.)

Actually, Computer Aided Detection (CAD) and Diagnosis for mammography has
decreased innecessary biopsy practice and variability effects since the radiologist can
have a support for their diagnosis [16, 18, 15], becoming a well accepted clinical prac-
tice to assist radiologists interpreting mammograms, when they search and identify
micro-calcification clusters [12]. However, the relatively low performance of CAD
schemes in mass detection [7] make them less accepted as mass diagnosis tools. Two
main factors makes breast mass detection in mammograms a very difficult task in med-
ical image analysis. Firstly, there is a large variation in the appearance of both normal
breast tissue and cancerous tissue [6]. Secondly, CAD systems are usually based on au-
tomatic detection and segmentation of abnormal lesions, issue that increases the false
positive rate. As an alternative to overcome these difficulties, interactive CAD systems
have been developed [18]. Given a query lesion, these systems identify other similar
mass lessions in a large database, which are eventually clinically relevant to the actual
one, allowing to provide a suggestion to the specialist in diagnosis tasks. On the other
hand, CBIR-based CAD schemes [16] have the potential to provide radiologist with
visual aid and increase their confidence in accepting CAD-cued results in the decision
making process. In a recent work, we have proposed an interactive CAD system that
provides a BI-RADS mass description of a manually selected region of interest (RoI)
by region-based descriptors [13].
In this paper, a new approach for breast mass classification from a set of regions
of interest (RoIs) is proposed. A set of image patches are extracted from previously
classified RoIs and then characterized using a multi-scale edge analysis to project them
in a feature space, using a sparse representation. This process allows to identify feature
clusters that corresponds to the severity of the masses (malign or benign). Finally, a new
RoI can be classified by projecting some patches in the feature space and analyzing their
relationships with the severity clusters. This strategy was assessed in a set of 80 masses
with different shapes extracted from the DDSM database, where 30 benign and 30 ma-
lign masses were used as the training set and the remaining 20 masses were selected
for testing. The classification was compared with a ground truth already available in the
data base, showing an accuracy rate of 70%.
2 Methodology
The proposed method for classification of breast masses can be roughly divided in two
stages: an offline learning process and an online classification procedure. At the offline
learning process, the main goal is to identify the feature vectors that characterize each
selected class, in this case, malign and benign masses. For doing so, three different
tasks are involved in this process. First, two different sets of RoIs with benign and ma-
lign masses are selected by a radiologist and preprocessed to enhance the mass shape
characteristics. As the class characterization process will be based in a sparse repre-
sentation, the next step in the learning process includes to construct malign and benign
severity dictionaries. Then, an image patch dictionary is constructed for each selected
class by randomly sampling patches from malign and benign RoIs, which are thus char-
acterized with a multi-scale edge analysis. Finally, a new set of relevant patches (that
capture edge and background information) are manually selected at each RoI (Figure
27
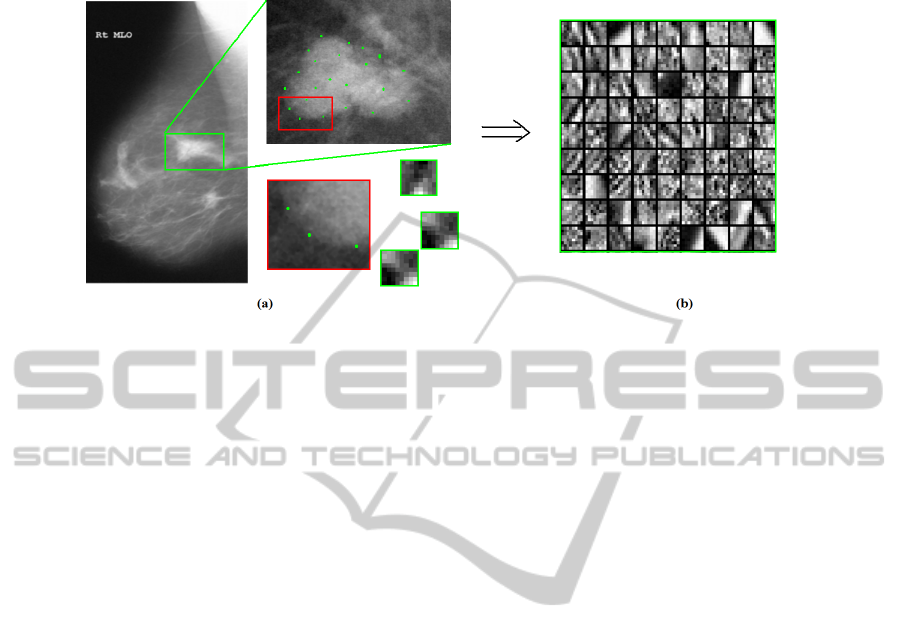
Fig. 1. Point selections by radiologist and sparse representation. (a) illustrates a manual selection
of the patches as points of interest. (b) illustrates the dictionary formed by the selection of patches.
1(a)) and then characterized with a sparse representation, by using its projection onto
the malign and benign severity dictionaries previously constructed (Figure 1(b)).
The online classification procedure takes place when the severity of a test RoI needs
to be defined. The radiologist manually select a set of patches on the test RoI, which
are individually classified using again a sparse representation. Each patch is then pro-
jected onto the malign and benign severity dictionaries, and these projections are then
compared with the characterizations previously obtained for the training patches. This
process, followed by a decision rule, allows to establish the membership of the entire
RoI.
2.1 RoI Pre-processing
Mammography analysis generally must deal with regions difficult to interpret [6], since
they are associated to hard acquisition conditions. In most cases, diagnostic character-
istics, such as mass edges, are small and have low contrast with respect to the surround-
ing breast tissues. To improve the particular region characteristics and to highlight the
grey level intensity information, a preprocessing stage was carried out on each RoI. A
contrast enhancement method is then used based on mean and standard deviation in-
formation of each RoI, allowing to stretch the maximum and minimum gray levels to
the interval [0, 255]. With this procedure shape features are improved, while preserving
edge details. Finally, the whole region is smoothed using a median filter [19].
2.2 Dictionary Construction
The next step is to build dictionaries D
m
and D
b
for malign and benign masses, re-
spectively, as arrays of patches (atoms). Such an approach has been successfully used
for image classification [9]. We selected a set of N RoIs with different mass shapes,
according to their level of severity (malign or benign) as training RoIs. First, a set of
K random patches per RoI were selected and then characterized using a multi-scale
28
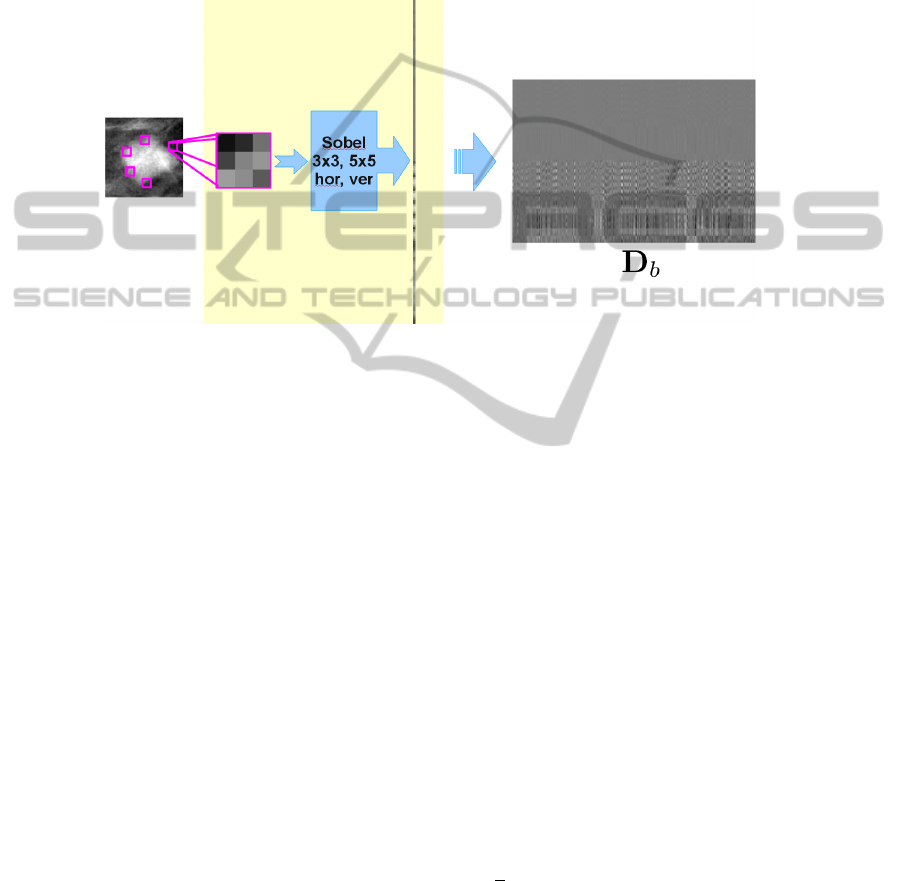
edge analysis. This analysis attempts to describe the tissues present in mammographic
images in terms of edge and background information. We used the 3×3 and 5×5 Sobel
kernels, applied in the horizontal and vertical directions, and concatenated as a single
feature vector. Finally, this vectors are stored as columns of the matrices D
m
and D
b
,
leading to 2 different dictionaries that represent the mass severity, one for malign and
one for benign masses. This process is illustrated for the benign dictionary in Figure 2.
Fig. 2. Construction of a feature dictionary for benign masses.
2.3 Sparse Representation and Characterization
Once the dictionaries are built, the main goal is to identify the set of feature vectors that
characterizes the benign and malign classes. Therefore, a new set of patches selected
from the training images are projected onto the previously constructed dictionaries,
following a sparse representation. The coefficients of the projection will be used to
place each patch on a feature space, where each class will be defined as clouds of
feature points.
Sparse representation techniques allows to identify the constituent parts of a scene
and then, using some of them, the same scene or similar ones may be accurately re-
constructed. These parts, denoted as basis functions or patches (atoms), are usually
arranged in overcomplete dictionaries with a larger number of elements than the ef-
fective dimensionality of the input space, thereby representing a wider range of image
phenomena [14, 11]. Formally, consider a n × m matrix D, where each column is a
possible image in R
n
(atomic images), a dictionary of patches. The projection of an
image x onto the space spanned by D yields a weighting vector α (x = Dα). Further-
more, if α is sparse (with k
0
m nonzeros), this produces a linear combination of k
0
patches with varying weights. To find the adequate α, we need to solve the optimization
problem denoted as G
1
(D, x, λ), which has the form
G
1
(D, x, λ) : min
α
λkαk
1
1
+
1
2
kx − Dαk
2
2
The solution of this problem consist in finding the sparsest vector α that weights x as
29

a linear combination of patches from D, using the norm `
1
as a measure of sparsity.
Different approximation methods to solve this problem have been recently proposed,
detailed descriptions and references can be found in [5]
This process, applied independently to the benign and malign RoI sets, delivers a
set of representation coefficients per class (a set of α vectors obtained by solving the
optimization problem), which allows to characterize the entire class as a set of feature
points. After a new set of k relevant patches are manually selected for capture additional
mass information from the training RoIs, these are characterized using a multi-scale
edge analysis and projected onto the previously constructed dictionaries, following a
sparse representation, in terms of x = Dα, where x is the feature vector of a RoI
patch and α corresponds to the projection coefficients of x. D is replaced by D
m
if the
patch belongs to a malign RoI or by D
b
if the patch comes from a benign RoI. This
coefficients allow to represent each patch in a feature space, thus defining each class
(malign or benign) as clouds of feature points in this space.
2.4 Classification
When a new RoI under analysis arrives, a mass classification strategy that uses the K-
NN rule ( K-Nearest Neighbor ) was implemented. First, a set of patches are manually
selected at the test RoI, and then characterized by proyecting each patch onto the sever-
ity dictionaries D
m
and D
b
. For each patch, two different representation coefficients
are obtained after applying the sparse representation framework (described in Subsec-
tion 2.3), one indicating the projection onto the benign dictionary, α
b
, and the other
one describing the projection onto the malign dictionary, α
m
. Then, the complete set
of coefficients is located as a set of points in the feature space, and each point is classi-
fied as benign or malign using the k-nearest neighbors algorithm. The algorithm used a
weighted Mahalanobis distance (wd) to measure the similarity among the points in the
feature space describing both the benign and malign class.
Finally, the classification of the entire RoI, S
I
, is obtained by applying a decision
rule [13], which uses each classified point, weighted by the distance to the nearest neigh-
bor, to infer the corresponding class for the RoI. The decision rule can be written as
follows
S
I
= arg max
S
i
|S
1
, S
2
|, S
i
=
K
X
i=1
w
s
i
d
, i = 1, 2 (1)
where S
1
and S
2
corresponds to benign and malign classes, respectively, and w
d
=
1/d(x, y) is the point weight, calculated as the Mahalanobis distance between the near-
est neighbor (y) and the actual point (x).
3 Preliminar Results
A small set of 80 regions, extracted from the Digital Database for Screening Mammog-
raphy (DDSM) [8], were used to preliminary evaluate the performance of the proposed
approach. Each RoI was previously classified as benign or malign by a group of breast
radiologists, according the BI-RADS standard. The set of RoIs was splitted into two
30

training sets (30 benign RoIs and 30 malign RoIs) and one testing set (20 RoIs). The
training set was used for constructing the D
m
and D
b
dictionaries, 60 image patches
(size: 3×3 pixels) were randomly sampled from each training RoI, leading to two sever-
ity dictionaries, each one containing 1800 patches. Then, to characterize each class in
the feature space, 900 feature points were used per class, obtained after applying the
sparse representation framework to 30 manually sampled patches per each training RoI.
For the sparse representation, we have used the SparseLab
1
library that provides a set
of solvers for the optimization problem (from this library we have chosen the Basis
Pursuit solver).For classification of each test image, 30 manually sampled patches were
Selected per RoI, and then projected onto the two severity dictionaries, leading to a set
of 60 feature points. The optimal number of k for the k-nearest neighbors algorithm
was estimated by a 10-fold cross validation assessment. Results showed that a minimal
of 11 neighboring feature points are needed for establish optimally the corresponding
severity level.
Classification performance was assessed by computing the accuracy rate from a
confusion matrix of the test images, according to the ground truth provided with the
DDSM mammogram database (defined by experienced radiologists). The accuracy was
defined as:
Acc =
(T P + T N)
(T P + T N + F P + F N)
where T P , TN , F P and F N stand for true positives, true negatives, false positives and
false negatives, respectively. From the 20 test regions, 5 benign RoIs and 9 malign RoIs
were correctly classified, leading to an accuracy rate of 70%. This results are reported
in the Table 1.
Table 1. Confusion Matrix for classification of 20 test RoIs.
Benign Malign
Benign 5 4
Malign 2 9
4 Conclusions
In this paper a new strategy for breast mass classification from mammography images
based on a sparse representation scheme was proposed, implemented and evaluated.
This strategy provided a BI-RADS mass classification of a RoI as benign or malign,
which was supported by a set of diagnosed images that were previously classified by ex-
pert radiologists. Instead of attempting to segment masses, we proposed a mass feature
description, based on its internal structure with no explicit mass boundary detection.
The proposed approach was evaluated on a public image database (DDSM). The
preliminar results have shown that this approach is successfully able to classify the
severity of a RoI using learned dictionaries. Even though the proposed classification
1
http://sparselab.stanford.edu/
31

scheme have been tested with a small dataset, the obtained accuracy of 70% seems to
be promising for automatic classification of breast masses. These preliminary results
have opened up new strategies for the development of computer-aided tools, based on
the sparse representation framework, for mammographic diagnosis. Further work in-
cludes to perform extensive validations with bigger datasets and to include other breast
mass characteristics, like shape, margin and density.
References
1. American Cancer Society: American Cancer Statistics. (2007) Updated: September 2, 2008.
2. American College of Radiology (ACR): Illustrated Breast Imaging Reporting and Data Sys-
tem (BI-RADS). ACR (1998)
3. R. Bird, T. Wallace, and B. Yankaskas, Analysis of cancers missed at screening mammogra-
phy, Radiology 178 (1992), 234–247.
4. S. Buseman, J. Mouchawar, N. Calonge, and T. Byers., Mammography screening matters for
young women with breast carcinoma., Cancer 97 (2003), 352–358.
5. A. M. Bruckstein, D. L. Donoho, and M. Elad., From Sparse Solutions of Systems of Equa-
tions to Sparse Modeling of Signals and Images., SIAM Review 51 (2009), 34–81.
6. H. D. Cheng, X. J. Shi, R. Min, L. M. Hu, X. P. Cai, H. N. Du. Approaches for automated
detection and classification of masses in mammograms., Pattern Recognition 39 (2006), 646–
668
7. D. Gur, J. S Stalder, L. A. Hardesty, B. Zheng, J. H. Sumkin, D. M Chough, B. E. Shindel,
and H. E. Rockette, Computer-aided detection performance in mammographic examination
of masses: assessment., Radiology 233 (2004), 418–423.
8. M. Heath, K. Bowyer, D. Kopans, R. Moore, and W. P. Kegelmeyer, The digital database
for screening mammography, in Proceedings of the Fifth International Workshop on Digital
Mammography, Medical Physics Publishing M.J. Yaffe, ed (2001), 212–218.
9. J. Herredsvela, K. Engan, T. O. Gulsrud, and K. Skretting, Detection of masses in mam-
mograms by watershed segmentation and sparse representation using learned dictionaries.
(paper in pdf-format), Proceedings NORSIG (2005), 35–40.
10. H. Kim and J. Kim, Region-based shape descriptor invariant to rotation, scale and transla-
tion., Signal Proc.: Image Communication 16 (2000), 87–93.
11. S. G. Mallat and Z. Zhang, Matching pursuits with time-frequency dictionaries, IEEE Trans-
actions on signal processing 41 (1993), no. 12, 3397–3415.
12. R. M. Nishikawa, Current status and future directions of computer-aided diagnosis in mam-
mography, Computerized Medical Imaging and Graphics 31 (2007), 224–235.
13. F. Narvaez, G. Diaz, E. Romero, Automatic BI-RADS description for mammographic
masses, IWDM2010 Digital Mammographhy, LNCS 6136 (2010), 673–681.
14. B. A. Olshausen, Principles of image representation in visual cortex, pp. 1603–1615, MIT
Press, 2003.
15. N. A. Rosa, J. C. Felipe, A. J. Traina, R. M Rangayyan, and P. M. Azevedo-Marques, Using
relevance feedback to reduce the semantic gap in content-based image retrieval of mammo-
graphic masses., Conf Proc IEEE Med Biol Soc (2008), 406–409.
16. Y. Tao, S. B. Lo, M. T. Freedman, and J. Xuan, A preliminary study of content-based mam-
mographic masses retrieval, Proc SPIE 6514 (2007), 65141Z.
17. K. Verma and J. Zakos, A computer-aided diagnosis system for digital mammograms based
on fuzzy-neural and feature extraction techniques, IEEE Transactions on Information Tech-
nology in Biomedicine 16 (2002), 219–223.
32

18. B. Zheng, C. Mello-Thoms, X. H. Wang, G. S. Abrams, J. H. Sumkin, D. M. Chough, M. A.
Ganott, A. Lu, and D. Gur, Interactive computer aided diagnosis of breast masses: Computer-
ized selection of visually similar image sets from a reference library, Academical Radiology
14 (2007), 917–927.
19. K. Wongsritong, K. Kittayaruasiriwat, F. Cheevasuvit, K. Dejhan, A. Somboonkaew. Con-
trast enhancement using multipeak histogram equalization with brightness preserving., IEEE
Asia-Pacific Conference on Circuits and Systems Proceedings, (1998), 455–458
33
