
Image Segmentation Guidance using Pet Information
on CT Images in PET/CT Dual Modality
Iman Avazpour
1
, Raja Syamsul Azmir Raja Abdullah
1
Abdul Jalil Nordin
2
and M. Iqbal Saripan
1
1
Department of Computer and Communication, Faculty of Engineering
Universiti Putra Malaysia, 43400 Serdang, Malaysia
2
Faculty of Medicine and Health Sciences, Universiti Putra Malaysia
43400 Serdang, Malaysia
Abstract. Medical image segmentation has always relied on evaluation and
processing of the target image. In this paper we are using PET/CT dual imaging
modality data to start and guide segmentation of regions of interest on CT im-
age. The aim is to improved current semi-automatic techniques to become fully
automatics. The images are acquired for extra pulmonary tuberculosis (EPTB)
to indicate the area of infections. Two segmentation algorithms have been ex-
amined and tested; Seeded Region Growing (SRG) and Watershed using this
technique and their results have been evaluated considering segmentation accu-
racy and time consumption. Overall, adopting the proposed approach for boun-
dary maximum gray value in SRG yields the best results in terms of the accura-
cy, and acceptable time computation.
1 Introduction
Seeded Region Growing (SRG) algorithm is highly dependent on selection of initial
seeds and pixel sorting orders [1-4]. Despite all the efforts to improve growing
process and similarity measures, there are very few improvements on seed selection
procedure. Many applications have considered seeds as separate inputs like the work
by Mehnert and Jackway [3] or tried determining seeds based on previous knowledge
on the nature of application as Gonzalez et al. proposed in an application of detecting
defective welds in an X-Ray image [5]. Hojjatoleslami and Kittler [6], proposed an
automatic seed selection based on a novel thresholding technique for detecting calci-
fications as possible initial seeds. Fan et al. [1, 2] proposed the use of color edge de-
tection to obtain the simplified geometric structures of input image and appointed
centroids of the neighboring labeled color edges as the initial seeds. All these algo-
rithms and procedures process the target image only and do not consider the possibili-
ty of acquiring seeds from other related images.
This paper is an extension to the previously introduced method as guided SRG in
our previous work [7]. In section two, four Growing Criteria (GC) for SRG algorithm
have been tested along watershed transform to examine the usefulness of guided seg-
mentation. The methods used have been described and their results and comparison
Avazpour I., Raja Abdullah R., Nordin A. and Saripan M..
Image Segmentation Guidance using Pet Information on CT Images in PET/CT Dual Modality .
DOI: 10.5220/0003302700750081
In Proceedings of the 2nd International Workshop on Medical Image Analysis and Description for Diagnosis Systems (MIAD-2011), pages 75-81
ISBN: 978-989-8425-38-6
Copyright
c
2011 SCITEPRESS (Science and Technology Publications, Lda.)

have been depicted in section three. Finally, conclusion has been drawn in section
four.
2 Methods
The idea of region based techniques is to segment an image by finding boundaries
between regions based on discontinuities in gray levels [8]. Seeded Region Growing
(SRG) algorithm starts with a set of seeds and from these seeds expands the region by
checking neighboring pixels and regions [4]. Depending on what the nature of prob-
lem is, these seeds may vary in quantity and properties.
Here PET and CT pair images have been registered using cross correlation [8, 9]
and by examining PET image, those pixels with maximum intensity value
representing malignancies were selected as initial seeds. These seeds have been used
as segmentation starting points in SRG and as references to select fractions in wa-
tershed as described in following sections.
2.1 Region Averaging
In region averaging at each step the average pixel value of the region grown so far is
calculated and each neighboring pixel is compared with this average [4]. GC has been
set to region average pixel value ± a threshold value T which is assigned by the user
and controlled to achieve the closest result to desired segmentation.
2.2 Boundary Maximum Gray Value
This approach to defining GC has been introduced by Hojjatoleslami and Kittler [6].
The idea is to add a boundary pixel to the current region which has the highest gray
value among the neighbors of the region. A threshold value T is set to avoid over
growing into homogeneous areas and is controlled to satisfy the below formula:
Bmax ≤ Rmin (1)
Rmax – Bmax ≤ T (2)
Where Bmax is the maximum gray level on the boundary, Rmax and Rmin are the
maximum and minimum gray values of the region. Threshold value T is set to 30 in
order to avoid over growing to homogeneous neighboring pixels.
2.3 Region Maximum Gray Value
Another aspect of GC is to compare candidate pixels with maximum gray value of the
region grown so far [6]. Consider Pmax as the maximum gray value of the region,
candidate pixel P(x,y) will be added to the region if it satisfies:
Pmax – T ≤ P(x,y) ≤ Pmax + T (3)
76

Where T is the preset threshold value used to control over segmentation.
2.4 Sliding Windows
In this method, two local mask Ms (16 by 16 pixels) and Ml (64 by 64 pixels) cen-
tered at the seed point coordinates will be defined as shown in figure 1 and based on
the average pixel value of both masks, it will be decided whether the candidate pixel
should be chosen from higher or lower valued neighboring pixels. The method is fully
described in [7].
Fig. 1. Local mask Ms and Ml centered at the seed point coordinates on CT image.
2.5 Watershed Segmentation
We have acquired watershed segmentation [10] to compare SRG segmentation results
with a method other than region growing. Gradient magnitude of the image has been
calculated using Sobel and linear filtering methods [11]. Since the gradient magnitude
of an image has high pixel values along object edges and low pixel values everywhere
else [5], and CT images usually have clear edges, it results watershed ridge lines to
locate along object edges providing a suitable platform for segmentation.
Images have been completely segmented using watershed transform and those
segmented fractions which contain seed points from PET image have been selected
and merged to create the desired ROI.
3 Results
Fourteen images of patients having EPTB were used and the results of all segmenta-
tion algorithms on them were examined. Figure 2 shows sample results of applying
segmentations algorithms on an image and the manually selected ROI for comparison.
As can be seen, Figure 2(c) which is the segmentation result from SRG using sliding
windows has the best accuracy in terms of covering the lesion. However, it deals with
some over segmentation. Figure 2(e) which is the result of SRG using boundary max-
imum gray value, suffers from under segmentation. The region has not been grown
enough to cover the lesion and only areas around seed points have been selected.
77
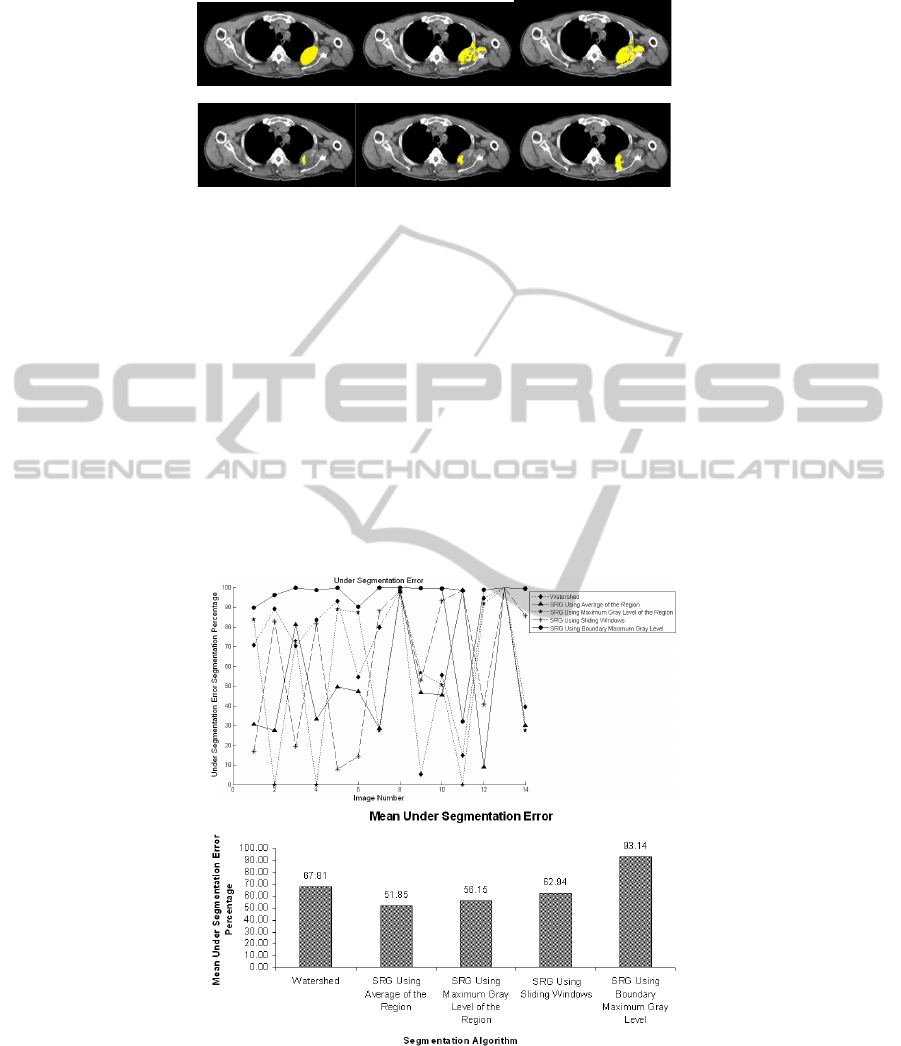
(a) (b) (c)
(d) (e) (f)
Fig. 2. Segmentation results, (a) desired manually selected ROI, (b) SRG using region averag-
ing, (c) SRG using Sliding Windows, (d) SRG using boundary maximum gray value, (e) SRG
using region maximum gray value, (f) Watershed segmentation.
Segmentation accuracy has been tested based on calculation of over and under
segmentation factors. Time complexity of each method has also been taken into ac-
count. Figures 3 and 4 show the under segmentation and over segmentation results of
the algorithms respectively.
As can be seen in Figure 3, among all segmentation methods, SRG using boun-
dary maximum gray value suffers from under segmentation and SRG using region
averaging has the least under segmentation error. This indicates that on the average,
more areas of desired ROI will be covered using this algorithm. On the other hand,
considering over segmentation errors in Figure 4, SRG with boundary maximum gray
value presents the least over segmentation error and SRG using region maximum gray
value suffers badly from over segmentation.
(a)
(b)
Fig. 3. (a) Under segmentation error percentage per image and (b) under segmentation mean
error of all algorithms.
78
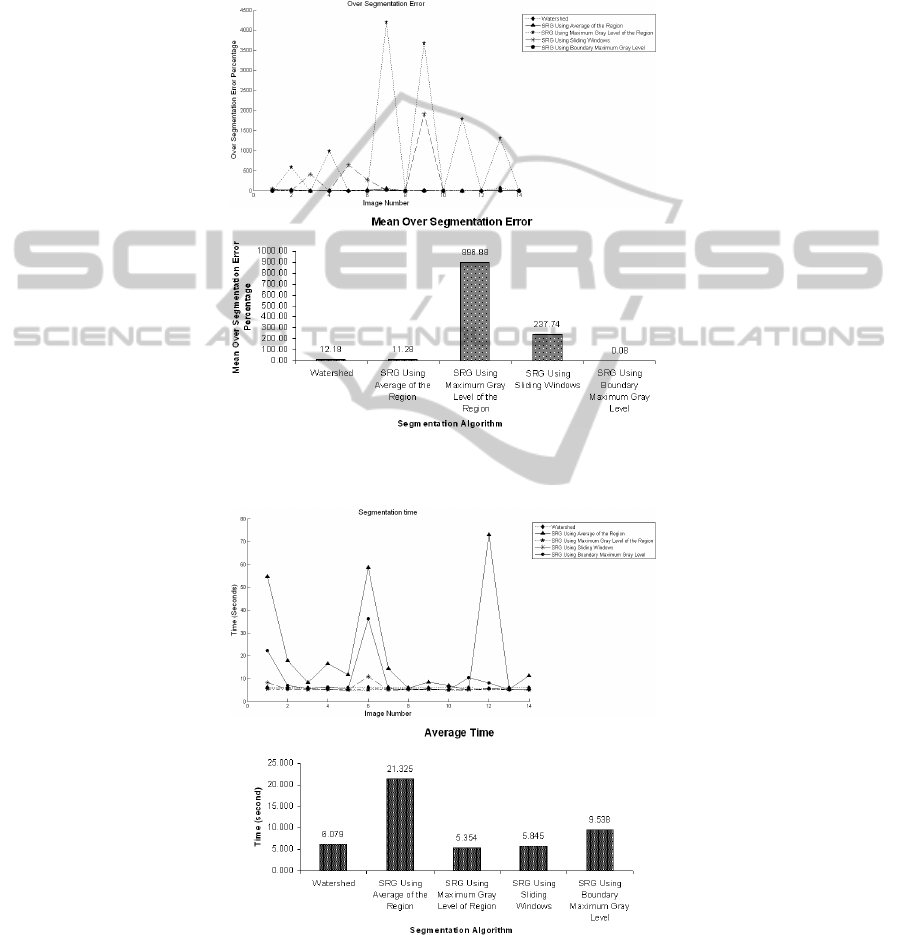
The time complexity of the procedure has been measured and is shown in Figure
5. Since at each step the average of the region grown so far needs to be calculated in
SRG with region averaging, the time complexity of the whole process becomes too
high when the region becomes relatively big. Other algorithms represent almost the
same time complexities.
(a)
(b)
Fig. 4. (a) Over segmentation error percentage per image and (b) over segmentation mean error
for all algorithms.
(a)
(b)
Fig. 5. (a) Time complexity of algorithms per image and (b) their average time.
79

4 Conclusions
Among segmentation algorithms, region growing highly depends on where the grow-
ing process starts and how to control it in order to avoid over growing to homogenous
neighboring areas [12]. There for, we addressed the problem of blind segmentation
and introduced an improved segmentation technique on images of Computed Tomo-
graphy (CT) using images of Positron Emission Tomography (PET). We used the
hotspot data provided by PET image as reference points to start the growing process
in SRG and also as a measure to select segmentation fractions in watershed.
It was taken into consideration to introduce automated segmentation methods
which result in less errors and best performance. The results were compared by defin-
ing three fidelity criteria from segmentation errors to time consumption.
Methods like using boundary maximum gray value and region maximum gray
value had been introduced for certain application and not for segmenting CT images
specifically. We tried to see whether with some modifications and applying data ac-
quired from PET image they can be used for segmenting CT as well. The results sup-
port the fact that their accuracy is not acceptable in contrast with other segmentation
techniques used throughout this paper.
Acknowledgements
The authors would like to thank Department of Nuclear Medicine, Ospedale Santa
Corona, Pietra Ligure, Italy under research collaboration “Manifestation of Extra-
pulmonary Tuberculosis infection on FDG PET CT” in association with Ospedale
Niguarda Ca'Granda, Milano, Italy, for sharing their experience and images with us.
References
1. J. Fan, D. K. Y. Yau, A. K. Elmagarmid and W. G. Aref, "Automatic image segmentation
by integrating color-edge extraction and seeded region growing," IEEE T. Image Process.,
vol. 10; 10, pp. 1454-1466, 2001.
2. J. Fan, G. Zeng, M. Body and M. Hacid, "Seeded region growing: an extensive and com-
parative study," Pattern Recog. Lett., vol. 26, pp. 1139-1156, 6. 2005.
3. A. Mehnert and P. Jackway, "An improved seeded region growing algorithm", Pattern
Recog. Lett., vol. 18, pp. 1065-1071, 10. 1997.
4. R. Adams and L. Bischof, "Seeded region growing," IEEE T. Pattern. Anal., vol. 16, pp.
641-647, 1994.
5. R. C. Gonzalez, R. E. Woods and S. L. Eddins, Digital Image Processing using MATLAB.
Prentice-Hall, Inc. Upper Saddle River, NJ, USA, 2003.
6. S. A. Hojjatoleslami and J. Kittler, "Automatic detection of calcification in mammograms,"
in Image Processing and its Applications, 1995., Fifth International Conference on, 1995,
pp. 139-143.
7. I. Avazpour, M. I. Saripan, A. J. Nordin and R. S. A. Raja Abdullah, "Segmentation of
Extrapulmonary Tuberculosis Infection Using Modified Automatic Seeded Region Grow-
ing," Biol. Proc. Online.
80

8. R. C. Gonzalez and R. E. Woods, Digital Image Processing, 2nd ed.Prentice-Hall, Engle-
wood Cliffs, NJ, 2002, pp. 793.
9. B. Zitová and J. Flusser, "Image registration methods: a survey," Image Vision Comput.,
vol. 21, pp. 977-1000, 10. 2003.
10. S. Beucher and F. Meyer, "The morphological approach to segmentation: The watershed
transformation," in Optical Engineering -NY- Marcel Dekker INC., vol. 34, Anonymous
Marcel Dekker AG, 1992, pp. 433-433.
11. R. O. Duda, P. E. Hart and D. G. Stork, Pattern Classification and Scene Analysis. Wiley
New York, 1973.
12. W. Shu-Yen and W. E. Higgins, "Symmetric region growing," in Image Processing, Pro-
ceedings 2000, International Conference on, 2000, pp. 96-99 vol.2.
81
