
A SIMPLE METHOD FOR MINING AND VISUALIZING
COMPANY RELATIONS BASED ON WEB SOURCES
Maximilien Kintz and Jan Finzen
Fraunhofer IAO, Nobelstraße 12, 70569 Stuttgart, Germany
Keywords: Competitive Intelligence, Graph visualization, Company name normalization.
Abstract: One of the important aspects of market and competitive intelligence is the observation and analysis of a
partner, customer or competitor’s relations with other companies. Using Web-based sources such as press
releases, corporate Web sites or news articles and text mining technologies such as Named Entity
Recognition, it is possible to automatically extract company relations out of Web content and to build
network graphs showing how companies interact. Visualization software that can be integrated in a Web-
based application offers means to explore, search, and analyse these networks and their meaning for a
company. In this paper we demonstrate how to build a powerful company relation mining application with
very little effort by effectively connecting open source toolkits.
1 INTRODUCTION
Competitive intelligence is the activity of
monitoring and studying one’s partners and
competitors, their current activities, products,
relations etc. For a company working in a highly
competitive market, it is of major importance to gain
and maintain a current and complete overview of
competitors and partners as well as their relations
(e.g. are they customers, suppliers, etc.). As multiple
relations between a high number of companies and
organizations can be involved, this data can become
quite complex. An appropriate visual representation
of the data supports the user in analysing and
interpreting the contained information.
We built a prototype (shown in Figure 1) for
company relations visualization demonstrating the
effectiveness of two specific aspects:
• The use of freely available information on the
Internet (we only rely on data available
publicly and free of charge, for example in
press releases, news sections of corporate
websites and specialized news sites) and
• The power of mashing-up free software and
services for Web crawling, scraping,
recognition of company names and graph
visualization.
The remainder of this paper is organized as
follows: In Section 2 we present related work. In
Section 3 we present the methods used to retrieve
data from the Web and prepare it for the
visualization. In Section 4 we describe the user front
end and visualization possibilities. In the concluding
Section 5 we discuss some limitations of the current
implementation and propose ways to further develop
the tool and possible future outcomes.
2 RELATED WORK
The visualization of graph structures and networks is
a widely investigated research topic. Much research
has for example been carried out in the 90s in the
telecommunications sector (Becker et al., 1995),
focusing on the visual representation of telephone
network graphs.
More recently, several methods and
implementations have been proposed for the
visualization of groups of people or social networks,
in generic real-world use cases (Freeman, 2000) as
well as specifically focusing on web-based social
networks (Buzgar and Buraga, 2008 or Matsuo et al,
2007).
The visualization of company relations, however,
remains a research area less investigated. Hu et al
(2009) describe an approach of extracting and
597
Kintz M. and Finzen J..
A SIMPLE METHOD FOR MINING AND VISUALIZING COMPANY RELATIONS BASED ON WEB SOURCES.
DOI: 10.5220/0003300705970602
In Proceedings of the 7th International Conference on Web Information Systems and Technologies (WEBIST-2011), pages 597-602
ISBN: 978-989-8425-51-5
Copyright
c
2011 SCITEPRESS (Science and Technology Publications, Lda.)
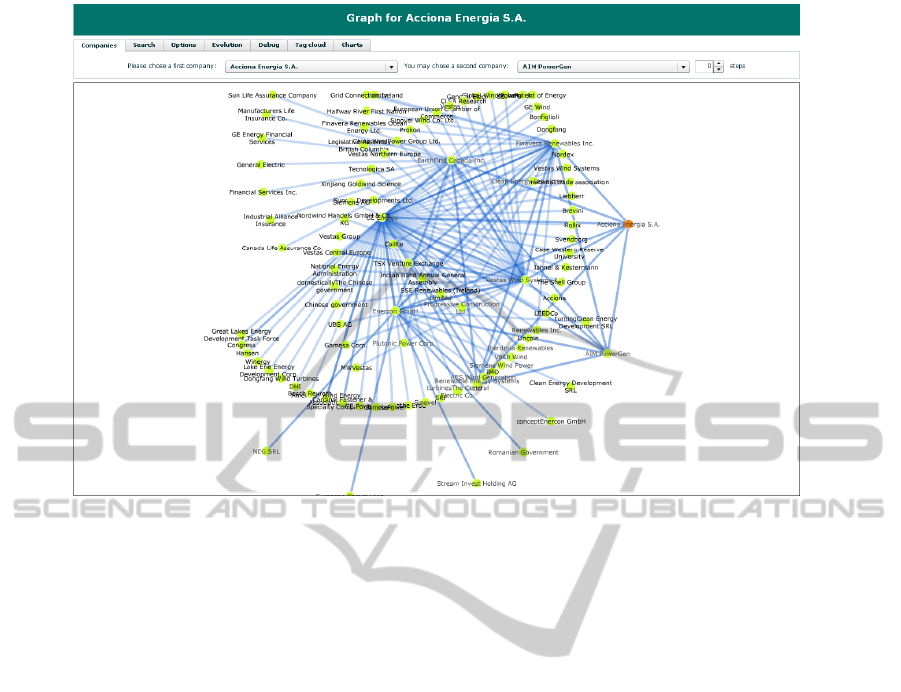
Figure 1: Standard view of the application and (force directed) graph for the company Acciona Energia.
analysing company relations focusing on relation
type identification and temporal information.
However, they hardly discuss visualization of data.
Some commercial Web Intelligence solutions
include graph-based visualization, but they generally
focus on specific topics and web sources
classification rather than on companies and
organizations. Some interesting implementations can
be found in solutions provided by IBM with its
COBRA tools (www.ibm.com/us/en), Vico Research
(www.vico-research.com) as well as by eCairn
(http://ecairn.com/). Unfortunately, the underlying
algorithms are not well documented in literature.
3 IMPLEMENTATION OF DATA
RETRIEVAL AND MINING
Although much textual information can be easily
found on the Web, the graph-based visualization
needs to rely on a specific and structured data
format. In this chapter, we present the methods and
techniques used to transform unstructured textual
content into lists of relations that can easily be fed to
a visualization toolkit.
3.1 Web Crawling and Scraping
To build a corpus large enough to allow for
interesting visualizations, we defined a list of a
dozen of sites active in a specific domain (in our
case renewable energies) and providing news
content via RSS feeds. The feeds are continuously
parsed with the ROME Java API
(https://rome.dev.java.net/), and completed with the
full text directly extracted from the web site. We
applied two methods of scraping the meaningful text
from the web sites and ignoring the irrelevant parts
(navigational elements, advertising etc.):
• Maintaining regular expressions for each of
the considered websites, which provides a
very good quality but needs preconfiguration.
It also has the drawback of not being robust
against design changes of the target websites.
We successfully applied this approach in our
meta search engine for press releases (Finzen
et al., 2009)
• A more generic approach based on relatively
simple heuristics like “longest paragraph of
coherent English words”. This approach
proved effective within a more powerful web
mining framework (see Finzen and Kintz,
2011), as it works well for basically any
HTML page. However it does not reduce
noise data as reliably as the first approach.
For the purpose of extracting company names
and visualizing relation between companies, we
found that both approaches worked quite well.
WEBIST 2011 - 7th International Conference on Web Information Systems and Technologies
598

3.2 Identification and Normalization
of Company Names
Once texts have been extracted from Web sites, we
need to identify the actual company and organization
names that will be the basis of our visualization.
This is achieved using Named Entity Recognition
(NER). Many tools and Web services are available
to perform NER (especially for the English
language). In our case, we used the OpenCalais
(www.opencalais.com/) service provided by
Thomson-Reuters. Unfortunately, as of today, this
web service does not support German. For German
texts we therefore sidestep to the Alchemy
(www.alchemyapi.com/) service which offers
similar functionality but (as to our findings) in lower
quality. The dispatching between both services is
based on the Alchemy language detection service
(www.alchemyapi.com/api/lang/). The service
results include many different annotations types
(people, places, dates, organizations and others) that
we all store in a database for further analysis. The
visualization of the company relations solely bases
on company names.
Organization and company names can be found
in texts in many different forms. For example, the
company IBM can be referred to as “IBM
Corporation”, “IBM Corp.” etc. The OpenCalais
service tries to normalize the company names when
analysing a single text document, but does not give
unified answers over a set of multiple documents. To
avoid having different versions of the same company
name in the graphs, we developed and implemented
a simple normalization algorithm. The algorithm
works in six steps:
i) The name is written in lower case, in order to
eliminate case problems (names are written in
upper case in some texts).
ii) Special characters such as accents are ignored
because they are too often inconsistently
used.
iii) A list of common suffixes in German, French
and English company names (our primary
focus being those three languages) is
searched and if found removed. Common
suffixes include “Corp.”, “GmbH” or
“SARL”.
iv) Some other keywords such as “(c)” are
removed.
v) The name is written in title case (to look like
a “real name”).
vi) Special cases are considered. For example
“IBM” should be written all upper case.
Although some limitations of this algorithm are
obvious (no distinction between Apple Corp. and
Apple Inc., etc.), our tests showed that it improved
the quality of graphs in a significant way.
Another approach to company name
normalization has been proposed with the goal to
match names against spelling errors and facilitate
database integration (Magnani and Montesi, 2007).
Using simple pattern matching methods, the authors
were able to implement a high quality company
name harmonization tool. However, similar
drawbacks to those mentioned in our case were
observed.
The annotations are stored in the database as
follows: nature of the annotation, text of the
annotation, ID or URL of the text in which the
annotation was found, start index and length of the
annotation in the text. Thus it is possible to display a
version of the text in which all annotations are
highlighted.
3.3 Identification of Company
Relations
The simplest relation between two companies that
can be extracted from Web texts is the co-
occurrence relation. This means that we consider
two companies mentioned in the same text to be in a
relation of some kind. The more texts are found
containing both the two names, the stronger the
relation. As the co-occurrence relation is not
directed, for n companies identified in a text, a total
number of n(n-1)/2 relations are extracted from each
text.
Tests showed that in order to avoid having too
much noise (i.e. meaningless relations) in graphs, it
is reasonable to ignore relations stemming from
articles containing a very large number of company
names, because these are likely to contain only a list
of unrelated companies like e.g., stock reports.
Once computed, the relations are stored in the
database as follows: (normalized) name of first
company, (normalized) name of second company
and URL or ID of the text from which the relation is
extracted. This is all the information needed to build
the graphs.
Full texts, named entities (annotations), company
names and relations are stored in the database. The
whole process is performed repeatedly: the web sites
specified in the first step are crawled every 30
minutes for new content.
A SIMPLE METHOD FOR MINING AND VISUALIZING COMPANY RELATIONS BASED ON WEB SOURCES
599

4 IMPLEMENTATION
OF VISUALIZATION
Once the data has been extracted from web sources
and stored in appropriate formats in a database, it
can be queried and transformed into visualizations.
The core of the implementation of the visualization
relies on the Prefuse Flare (http://flare.prefuse.org/)
toolkit, an Adobe Flex (www.adobe.com/
products/flex) visualization toolkit very similar to
the older and well known Java-based Prefuse
visualization toolkit (Heer et al., 2005 or http://
prefuse.org/) developed at the University of
Berkeley used in our previous work (Finzen et al.,
2009). The visualization runs client side by a Flex
application, a server is used to perform queries with
the database and to return a list of relations to the
client.
In the following paragraphs, we describe the
general user interface (UI) developed for the tool,
the database querying process, the graph layouts and
the interaction possibilities.
4.1 Input and Search UI
Based on our own research and on discussions with
a partner company intending to use the tool for its
own competitive intelligence needs, we developed
four ways allowing the user to specify a query:
• Choosing a company name from the list of all
names available in the database, and
displaying the graph for this company. The
standard graph includes the companies
directly related to the chosen company as
well as the companies related to the
companies related to the chosen company; we
speak of graph of level two. This allows
getting a general overview of the partners and
competitors of a company.
• Choosing two companies from two lists and
see if there exists or does not exist a direct (or
indirect, which means one intermediary
company may exist) relation between the two
companies. After the first company has been
selected by the user, the second list is
automatically reduced to give the user a set of
meaningful choices (for example, the first
company is removed from the list and only
those companies that co-occur with the first
one at least an adjustable number of times are
shown). This allows checking if a relation
that the user assumes must exist can be
attested by a Web source.
• Entering a search expression (keywords, start
and end date) and display the relations graph
corresponding to the texts matching this
search expression. This allows detecting only
co-occurrences of company names in a
certain context.
• Specifying a search expression, a time frame
and a step size, and animating the graph by
interpolating between each step in the time
interval. This allows detecting significant
changes and developments concerning the
activeness of a company’s network regarding
a certain topic.
4.2 Querying the Database
The data to be visualized is obtained using a REST
interface. All search parameters are passed in a
URL. A back-end server (we use a Tomcat servlet
container) then performs a database query either
directly searching the relations table (if the user
specified a company name) or matching a query
with documents and the relations with the
documents they come from (if the user entered a
generic search query). Finally, the server returns a
JSON-formatted list of relations with the name of
the first and second companies as well as an ID or
source URL indicating the document that originated
the relation. The graph is then built client-side by the
Flex application using the Prefuse Flare toolkit.
4.3 Graph Layout
The core of the application is a custom built Adobe
Flex visualization tool based on the Flare toolkit. It
provides a user interface as well as layout engines
and interaction controllers allowing the user to
interact with the data. The Flare toolkit was chosen
as it is an established open source visualization
toolkit, relatively well documented and offering
many customization and extension possibilities. This
choice implied the use of a Flex based user interface,
which allows for the easy creation of user friendly
and interactive interfaces. The main drawback of
this choice is that it prevents the tool from being run
on hardware not supporting Adobe Flash, like
Apple’s iPad.
The Prefuse Flare toolkit provides all methods
needed to communicate with a server using a REST
interface. Very little scripting is needed to transform
a list of company relations into a graph structure. In
the graph, the companies correspond to the nodes
whereas the relations between them correspond to
the edges. The force directed and radial graphs
WEBIST 2011 - 7th International Conference on Web Information Systems and Technologies
600
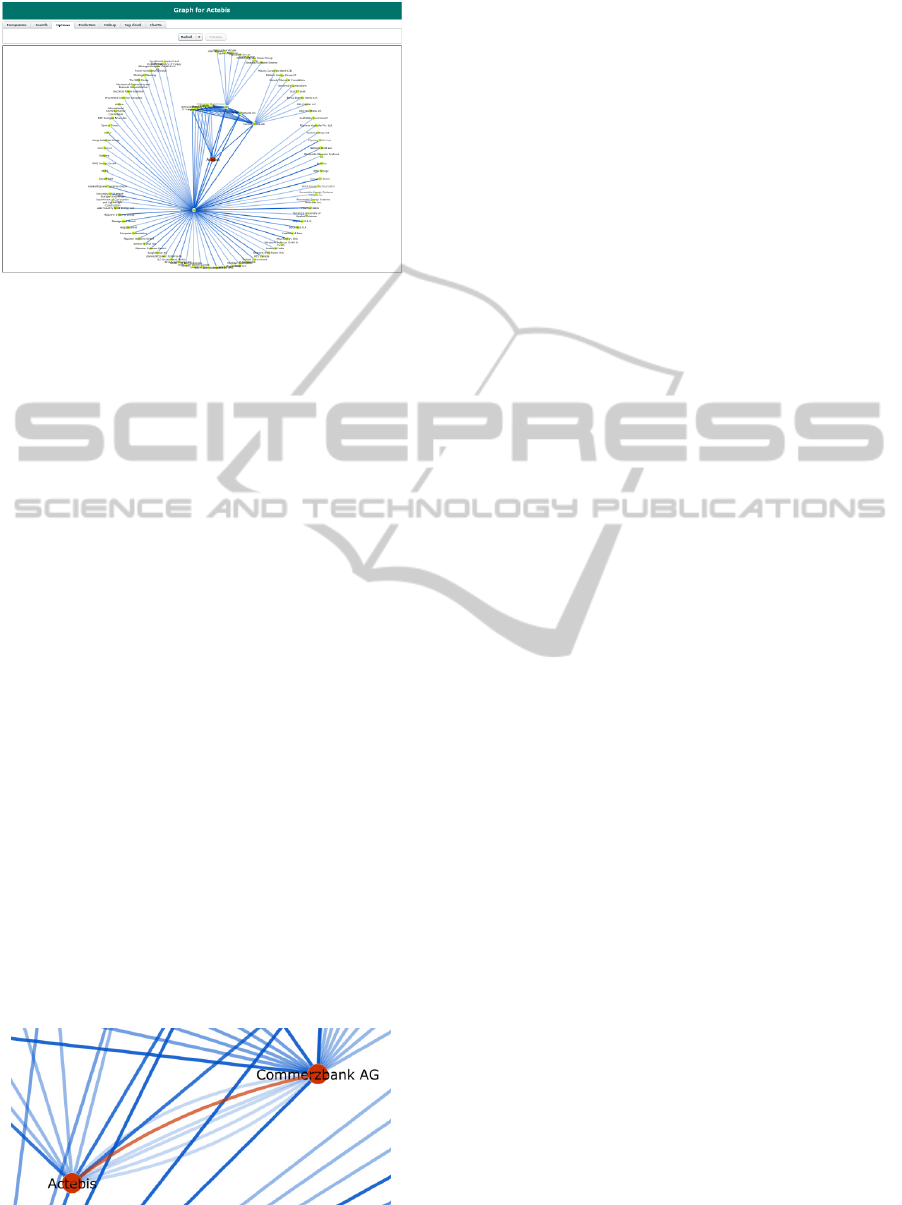
Figure 2: Radial graph for the company Actebis (orange,
in the centre).
layouts proposed by the Prefuse Flare toolkit proved
most useful in our use case. The force directed
layout is animated and allows for a lot of interaction
from the user, with the possibility to drag some
nodes in order to explore specific regions or blocks
of the graph. The radial layout (shown on Figure 2)
is static and gives a good general view of the
number of companies directly and indirectly related
to a chosen company, but is less appropriate to
obtain a detailed view of some specific regions of
the graph (mainly because some nodes tend to
overlap). Using the radial layout, the directly related
companies can clearly be seen on the first inner
circle, the indirectly related companies being on a
second, bigger circle.
As can be seen on Figure 3, some edges are
darker than others. This is intended to mean that
some relations are more important (e.g. based on
more co-occurrences) than others. Clicking on such
an edge replaces it with a number of bended edges
each corresponding with a specific co-occurrence, as
shown in Figure 7. The implementation of this
functionality required an extension of the Prefuse
Flare toolkit to distinguish multiple edges between
the same two nodes. We use Bézier curves
alternating between a line linking the two nodes.
This allows for a compact and clear visualization of
edges and avoids overlapping over other edges of
the graph.
Figure 3: Multiple mentions of a relation between Actebis
and the Commerzbank AG.
4.4 Interaction
The user interaction is a central aspect of the tool
and the main reason for the choice of a Flex based
visualization framework. Next to standard
interaction techniques directly provided by the Flare
toolkit such as zooming with the mouse wheel and
panning by clicking and dragging, we added some
simple custom built click-based interactions:
A double click on a node (one node representing
one company) displays a pop-up window offering
the choice between loading a graph centered on the
chosen company and loading a Web page associated
to the company name (it could be the list of all texts
associated with the company in the database, our
current implementation directs the user to a search
engine results page showing information related to
the company). A single click on an edge switches
the display of multiple relations between a collapsed
and an expanded mode, as explained in the previous
paragraph. A double click on an edge loads a Web
page helping the user understand the current
relation; in our implementation we show the text
from which the relation was inferred.
By moving its mouse over parts of the graph, the
user can get a zooming effect: company names
(nodes) as well as relations (edges) are highlighted
using a different color and have their size increased
to help the user distinguish them from other non-
highlighted elements of the graph.
5 CONCLUSIONS
AND OUTLOOK
Using mostly simple and freely available
technologies, we could build a powerful tool that
visualizes relations between companies and
organizations extracted from a defined set of web
sources. Furthermore, it is possible to integrate the
tool with a larger solution that lets the user define
and adapt the list of sources to monitor. We found
that even without analyzing the detailed semantics of
the relations between organizations and only
focusing on co-occurrence, it was possible to
quickly obtain meaningful and helpful graphs for
day to day web intelligence and especially
competitive intelligence activities.
We presented some ways to improve the tool by
developing the text mining aspects and using or
building better tools to identify the nature of the
relation between companies. Furthermore, we
presented ways to use this information to improve
A SIMPLE METHOD FOR MINING AND VISUALIZING COMPANY RELATIONS BASED ON WEB SOURCES
601

the visualization and usage of the knowledge gained
from building these graphs.
Although the simple implementation developed
in less than one man month gave interesting and
useful results that are currently being evaluated
during a field test with a partner company, some
limitations as well as ways to improve the tool can
be mentioned.
5.1 Limitations
An obvious limitation of the current state of the tool
is that all relations are co-occurrence relations and
are presented in the same way, regardless of their
actual meaning and importance. It would be helpful
to define a certain number of relation types and to
use the possibilities of a visual user interface to
distinguish between types and between relations that
can be defined as of main importance and of
secondary importance with regard to the use case.
Not only relations could be distinguished but
also company types. With regard to the competitive
intelligence use case, it would be helpful to display
partner companies in one color and competitor
companies in another color, further distinguishing
between customers, suppliers, etc.
Another kind of limitations comes from the
implementation: the whole graph being loaded once
and either completely updated or not at all. A more
interactive and on-the-fly data retrieval would help
the navigation in large company networks.
5.2 Future Work
Some of these limitations are to be addressed in our
future work. Using and adapting advanced text-
mining tools, it is possible to detect and classify a
certain number of relations between companies, such
as “customer of” or “acquirer of”, as shown e.g. by
Hu et al. (2009). This work will be accompanied by
a proposed classification of company relations types
(customer, supplier, etc.) and attributes (directed,
transitive, etc.). Another important aspect related to
this classification is the analysis of internal company
or group structures.
Another part of the planned work consists in the
improvement of the organization name
normalization algorithm. An aspect that was ignored
as of today is the multilingualism of Web sources,
which means that “Microsoft Germany” and
“Microsoft Deutschland” will be considered as two
distinct companies. This could for many cases be
addressed by well-built look-up lists.
An evaluation of the recall achieved by
automatic detection of company relations is also
planned.
REFERENCES
Finzen, Jan, Kintz, Maximilien, Kett, Holger, Koch,
Steffen. 2009. Strategic Innovation Management on
the Basis of Searching and Mining Press Releases.
Proceedings of the 5th WEBIST conference, Lisbon,
Portugal, March 23-26, 2009.
Finzen, Jan, Kintz, Maximilien: Innovation Mining. 2011.
Proceedings of the 7
th
WEBIST conference,
Noordwijkerhout, The Netherlands, May 06-09, 2011.
Heer Jeffrey, Card, Stuart K., Landay, James A. 2005.
Prefuse: a toolkit for interactive information
visualization. Proceedings of the SIGCHI conference
on Human factors in computing systems, Portland,
Oregon, USA, April 02-07, 2005.
Freeman, Linton C. 2000. Visualizing Social Groups.
Proceedings of the Section on Statistical Graphics.
American Statistical Association.
Buzgar, Adrian N., Buraga, Sabin C. 2008. Visualizing
Online Social Networks in the Context of Web 2.0.
Sisteme Distribuite, University Stefan cel Mare of
Suceava, Suceava, Romania.
Hu, Changjian, Xu, Liqin, Shen, Guoyang, Fukushima,
Toshikazu. 2009. Temporal Company Relation Mining
from the Web. Lecture Notes in Computer Science,
2009, Volume 5446/2009, 392-403.
Magnani, M., and Montesi, D. 2007. A study on company
name matching for database integration. Technical
Report UBLCS-07-15. May 2007.
Matsuo, Yutaka, Mori, Junichiro, Hamasaki, Masahiro,
Nishimura, Takuichi, Takeda, Hideaki, Hasida, Koiti,
and Ishizuka, Mitsuru. 2007. POLYPHONET: An
advanced social network extraction system from the
Web. Web Semantics. 5, 4 (December 2007), 262-278.
2007
WEBIST 2011 - 7th International Conference on Web Information Systems and Technologies
602
