
AN AUTOMATED METHOD FOR RETINAL IMAGE MATCHING
USING VASCULAR FEATURES
Alauddin Bhuiyan
1,2
, Baikunth Nath
1
, Kotagiri Ramamohanarao
1
and Tien Y. Wong
2
1
Department of Computer Science and Software Engineering, The University of Melbourne Australia
Victoria 3010, Australia
2
Centre for Eye Research Australia, The University of Melbourne Australia, Victoria 3002, Australia
Keywords:
Retinal image, Vessel bifurcation, Branch and crossover points, Invariant feature, Feature vector, Binary tree,
Tree matching algorithm.
Abstract:
In this paper, we propose a method for retinal image matching that can be used in image matching for person
identification or patient longitudinal study. Vascular invariant features are extracted from the retinal image and
a feature vector is constructed for each of the vessel-segments in the retinal blood vessels. The feature vectors
are represented in a tree structure with maintaining the vessel-segments actual hierarchical positions. Using
these feature vectors, corresponding images are matched. An image matching method is demonstrated which
identifies the same vessel in the corresponding images for comparing the desired feature(s). Initial results
demonstrate that the method is suitable for image matching and patient longitudinal study.
1 INTRODUCTION
Recent advancement in retinal imaging has enable us
to use images for earlier diagnosis of diseases, image
matching in biometric security application and infor-
mation retrieval purposes. Studies show that changes
in the retinal vascular features such as vessel width,
tortuosity and branching angle are very important in-
dicator for predicting hypertension and cardiovascu-
lar diseases (Wong et al., 2006),(Wong et al., 2003).
In addition, retinal vascular pattern is unique to each
individual and can be used in image matching appli-
cations such as biometric authentication and informa-
tion retrieval. Hence, a suitable approach that can ac-
curately analyze retinal images for both disease di-
agnosis and image matching purposes will be a very
significant contribution in this image modality.
For disease prediction or clinical trial, the most
widely used approach is to take person’s retinal im-
age (Figure 1(a)) within a time interval and com-
pare these images to observe the change(s) in the vas-
cular features (Stanford et al., 1988),(Abrahams and
Gregerson, 1983). In various studies (Hughes et al.,
2008),(Taarnhoj et al., 2008) authors have reported
the effect of hypertension treatment on retinal vessel
diameter and tortuosity which is performed by tak-
ing person’s retinal image before and after medica-
tion. These studies mainly consider manual or semi-
automatic methods for image analysis which are very
time consuming and expensive. Further, these studies
are based on analyzing a single feature which is not
enough to observe multiple feature changes. None of
these techniques is able to match the vascular features
from two images based on vessel-segments hierarchi-
cal position, which is very important for automated
patient longitudinal study.
Retinal image matching methods for person iden-
tification mainly register images after vessel segmen-
tation, or match bifurcation or branch point in the cor-
responding images (Marino et al., 2006), (Harris and
Yen, 2002), (Womack, 1994). In the first approach,
retinal blood vessels are used as the biometric param-
eter, with a prior registration stage needed to align the
template image and the acquired image. The second
approach segments the blood vessel from the image
and computes the bifurcation/branch and crossover
points (Figure 1(b)). Overall, bifurcation/branch and
crossover points geometry should provide higher in
generating unique pattern for an individual person. At
present, retinal vascular bifurcation and branch points
are consider as the same parameter for image match-
ing applications. Classified bifurcation and branch
points can add higher degree in the uniqueness of the
retinal vascular pattern.
Considering these issues, we propose an auto-
matic retinal image matching method, which is highly
342
Bhuiyan A., Nath B., Ramamohanarao K. and Y. Wong T..
AN AUTOMATED METHOD FOR RETINAL IMAGE MATCHING USING VASCULAR FEATURES.
DOI: 10.5220/0003275903420347
In Proceedings of the International Conference on Bio-inspired Systems and Signal Processing (BIOSIGNALS-2011), pages 342-347
ISBN: 978-989-8425-35-5
Copyright
c
2011 SCITEPRESS (Science and Technology Publications, Lda.)
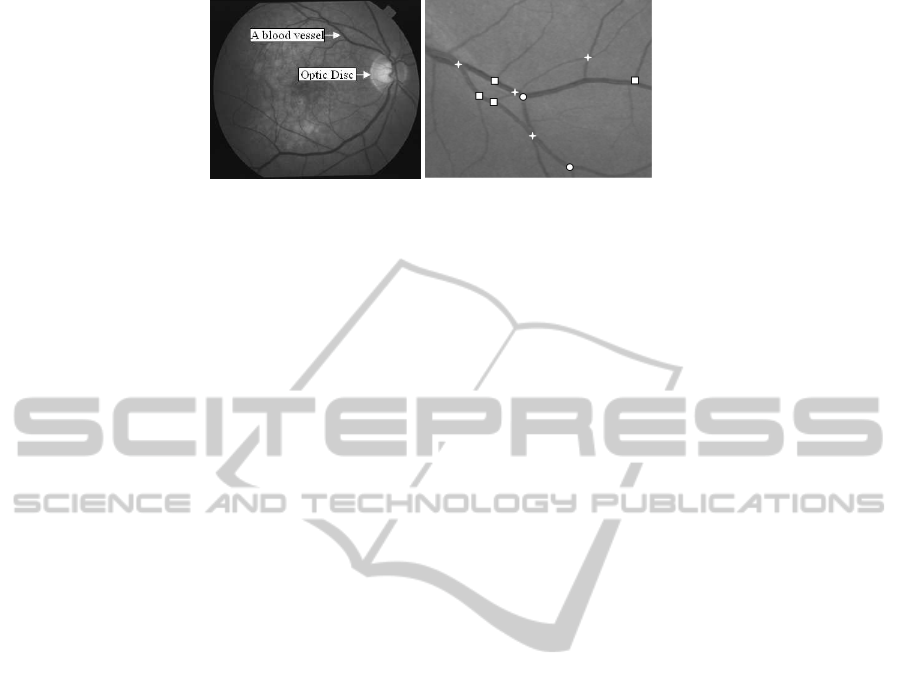
(a) (b)
Figure 1: A retinal image showing the blood vessels (a) and a cropped section showing vascular Bifurcation (circle), Branch
(square) and Crossover (star) points(b).
potential for patient longitudinal study and biometric
security application. The method uses retinal vascular
bifurcation, branch and crossover points as features
to match the images. We utilize the retinal vessel
hierarchical property and construct a binary tree for
each vessel to match images with high confidence. A
number of vessel tree construction methods are avail-
able in the literature for retinal image (Deng et al.,
2010),(Lin et al., 2009),(Guo et al., 2006). None
of them represents multiple features for each of the
vessel-segments hierarchically. Further, no method
classifies the bifurcation and branch points to match
the images which provides higher degree of unique-
ness in the pattern. Our proposed method will be
able to match retinal images for authentication or ana-
lyzing multiple feature changes for disease diagnosis
purposes.
The rest of the paper is organized as follows. Sec-
tion 2 describes the proposed method which includes
the vascular tree-model construction, invariant feature
extraction and tree matching based on the invariant
features. Initial results on the matching method which
can be used for patient longitudinal study is shown in
section 3. Section 4 concludes the paper with future
work.
2 PROPOSED METHOD
Our proposed image matching method is based on
the tree representation of the retinal vascular network
which is a hierarchical representation of features of
the vessel-segments of blood vessels. In this pa-
per, we mainly focus on the vascular invariant fea-
ture extraction, the feature vector construction and the
matching algorithm for patient longitudinal study. We
utilize retinal bifurcation, branch and crossover points
to construct the feature vector. The vascular invariant
features along with the vessel-segments hierarchical
position provide a unique pattern for each of the blood
vessels in the retina for each individual person.
2.1 The Tree-model
We have applied a method for developing a tree struc-
ture (we call it tree-model) of the retinal vascular net-
work which is based on vessel centerline (L), width
(W) and bifurcation (B
2
), branch (B
1
) or crossover
(C
1
) point information in the retinal optical fundus
image as represented in Figure 2(a). We have ap-
plied the methods for vessel segmentation and cen-
terline detection (Bhuiyan et al., 2007a) and bifurca-
tion, branch and crossover points detection (Bhuiyan
et al., 2007b) which will be used in the tree-model.
The construction of the tree-model begins by tracking
the vessel centerline from the border of the optic disc
(OD) in the retinal image. This corresponds to the
root node in the tree-model. Each vessel originating
from the optic disc is then represented by a binary tree
and is linked to the root node in the tree-model.
The blood vessel centerlines are fragmented into
different vessel-segments based on the bifurcation,
branch and crossover points. Initially, these landmark
points and their corresponding vessels’ start or end
points are computed and stored. Hence, a vessel-
segment starts from the optic disc boundary or a bi-
furcation or a branch point, and ends at a bifurcation
or branch point. For each vessel-segment, the features
are computed and inserted into its corresponding node
in the tree-model. This is shown in Figure 2 for vessel
V
1
.
Vessel-segment V
1
.S
1
(starts from S
1
and ends at
E
1
) is traced, and its features are inserted into the
corresponding node (node V
1
.S
1
in Figure 2(b)) in
the tree-model. Its daughter vessel-segments V
1
.S
2
and V
1
.S
3
are then traced. These vessel-segments’
features are inserted into the tree-model as children
nodes of V
1
.S
1
(Figure 2(b)). Similarly, vessel-
segments V
1
.S
4
and V
1
.S
5
are inserted as the children
node of V
1
.S
3
. Generally, a vessel-segment appears
as two parts in a crossover point (C
1
in Figure 2(a)).
Therefore, the crossover point is used to trace the
other part of a vessel-segment. For example, as in Fig-
ure 2(a), when the crossover point C
1
is encountered,
AN AUTOMATED METHOD FOR RETINAL IMAGE MATCHING USING VASCULAR FEATURES
343
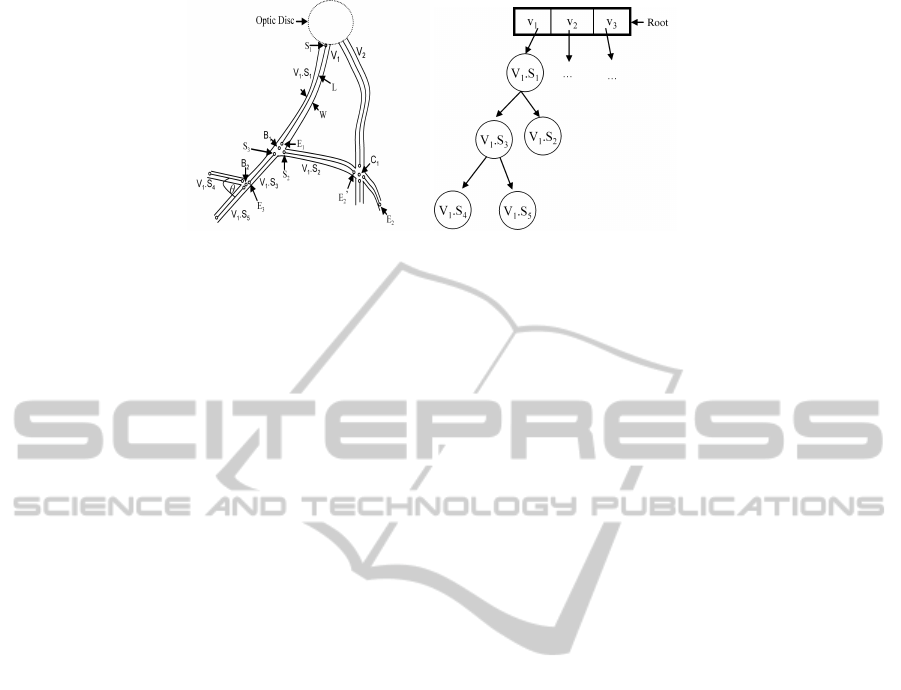
(a) (b)
Figure 2: A schematic diagram of a retinal image showing two blood vessels (V
1
and V
2
) and the optic disc (a) and the
tree-model representing the binary tree for vessel V
1
(b).
the end point of the vessel segment V
1
.S
2
is measured
as E
2
instead of E
′
2
.
2.2 Invariant Features for Image
Matching
For image matching we consider the vascular in-
variant features i.e., the features invariant to rota-
tion, translation or scaling. The features are: vessel-
segment’s length to width ratio (L/W), bifurcation or
branch point, Information on crossover existence in
a vessel-segment, crossover location in the vessel-
segment and acute angle between the parent and
smaller daughter vessel-segments. We consider these
invariant features which provide a unique pattern for
any individual’s retina. For each vessel-segment these
feature values are inserted into the corresponding
node in the tree-model.
2.3 Vascular Feature Extraction
For vascular feature extraction we consider vessel
centerline image, edge image and fragmented center-
line image. The methods for obtaining these images
are described in (Bhuiyan et al., 2008).
Length to Width Ratio (L/W). We implement region
growing algorithm (Gonzalez and Woods, 2008) to
extract the length of a vessel-segment. Using the op-
tic disc center and radius, we search a circular region
around the OD and determine the starting pixel of a
vessel centerline. Once a vessel centerline (starting)
pixel is obtained we traverse through the centerline
until we reach its end point.
For each vessel-segment, the starting pixel is con-
sidered for initiating the traversal process in the frag-
mented vessel centerline image. The traversal algo-
rithm uses the 3× 3 neighborhood connectivity check
to find the neighboring pixels in the vessel-segment.
For this, a mask is applied by considering the start-
ing pixel of any vessel-segment as its center. Once
a neighboring pixel is found it replaces the previous
center pixel in the mask. Each time a pixel position
is considered, a flag value is assigned to this. Once
the traversal process reaches the vessel-segments end
point, it stops if it belongs to a bifurcation or a branch.
The traversalprocess also stops if the vessel-segments
end point is not obtained after a certain number of
iterations. Once the end point is obtained, the to-
tal length of this vessel-segment is returned in pixel
number and average width (Bhuiyan et al., 2008) is
computed. These values are inserted into the corre-
sponding node in the tree-model.
Bifurcation or Branch Point. We classify each land-
mark as bifurcation or branch point (Bi/Br). The bi-
furcation, branch and crossover point classification
method is applied by using the method described in
(Bhuiyan, 2009). We assign a unique value (1 for bi-
furcation and 0 for branch) in the feature value for
each of the vessel-segment.
Existing Crossover. For each vessel-segment if there
is any crossover point exists we assign a unique value
for the node. We insert 1 for presence of a crossover
point and 0 for absence of the crossover point to the
node value.
Crossover Location. For the vessel-segment, if there
is any existing crossover point we assign the posi-
tional information of that crossover. For example, if
the actual length is 100 pixels and the crossover po-
sition is on the 70
th
pixels from the starting of the
vessel-segment; we assign the ratio of its position to
the total segment length, which is 0.7. If there is no
crossover we assign 0 for this feature value.
Acute Angle between the Parent and Smaller
Daughter Vessel. We find the acute angle between
BIOSIGNALS 2011 - International Conference on Bio-inspired Systems and Signal Processing
344
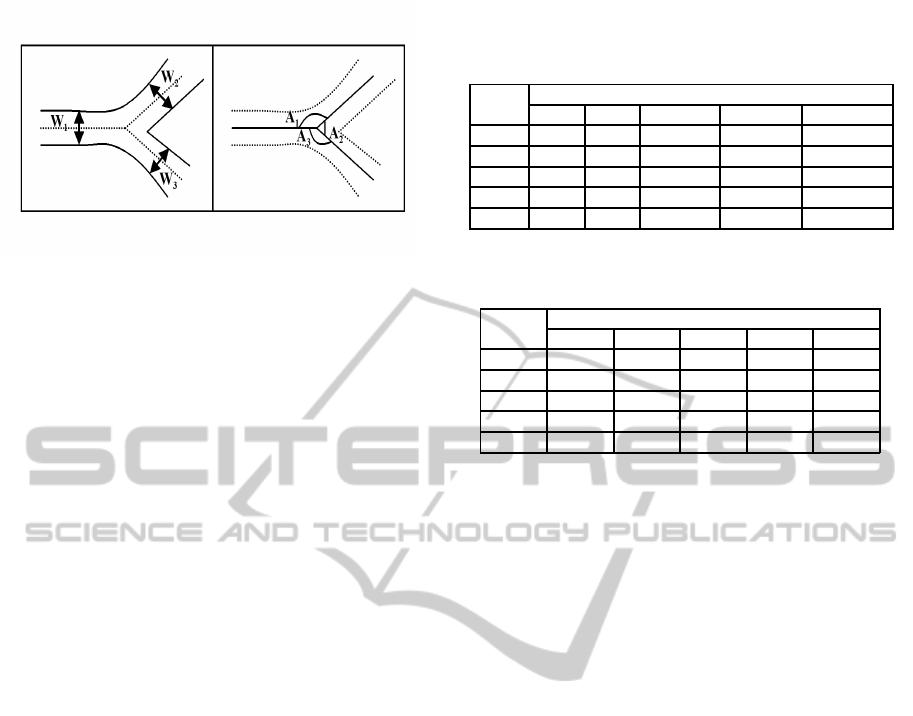
Figure 3: Vascular widths (left) and Angles (right).
the parent and the smallest vessel. The parent and
smallest (daughter) vessel is classified by using the
width of each of the vessels for any bifurcation or
branch point. The vessel-segments for each bifurca-
tion or branch point are sorted based on their width.
Then the angle between the centerlines of highest and
lowest width vessels’ are computed. Figure 3 shows
the vessel-segments width and the corresponding an-
gles.
2.4 Accessing Vascular Features from
the Tree-model
We access the vascular features from the tree-model
by using preorder tree traversal algorithm (Knuth,
1973). To traverse a non-empty binary tree in pre-
order, we perform the following operations recur-
sively at each node. Starting at the root of a binary
tree, we retrieve the values for the current node (re-
ferred to as ”visiting” the node), then traverse to the
left child node, and finally traverse to the right child
node.
2.5 Feature Vector Construction and
Matching
Each binary tree is traversed and the invariant feature
values (in Table 1) are obtained from each node. Fol-
lowing this, for each node (i.e., each vessel-segment)
we construct a feature vector from these invariant fea-
ture values. We note that the invariant features with
their actual hierarchical position in the tree-model en-
hance the uniqueness of a feature vector. We then,
compare the corresponding feature vectors on the tree
traversal order for finding the binary trees (which rep-
resent the same vessel) from the tree-models.
For image matching, our goal is to find the cor-
responding binary trees in the tree-models that repre-
sent the same vessel in the two retinal images. We
perform the bitwise comparison of the feature vec-
tors to find the distance between the corresponding
binary trees. For each corresponding feature vector,
if a match is found, we add zero to the final matching
Table 1: The invariant features for vessel-segments in the
nodes of a tree-model.
Invariant Features
Nodes L/W Bi/Br Crossover Cross pos. Acute angle
1 88.77 1 0 0 0.877
2 18.27 0 0 0 1.126
3 43.12 0 0 0 0
4 34.27 1 1 0.79 0.788
5 53.42 1 0 0 0.689
Table 2: The distance matrix between the vessels for an
image.
Distance between the vessels in node number
Vessel1 Vessel2 Vessel3 Vessel4 Vessel5
Vessel1 0 7 7 7 7
Vessel2 7 0 7 7 7
Vessel3 7 7 0 7 7
Vessel4 7 7 7 0 7
Vessel5 7 7 7 7 0
distance and one if there is no match. We note that the
matching distance is the distance between the binary
trees (i.e., the vessels) in node number. We obtained
the matching matrix by comparing the corresponding
binary trees in the tree-models.
For finding the corresponding binary trees, we
consider the upper two levels’ nodes from each of the
binary trees. This way we are able to obtain sufficient
number of feature vectors for matching to find the cor-
responding binary trees from the tree-models. This
also makes the matching process faster and reduces
computation complexity which is higher with consid-
ering more levels of nodes in the binary trees. Once
a match is obtained, another binary tree is considered
from the respective tree-model to find the correspond-
ing binary tree to the other tree-model. This matching
process continues until all the corresponding vessels
are obtained.
3 EXPERIMENTAL RESULTS
We match the tree-models obtained from the retinal
images of an individual. From this we trace the cor-
responding blood vessels to observe the changes in a
particular period of time. We note that each vessel
has a unique pattern on its feature vectors. Therefore,
we are always able to find the corresponding vessel
or binary tree in the tree-models. Table 2 shows the
distance of different blood vessels in node number for
an image.
To observe the performance of our matching
method on the images taken at different conditions
(e.g., second image may be rotated or shifted while
capturing), we rotated the image from ±5
o
to ±30
o
.
AN AUTOMATED METHOD FOR RETINAL IMAGE MATCHING USING VASCULAR FEATURES
345
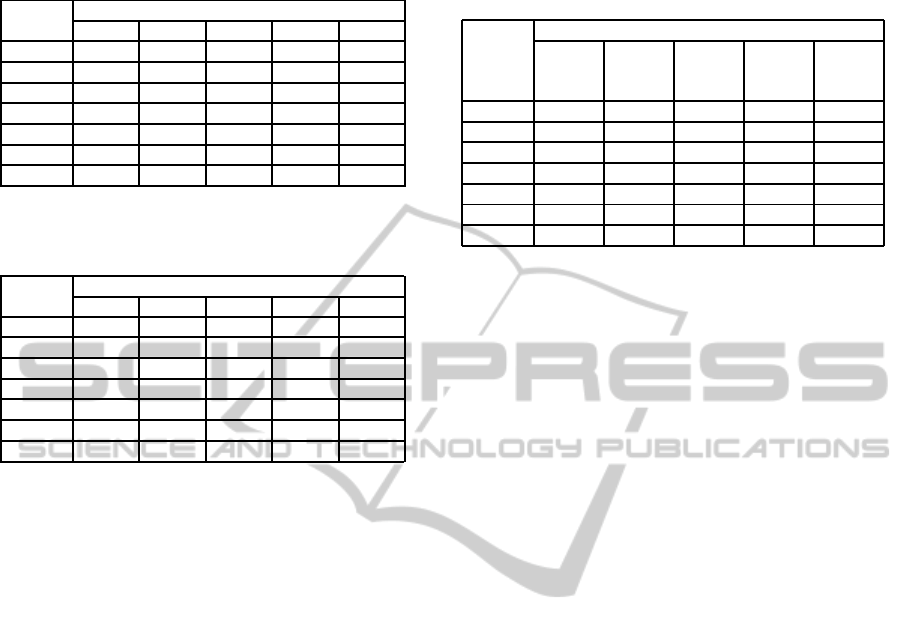
Table 3: The distance matrix with vessel 1 for different ro-
tating angles.
Distance with vessel1 in node number
Rotation Vessel1 Vessel2 Vessel3 Vessel4 Vessel5
0
o
0 7 7 7 7
5
o
0 7 7 7 7
10
o
0 7 7 7 7
15
o
2 7 7 7 7
20
o
2 7 7 7 7
25
o
4 7 7 7 7
30
o
4 7 7 7 7
Table 4: The distance matrix after applying the thresholding
with vessel 1 for different rotating angles.
Distance with vessel1 in node number
Rotation Vessel1 Vessel2 Vessel3 Vessel4 Vessel5
0
o
0 7 7 7 7
5
o
0 7 7 7 7
10
o
0 7 7 7 7
15
o
0 7 7 7 7
20
o
0 7 7 7 7
25
o
0 7 7 7 7
30
o
0 7 7 7 7
Unfortunately, we do not have the data on images
taken at different times for the same person. Hence,
to check the robustness of our method, we rotated the
same image and constructed the tree-model for each
rotated image. We then obtained the distance matrix
in node numbers for one vessel with the other ves-
sels. This is done by comparing the first tree-model
which is obtained from the original image with the
tree-models constructed for the images in different ro-
tating angles. Table 3 shows the distance matrix for
vessel 1 with the original tree-model and the obtained
tree-model after rotating the image.
We observe that for smaller rotation angle, there is
no difference on the feature vectors’ attributes. With
higher rotation angle, some changes are introduced
in feature values such as vessel length, width and
crossover position. We observe that such errors are
introduced due to the discretization of the pixels’ ac-
tual position during rotation operation of the image.
To overcome this problem, we consider a threshold
value of ±5% for the length to width ratio and actual
crossover position and received the distance as 0 for
the same vessel while the distances with other vessels
remain the same. Table 4 shows the distance matrix
for vessel 1 after applying the thresholding technique.
Using the tree-models, we also compare the distances
between the same vessels in the images with this tech-
nique. Table 5 shows the distance matrix between the
same vessels in the image (from the two tree-models).
From these observations we can conclude that the
proposed vascular network model is suitable for com-
Table 5: The distance between the same vessel represented
by the two different tree-models after applying the thresh-
olding.
Distance between
Vessel 1 Vessel 2 Vessel 3 Vessel 4 Vessel 5
Rotation to to to 3 to to
Vessel1 Vessel2 Vessel3 Vessel4 Vessel5
0
o
0 0 0 0 0
5
o
0 0 0 0 0
10
o
0 0 0 0 0
15
o
0 0 0 0 0
20
o
0 0 0 0 0
25
o
0 0 0 0 0
30
o
0 0 0 0 0
paring vascular feature(s) between two images for pa-
tient longitudinal study. Our main focus is to find
the corresponding vessel i.e., the binary tree from the
tree-models. In worst case, if the minimum number
of nodes are not matched from the corresponding bi-
nary trees, we can rely on the best match between
the binary trees assuming that we are matching the
tree-models from the same person’s images. Based
on this, we can decide about the corresponding bi-
nary trees. We evaluate the robustness of our method
for image matching and considered 20 images in the
STARE database. For each image the tree-model is
constructed and then the nodes are compared to find
the distance matrix. We observe that each image is
unique for its vascular pattern. Table 6 shows the dis-
tance in node number between the tree-models for ten
different images.
4 CONCLUSIONS AND FUTURE
WORK
In this paper we described a novel approach for reti-
nal image matching which is highly suitable for pa-
tient longitudinal study. Initial results predicts that
the method will be very accurate in matching the reti-
nal images and finding the corresponding blood ves-
sels. Based on this method, the medical practitioners
can observe changes on different vascular features for
each of the vessel-segments. Simple modification of
the method can also be suitable for biometric secu-
rity application. At present we are acquiring multiple
images for the same person to enable a large scale
study and further validation of the method. We aim
to perform two case studies in biometrics and patient
longitudinal study using our proposed retinal image
matching algorithm.
BIOSIGNALS 2011 - International Conference on Bio-inspired Systems and Signal Processing
346
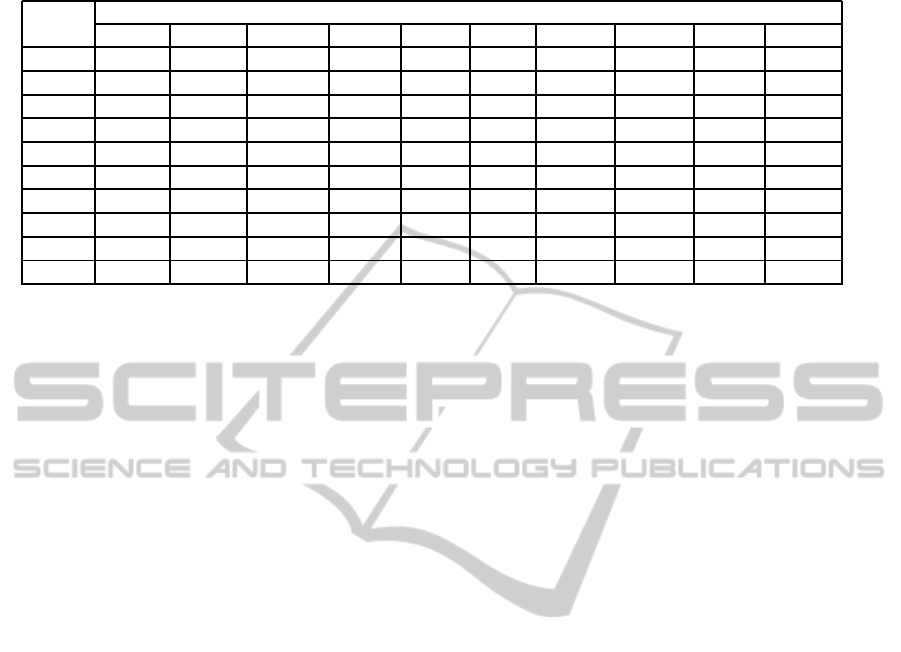
Table 6: The distance matrix between the images.
The distance between the images in node number
One Two Three Four Five Six Seven Eight Nine Ten
One 0 31 42 34 47 29 56 48 49 51
Two 31 0 43 35 48 30 57 49 50 52
Three 42 43 0 46 59 41 68 60 61 63
Four 34 35 46 0 51 33 60 52 53 55
Five 47 48 49 51 0 46 73 65 66 68
Six 29 30 41 33 46 0 55 47 48 50
Seven 56 57 68 60 73 55 0 74 75 77
Eight 48 49 60 52 65 47 74 0 67 69
Nine 49 50 61 53 66 48 75 67 0 70
Ten 51 52 63 55 68 50 77 69 70 0
REFERENCES
Abrahams, I. W. and Gregerson, D. S. (1983). Longitudinal
study of serum antibody responses to bovine retinal s-
antigen in endogenous granulomatous uveitis. British
Journal of Ophthalmology, 67:681–684.
Bhuiyan, A. (2009). Automated modeling of retinal vas-
cular network. PhD Thesis, The University of Mel-
bourne.
Bhuiyan, A., Nath, B., Chua, J., and Kotagiri, R. (2007a).
Blood vessel segmentation from color retinal images
using unsupervised classification. In the proceedings
of the IEEE International Conference of Image Pro-
cessing, pages 521–524.
Bhuiyan, A., Nath, B., Chua, J., and Ramamohanarao, K.
(2007b). Automatic detection of vascular bifurcations
and crossovers from color retinal fundus images. Pro-
ceedings of Third International IEEE Conference on
Signal-Image Technologies and Internet-Based Sys-
tem (SITIS), pages 711–718.
Bhuiyan, A., Nath, B., Chua, J., and Ramamohanarao, K.
(2008). Vessel cross-sectional diameter measurement
on color retinal image. Communications in Computer
and Information Science, 25:214–227.
Deng, K., Tian, J., Zheng, J., Zhang, X., Dai, X., and Xu,
M. (2010). Retinal fundus image registration via vas-
cular structure graphmatching. International Journal
of Biomedical Imaging, pages 1–13.
Gonzalez, R. C. and Woods, R. E. (2008). Digital Image
Processing. Pearson Prentice Hall, third edition.
Guo, X., Hsu, W., Lee, M. L., and Wong, T. Y. (2006). A
tree matching approach for the temporal registration
of retinal images. Proceedings of IEEE International
Conference on Tools with Artificial Intelligence, pages
632–642.
Harris, A. J. and Yen, D. C. (2002). Biometric authenti-
cation: assuring access to information. Information
Management and Computer Security, 10(1):12–19.
Hughes, A. D., Stanton, A. V., Jabbar, A. S., Chapman, N.,
Martinez-Perez, M. E., and Thom, S. A. (2008). Effect
of antihypertensive treatment on retinal microvascu-
lar changes in hypertension. Journal of Hypertension,
26:1703–1707.
Knuth, D. E. (1973). The art of computer programming.
Addison-Wesley Pub. Co., 2nd edition edition.
Lin, K.-S., Tsai, C.-L., and Sofka, M. (2009). Vascular tree
construction with anatomical realism for retinal im-
ages. Proceedings of Ninth IEEE International Con-
ference on Bioinformatics and Bioengineering, pages
313–318.
Marino, C., Penedo, M. G., Penas, M., Carreira, M. J., and
Gonzalez, F. (2006). Personal authentication using
digital retinal images. Pattern Analysis Application,
9:21–33.
Stanford, M. R., Graham, E., Kasp, E., Sanders, M. D., and
Dumonde, D. C. (1988). A longitudinal study of clin-
ical and immunological findings in 52 patients with
relapsing retinal vasculitis. British Journal of Oph-
thalmology, 72:442–447.
Taarnhoj, N. C. B. B., Munch, I. C., Sander, B., Kessel, L.,
Hougaard, J. L., and Kyvik, K. (2008). Straight ver-
sus tortuous retinal arteries in relation to blood pres-
sure and genetics. British Journal of Ophthalmology,
92:1055–1060.
Womack, M. (1994). The eyes have it. Sensor Review,
14(4):15–16.
Wong, T. Y., Kamineni, A., Klein, R., Sharrett, A. R.,
Klein, B. E., Siscovick, D. S., Cushman, M., and Dun-
can, B. B. (2006). Quantitative retinal venular caliber
and risk of cardiovascular disease in older persons.
Archives of Internal Medicine, 266:2388–2394.
Wong, T. Y., Klein, R., Klein, B. E. K., Meuer, S. M.,
and Hubbard, L. D. (2003). Retinal vessel diame-
ters and their associations with age and blood pres-
sure. Investigative Ophthalmology and Visual Science,
44(11):4644–4650.
AN AUTOMATED METHOD FOR RETINAL IMAGE MATCHING USING VASCULAR FEATURES
347
