
ADDRESSING E-GOVERNMENT WEBSITE USABILITY
A Users’ Centred Evaluation
Zhao Huang and Laurence Brooks
School of Information System, Computing and Mathematics, Brunel University, Brunel, U.K.
Keywords: e-Government, e-Government website development, Usability, Users’ centred approach.
Abstract: The challenge of greater users’ participation with e-government remains a significant issue. E-government
website usability has been found to be one of the major reasons influencing users’ interaction, which needs
to be addressed when developing e-government. This empirical study evaluates a current e-government
website, to identify specific usability problems. Based on the identified problems, the design solutions are
proposed, redesigned and evaluated in order to develop a more usable e-government website. The results
indicate that with the proposed design solutions provision, the identified usability problems have been
addressed. Such improvements may promote overall usability of e-government and make better users’ task
performance. These are beneficial for designers to further develop their e-government usability.
1 INTRODUCTION
Traditionally, government organisations deliver their
information and services through three main
methods: face to face, telephone and postal\mail
services (Brown, 2003). However, such methods are
largely influenced by time and space limitations,
which sometimes make access to information
difficult and block users’ engagement. With the
widespread use of the Internet and web technology,
it can be argued that a fourth method to deliver
government services has been created – e-
government. This provides all types of government
information and services available online. In such an
environment, users can interact with government
services 24 hours a day, 7 days a week without
physical distance requirements. Since these
advantages have become apparent, governments
worldwide have rapidly developed e-governments,
which has now become a global phenomenon
(Jaeger, 2003). However, research indicates that the
actual use of information and services provided on
e-government websites faces a challenge (Donker-
Kuijer, 2010). Website usability issue is one of the
major reasons for the underuse of e-government. For
example, Holden et al. (2003) found that many users
do not become involved with government online
services because of difficulty in finding their
expected information on the site. Generally, website
usability refers to how useful and user-friendly the
site is. If websites fail to provide ease of use from a
design standpoint and frustrate users interaction with
government services, e-government will not be
accepted and used by users (Barker, 2009).
Therefore, this suggests that e-government may not
achieve greater users’ participation unless the
website usability is recognised and addressed.
However, current research has not paid enough
attention to evaluating the usability of current e-
government websites, especially identifying specific
problems. Even some studies that conduct usability
investigation lack empirical evidence to provide
concrete prescriptions for the identified usability
problems in order to develop more usable e-
government websites. Furthermore, an e-government
website is used by a wide range of users, who have
heterogeneous backgrounds in terms of skills,
experience and education. These users may have
different usability needs from e-government
websites, which may increase the difficulty for
designers in identifying users’ requirements of
usability. In order to overcome this difficulty, a
users’ centred approach is considered as an
appropriate method, which can involve users’
participation and address users’ point of view. By
doing so, it can be beneficial for designers to
understand users and their usability requirements.
Additionally, it can directly detect the e-government
features that can cause users to have the most
concerns about usability. Accordingly, there needs
173
Huang Z. and Brooks L..
ADDRESSING E-GOVERNMENT WEBSITE USABILITY - A Users’ Centred Evaluation.
DOI: 10.5220/0003272201730183
In Proceedings of the 7th International Conference on Web Information Systems and Technologies (WEBIST-2011), pages 173-183
ISBN: 978-989-8425-51-5
Copyright
c
2011 SCITEPRESS (Science and Technology Publications, Lda.)

to be more attention directed toward users’
evaluation of usability. In this way, it can provide
concrete prescriptions for developing more user-
centred e-government websites that can generate
greater users’ participation.
To this end, this study aims to evaluate the
usability of current e-government websites in the
UK, identifying existing usability problems.
Moreover, in order to fulfil a systematic evaluation,
based on the usability problems identified, this study
proposes a set of design solutions and evaluates the
effects of these proposed design solutions on the
identified usability problems. This approach
addresses design, evaluation and redesign processes
in e-government website development, which is also
reflected in user centred studies in HCI, where one
of the major tasks is with problem detection and
solutions provision to develop computer systems
(Kossak et al., 2001). To implement the usability
evaluation, an experimental study has been designed
based on users’ perception of Nielsen’s set of
usability heuristics to conduct a thorough and in-
depth e-government websites usability inspection. In
addition, in order to reveal users’ task performance
within the e-government websites evaluated, users’
performance is also measured by a number of
performance criteria through observation. By doing
so, a more comprehensive evaluation, which not
only provides an deep insight into e-government
website usability, but also show the levels of users’
interaction with the specific e-government website,
can be carried out.
The rest of the paper is structured as follows:
section 2 reviews the theoretical background to
indicate the importance of usability to e-government
websites. Section 3 describes the detailed design of
an empirical study with two linked experiments.
Section 4 presents and discusses the results from
experiment 1. Section 5 proposes the design
solutions in relation to the usability problems
identified. Section 6 shows the findings from
experiment 2. Conclusions and limitations are drawn
and future research suggested in section 7.
2 LITERATURE REVIEW
In consideration of a dynamic area of e-government
and its application for the general public, e-
government can be defined as the use of the Internet,
especially web technology as a tool to deliver
government information and services to users (Muir
and Oppenheim, 2002). The main purpose for e-
government is to achieve better government, which
enables easier access, richer information, higher
quality services and more enjoyable experience
(OECD, 2003). Furthermore, other advantages of e-
government include improving the level of public
services, increasing cost-effectiveness in services
provision (Følstad et al., 2004), promoting user
engagement and strengthening trust between
government and users (Wang et al., 2005). Since
such huge power has been recognized by traditional
governments, e-government initiatives are evolving
from the national to the local level, and developed
worldwide.Thousands of e-governments have now
been established which make government
information and services available online (Steyaert,
2004). Users can conduct all government services
provided by the national and local levels via
information presentation, interaction, transaction and
integration (Layne and Lee, 2001).
Although there is a rapid development of e-
government, a challenging target for e-government
of how best to interact with users still remains
(Kossak et al., 2001). Among the various reasons,
usability has been found to be an important reason
influencing users’ interaction and adoption of e-
government (Baker 2009). In essence, usability is a
very broad concept (Gillan and Bias, 2001). It can be
simply defined as effectiveness, efficiency and
satisfaction (ISO, 1998). However, in order to obtain
more comprehensive understanding, usability can be
explained by multiple criteria. For example, Flavián
et al. (2006) described five elements in relation to
usability, which are the perceived ease of
understanding the structure of a system, simplicity
of use of the website, the speed of locating the item,
the perceived ease of navigating the site and the
ability of the users to control their movement within
the system. Moreover, usability can be used as a
measurement related to how useful and user-friendly
the system is. As such, it is no doubt that usability is
a key factor in determining the computer system
quality (Karahoca et al., 2010) and ensuring users’
engagement (Sauer and Sonderegger 2009). For
example, Anthopoulos et al. (2006) applied
participatory design to discover user-oriented e-
government services. The study addresses the
importance of users’ needs in order to guide service
delivery improvement. Usability has been found to
be the determinant in consideration of users’
requirements, because if users failed to access and
execute the proper service due to usability errors,
their dissatisfaction increased. Such dissatisfaction
may prevent users’ return to an e-government
website, and even that users do not recommend their
use to others.
WEBIST 2011 - 7th International Conference on Web Information Systems and Technologies
174

Furthermore, usability has a significant impact
on users’ preference and attitude. Lee and Koubek
(2010) investigated the effects of usability and web
design attributes on user preference. The study
found that a high level of usability results in a high
level of user preference towards the website. In
particular, user preference was largely dependent
upon web attributes in terms of content arrangement,
navigation function, visual organisation, typography
and colour usage. Additionally, Casaló et al. (2008)
demonstrated that website usability not only has a
positive influence on user attitude, but also builds
user trust in the website loyalty formation process.
Similarly, Barnes and Vidgen (2004) observed
users’ interaction with an online government tax
self-assessment facility. The findings show that
users’ activities, such as online submission of self-
assessed tax returns and information seeking are
largely concerned with usability, navigation and site
communication. In order to generate greater users’
interaction, there is a need to not only understand the
usability requirements of users, but provide tailored
solutions to improve the usability of e-government
websites. These studies suggest that without
addressing usability in sufficient level in e-
government website design, e-government will not
be fully used and accepted by the widest range of
users. Accordingly, it is important to evaluate the
usability of current e-government websites, identify
existing problems and provide proposed design
solutions in order to further develop e-government
usability.
3 METHODOLOGY
Having established that that usability is an important
factor in e-government website development, an
empirical study was conducted with two linked
experiments. Experiment 1 aimed to evaluate
usability of a target e-government website.
Experiment 2 looked to examine the proposed
design solutions regarding the usability problems
found in experiment 1. To conduct both
experiments, three research instruments were used:
the task sheet, the heuristic-based usability
questionnaire and the selected e-government
website. The task sheet details a set of tasks for
participants to perform. A heuristic-based usability
questionnaire was developed to identify the
participants’ perception of usability. The e-
government websites were selected as representative
of e-government and used to evaluate its usability.
3.1 Task Design
To conduct the evaluation, the participants were
required to complete a set of practical tasks on an e-
government website. Such tasks are representative
activities that users would be expected to perform
with an e-government website. Based on relevant
studies (Shareef et al., 2011), there are two levels of
e-government services. The first level relates to the
publishing or static stage, which involves users’ one-
way communication, such as searching information,
downloading forms and publishing information. The
second level refers to the interaction stage, which
contains two-way communication, such as council
tax payment, online service registration and online
school application. According to these services
categories, the set of tasks have been designed to
represent different types of interaction that users
normally engage in with e-government (for details of
experiment 1 see Table 1). A similar set of tasks
were also developed for experiment 2. However, the
specific tasks content were different from the tasks
used in experiment 1 in order to avoid the influence
of experience from the participants’ performance in
experiment 1.
Table 1: e-Government practical tasks for London
Authority 1.
No. Task Ser. Category
1 Find the names of the councillors one-way
2 Find the news about £1.5 million for
new local authority housing
one-way service
3 Find the contact details of LA 1,
especially the telephone numbers
one-way service
4 Use the search engine on this site to
find how to join a local library
one-way service
5 Find the introduction information
about LA 1
one-way service
6 Use “A-Z services” to find the
parking tickets information
one-way service
7 Sign in the system, and fill in “an
online enquiry form” to query how to
get a student discount
two-way service
8 Fill in a “compliments form”
reporting no street lamp
two-way service
9 Please download the document of
council tax 2009/2010
one-way service
3.2 Usability Questionnaire
A heuristic-based questionnaire was used to measure
the participants’ perception of usability of the target
e-government website. The design of this
questionnaire is based on Nielsen’s set of usability
heuristics (1994). The questionnaire design consists
of three stages: extension of heuristics, development
criteria and usability questionnaire design.
ADDRESSING E-GOVERNMENT WEBSITE USABILITY - A Users' Centred Evaluation
175

3.2.1 Extension of Heuristics
Nielsen’s (1994) set of heuristics (see Table 2) is
used as a starting point for evaluating e-government
websites usability since a growing number of studies
have proven its validity and usefulness (e.g.
Hvannberg et al., 2007, Delice and Güngör, 2009).
However, such heuristics were developed many
years ago and used for general usability evaluation.
In order to fit with the particular requirements of e-
government websites, there is a need to derive
additional heuristics. Evidence from previous studies
indicates that where e-government is used by the
public, interoperability is important in terms of
information and service exchange (Garcia et al.,
2005); for example ensuring news is kept current
between e-government and government. In addition,
since e-government is used by diverse users who
have heterogeneous skills, therefore, e-government
should support and extend users with different skills
to access and complete services. Furthermore,
during users’ interaction with online services, e-
government should show respect for users at all
times (Reddick, 2005). Therefore, the existing
heuristics are extended by adding three new
heuristics: ‘Interoperability’, ‘Support users’ skills’
and ‘Respectful interaction with users’ (see Table 3).
Table 2: Nielsen’s usability heuristics (1994).
Heuristics Interpretation
H1 Visibility of
system status
To keep users informed about what
is going on.
H2 Match system
with real world
To follow real-world conventions.
H3 User control and
freedom
To make undo and redo functions
available during interaction.
H4 Consistency and
standards
To keep the same design feature
through the site.
H5 Error prevention To support users to overcome errors.
H6 Recognition
rather than recall
To make information easily
remember.
H7 Flexibility and
efficiency of use
To allow users to tailor frequent
actions.
H8 Aesthetic design To make minimalist design.
H9 Help user
recover errors
To indicate the problem and suggest
a solution.
H10 Help and
documentation
To provide help to support user’s
task completion.
Table 3: Extended heuristics.
Extended heuristics Interpretation
H11 Interoperability To make all elements work as a
whole for user task completion.
H12 Support users’
skills
To support users with different
knowledge and background.
H13 Respectful
interaction
To present pleased design and
treat users with respect.
3.2.2 Development Criteria
Although Nielsen’s set of usability heuristics is
extended, it is still too general to develop a
questionnaire to evaluate usability, so that e-
government website usability would be evaluated
with enough depth. Furthermore, the lack of detailed
analysis may lead to failure in specific usability
problem identification. Therefore, associated criteria
for each heuristic needs to be developed. Such
criteria are developed from relevant usability (e.g.
Sonderegger and Sauer, 2010) and e-government
studies (e.g. Baker, 2009). These studies reveal a
number of elements that affect website usability and
users’ perception. Based on the analysis of these
elements, relevant criteria are identified and grouped
into corresponding heuristics. By doing so, it can
provide a step-by-step approach to closely focus on
the specific usability aspects. In addition, relevant
questions can be precisely developed.
3.2.3 Usability Questionnaire Design
A usability questionnaire was designed for capturing
the participants’ perception of usability. The reasons
behind choosing a questionnaire are that it can drive
the participants directly to the research topics, which
enables the participants to clearly see the focus. In
addition, with an anonymous response style, it
encourages respondents to offer their truthful reply.
Furthermore, using a questionnaire can ensure that
the same questions are delivered to each participant
and their responses can be obtained quickly. In order
to capture users’ perception of usability before and
after the redesign and to control the variables to
support comparative analysis, the same
questionnaire is used for the participants in both
experiments 1 and 2.
3.3 e-Government Website Selection
Among a variety of e-government websites, a local
e-government website in the UK is selected in this
study for a number of reasons. Firstly, the local level
of e-government website is the closest level to users.
Secondly, local e-government websites are
frequently used by the general public, since local e-
government provides more information and focuses
on the needs of users in accessing information and
services (Reddick, 2009). Thirdly, the local level of
e-government can significantly indicate the effect of
e-government on users (Tolbert and Mossberger,
2003). Fourthly, previous studies show the big
challenges at the local level of e-governments (Yang
and Paul, 2005) and its website design (Henriksson
WEBIST 2011 - 7th International Conference on Web Information Systems and Technologies
176

et al., 2007). Thus, the local e-government website
(London Authority 1) is used in this study. This
London Authority 1 contains rich information and
provides a variety of government services available
on the site.
3.4 Participants
To conduct heuristic evaluation, Nielsen and Molich
(1990) found that three participants can detect half
of the major problems. Furthermore, Virzi (1992)
suggested that 80% problems can be identified with
between 4 and 5 participants and 90% of problems
can be found with 10 participants in usability
evaluation. Moreover, Dumas and Redish (1999)
argued that additional participants are less and less
likely to reveal new problems and pointed out that
the most appropriate number of participants is
between 6 and 12. As such, 12 participants were
recruited to take part in the evaluation, participating
in both experiments 1 and 2. These participants were
recruited in public places, such as local libraries,
leisure centres, universities, and found to be
enthusiastic to do the evaluation. The participants
found in public places can be assumed to be
representative of the public and that they do
normally use an e-government website.
3.5 Experimental Evaluation
Procedure
In both experiments, each participant follows the
same evaluation process: free-flow inspection, task-
based interaction and usability questionnaire. Free-
flow inspection allows users to freely look through
the e-government website many times. They can
focus on either the overall website or the specific
website elements. As such, users can build their
initial interaction with the e-government website and
their general perception can be developed. Then,
task-based interaction requires the participants to
complete a set of tasks. While the participants
perform these tasks, their performance was observed
according to a number of performance criteria,
including the amount of online help required; time
spent completing tasks; number of steps to finish
tasks and number of successful tasks completed.
Having completed all tasks, the participants are
asked to fill in the usability questionnaire to indicate
their judgment of usability of the target e-
government website.
4 RESULTS OF EXPERIMENT 1
As indicated, the aim of experiment 1 is to evaluate
usability of the target e-government website. The
following section presents the results in terms of
users’ perception and performance. The former uses
the results from the questionnaires to indicate
usability assessment, while, the latter is measured by
a set of performance criteria to indicate the level of
users’ interaction with the target e-government
website. To conduct data analysis, the one-sample T-
test is considered as an appropriate technique for
experiment 1. More specifically, the one-sample T-
test is applied to determine whether there is a
significant difference between users’ perception of
overall usability and specific usability features. If a
difference is indicated, then the mean score of the
specific usability features is greater than the mean
score of the overall usability features and these can
be seen as ‘usability strengths’. Similarly, where the
mean score of the specific usability features is less
than mean score for the overall usability features,
then these usability elements have been selected as
the ‘usability problems’. In addition, a lower mean
score indicates a more serious problem. Statistical
analysis of the data is conducted using SPSS for
windows (version 13). The significance value is
defined as less than 0.05.
4.1 User’ Perception
Generally, the target e-government website appears
to be clear and fairly straightforward, and it is easy
to operate the e-government website. Each page
always follows the same display format, which is
helpful to build website consistency. The site’s
functionality supports users to complete most tasks.
A title on every page clearly indicates the subject of
the content, so that users can quickly capture the
subject information of the page and locate
information to meet their needs. Moreover, key
information is always placed in a central location on
the page, which can support users quickly searching
for information. Furthermore, it is quick to change
the particular data in a previous section so users do
not need to retype all the data when they go back. In
addition, forward and backward choices are always
available within the different fields of the site, so
that users can easily guide their movement in
information searching.
However, the results obtained from the
questionnaires also indicate a number of usability
problems (see Table 4). Among them, the most
serious usability problem found is that users are
ADDRESSING E-GOVERNMENT WEBSITE USABILITY - A Users' Centred Evaluation
177

confused by links that have many different colours.
Link colour is used to present different resources
within the site. Links with limited colours can
visually help users distinguish between the
resources, so as to easily identify relevant subject
information. As indicated by Kappel et al. (2006),
users with limited colour vision can quickly
recognise the differences among subjects. In
contrast, failure to provide limited link colours can
visually influence resource recognition, so that users
may feel it difficult to locate target information
among subject content.
Table 4: User’ perception of usability problems.
Usability problems Mean (SD)
Confusion by links that have
many different colours.
2.58 (0.669)
Significance T=-6.511, P=0.000
Subject categories are presented
without a logical order.
2.83 (1.030)
Significance T=-3.386, P=0.006
Links already visited are not
clearly marked.
2.92 (1.084)
Significance T=-2.952, P=0.013
Information is unbalanced
between breadth and depth.
3.00 (0.853)
Significance T=-3.412, P=0.006
(SD=Std. deviation)
The next usability problem is that subject
categories are presented without a logical order. A
logical order is used to indicate a sequence of
information organization, which supports users
having a sensible way to scan subject. It assists
users’ understanding of the overall subject
arrangement and reduces memory load problems.
Brinck et al. (2002) suggested that when topics are
arranged with a particular order, users are able to
easily locate items; remember items of interest
viewed previously. On the contrary, when subject
categories are presented without a logical order,
users may feel it is difficult to find target subjects
among the categories.
Furthermore, the usability problem found is that
links already visited are not clearly marked. Marking
visited links is used to support users’ ability to
distinguish which parts of the site they have already
visited and which parts remain to be explored. As
such, it can help users to locate information during
information searching. As indicated by Nielsen
(2000), visited links that have been clearly marked
can provide a sense of structure and location in the
site and enable users to quickly find the subject
information. However, failure to mark visited links
can weaken navigational recognition, which results
in users visiting the same place repeatedly, or even
abandoning searching purpose prematurely.
Finally, a usability problem found is that the
information arrangement is out of balance between
breadth and depth. Breadth and depth are used to
distribute e-government content by designing a
number of subject categories and a number of
information levels. A medium condition of breadth
and depth is considered as an optimal trade-off,
which can help information retrieval (Larson and
Czerwinski, 1998). It is because the appropriate
number of categories displayed can keep content
from getting cluttered and reduce the chance that
users are confused by a vast number of options.
While, as the moderate levels of information is
designed, it can avoid over-length subject
information through the site so that users can follow
a short path into the site in order to find the detailed
information. However, as suggested by Larson and
Czerwinski (1998), unbalanced breadth and depth
can cause problems in information acquisition. In
such conditions, users are frustrated by increasing
levels of depth or feeling lost in content space, when
there are a large numbers of categories. As such, the
problem that information arrangement is out of the
balance between breadth and depth in London
Authority 1 may cause more difficulties and errors
for users searching for available information
resources on a page and locating detailed
information through multiple information levels.
4.2 Users’ Performance
Having provided the participants’ perception of
usability, in order to indicate the level of the
participants’ interaction with the e-government
website, users’ performance is measured based on a
set of performance data, including the amount of
online help required; average time spent completing
all tasks; average number of steps to finish tasks and
ratio of successful tasks completed. More
importantly, this performance measurement in
experiment 1 will be used as the baseline to compare
users’ performance in experiment 2. Table 5
presents the participants’ performance with the
target e-government website. Overall, all
participants are able to complete most of the tasks
assigned. In addition, during their performance, the
participants’ required some assistance through
online help information. The time spent and the
steps used for completing all tasks are 16.209
(minutes) and 50.167 (number of steps) with
standard deviation of 8.102 and 16.297 respectively.
WEBIST 2011 - 7th International Conference on Web Information Systems and Technologies
178
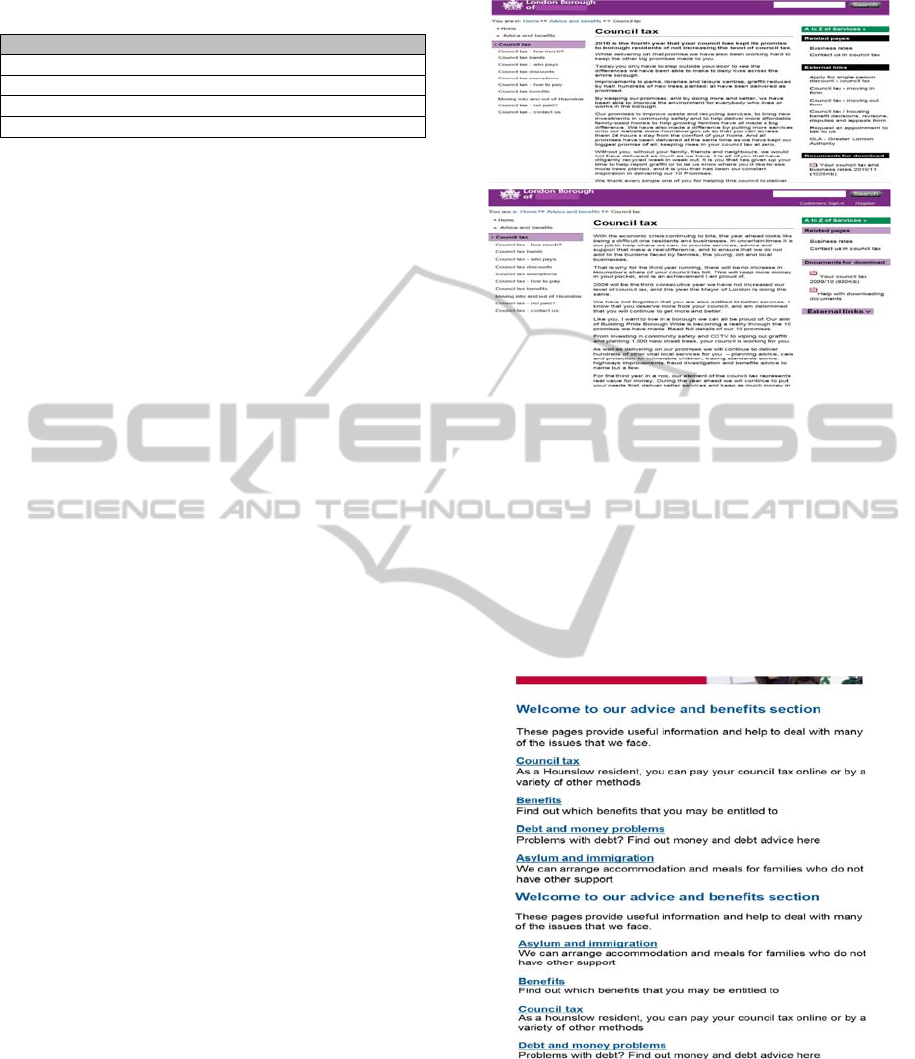
Table 5: Experiment 1: users’ performance results.
Mean Std. Deviation
Online helps required 0.000 0.000
Steps used 50.167 16.297
Successful tasks completion 1.065 0.088
Time spent for all tasks 16.209 8.102
5 DESIGN OF THE PROPOSED
SOLUTIONS
The findings in experiment 1 indicate a number of
usability problems that have been identified in the
target e-government website. These problems
suggest that usability has not been considered in
sufficient detail in e-government website design. For
an e-government to be accepted and used by the
widest range of users, the e-government website
should improve its usability to support users’
interaction with e-government. As indicated by
Garcia et al. (2005), improving usability of e-
government can enhance service effectiveness and
users’ satisfaction, which may involve more users’
participation. As such, it is important to develop
more usable e-government websites that can meet
different users’ requirements. In this vein, this study
takes further action by providing the proposed
design solutions in relation to the usability problems
found in experiment 1.
Usability problem 1 (UP1): Users are confused with
links that have many different colours
A limited number of link colours can visually help
users to distinguish resource differences so as to
easily identify relevant subject information.
Conversely, links with many different colours
hamper resource recognition, which may result in
users’ difficulty with information identification. As
such, designers of e-government websites should
consider applying the minimum number of link
colours, thereby supporting users’ subject
recognition during information seeking. One
proposed design solution is to reduce link colours
used in London Authority 1. In this way, it may
reduce users colour visual confusion and visually
support users when locating information objects.
Figure 1a presents an example of links that have
many different colours in London Authority 1.
Whereas, Figure 1b shows that some link colours are
reduced in the redesigned London Authority 1
website.
a)
b)
Figure 1: UP 1 and the Proposed Design Solution.
Usability problem 2 (UP2): Subject categories are
presented without a logical order
A logical order is used to show a sequence of
information arrangement, which helps users quickly
scan subject information to identify objects and
reduce memory load problems. Similarly, failure to
present subject categories with a logical order
hinders information arrangement, which may lead to
complexity of information seeking.
a)
b)
Figure 2: UP 2 and the Proposed Design Solution.
Accordingly, designers of e-government websites
should consider organising subject categories in a
particular order in order to support users identifying
a sensible way to scan subject information. One
proposed design solution is to arrange subject
categories in an alphabetical order on each page of
ADDRESSING E-GOVERNMENT WEBSITE USABILITY - A Users' Centred Evaluation
179
London Authority 1. In this way, users may quickly
understand the overall subject arrangement and
easily identify relevant information to meet their
needs. Figure 2a shows that initially, the subject
categories are randomly presented on London
Authority 1. However, Figure 2b indicates an
example of the subject categories that are organised
and presented in an alphabetical order.
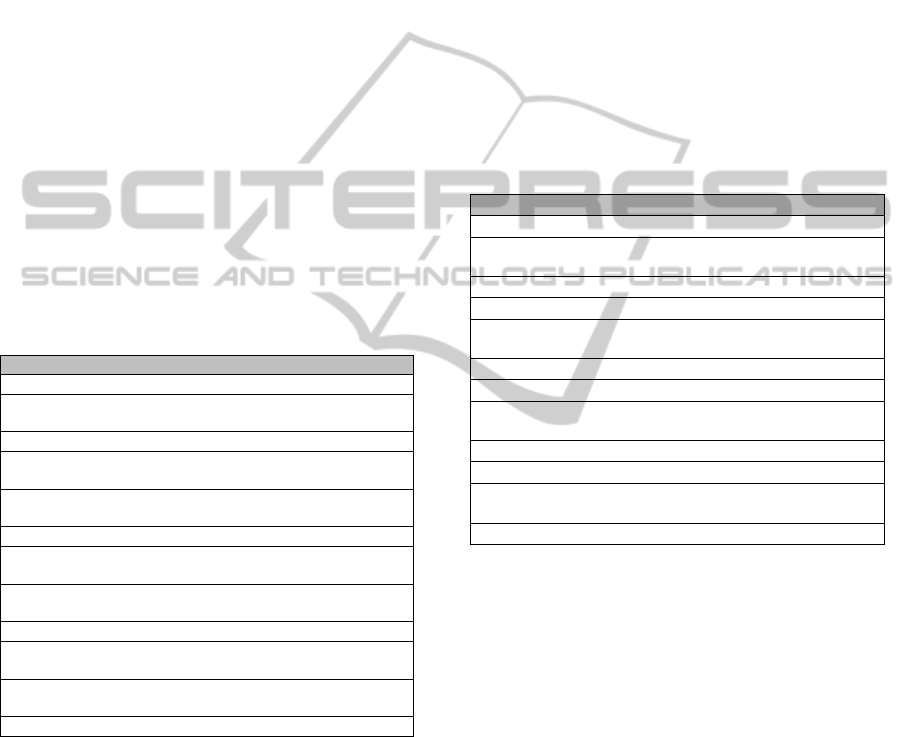
Usability problem3 (UP3): Links already visited are
not clearly marked
Marking visited links is used to indicate which parts
of the site users have already visited and which parts
remain to be explored. It can help users build the
sense of structure and location in the site, and
navigate them quickly to their target information.
However, when visited links are not clearly marked,
it weakens the site’s navigational recognition, so that
users may very likely visit the same page repeatedly
and have difficulty locating information. Therefore,
designers of e-government websites should consider
providing an approach that will help users recognise
the unvisited and visited links within the site during
the information seeking process. One proposed
design solution is to mark visited links in italics
within London Authority 1. As shown in Figure 3a,
initially, the visited links in London Authority 1
have not been clearly marked. However, Figure 3b
shows that the visited links are clearly marked in
italics on the site.
a)
b)
Figure 3: UP 3 and the Proposed Design Solution.
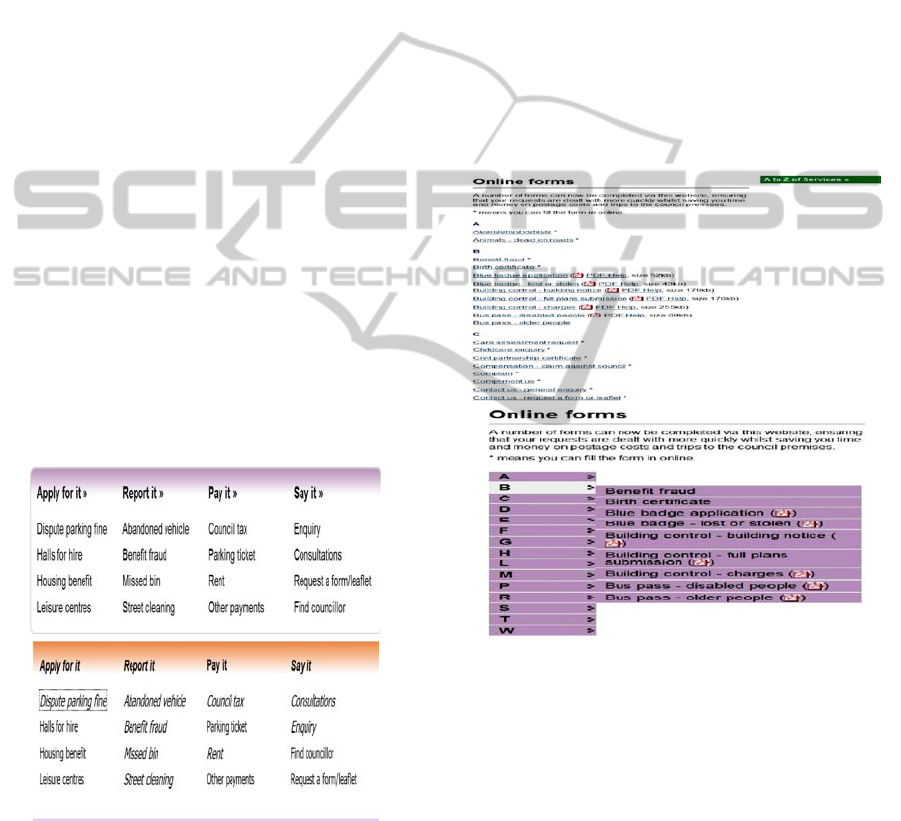
Usability 4 (UP4): Users get lost due to being given
too many choices during information seeking
An appropriate number of options can be used to
keep content from getting cluttered and reduce the
chance that users are confused by a large number of
choices. Hence, it helps information retrieval. On the
contrary, an excessive number of choices may cause
difficulty in information acquisition (Nielsen, 2000),
so that users may feel frustration when searching for
information in a particular content space. Therefore,
designers of e-government websites should consider
providing an approach that will allow users to feel
comfortable with the number of subject options. One
proposed design solution is to design a drop-down
menu for each subject category that visually hides its
sub options. When users move the mouse to the
subject category, a type of stretch sub list is used to
present the various sub options associated with this
subject category. In this way, the number of choices
is visually reduced on the page, which is not only
helpful in preventing content from getting cluttered,
but also beneficial for users to read and locate
information (see Figure 4a and 4b).
a)
b)
Figure 4: UP 4 and the Proposed Design Solution.
6 RESULTS OF EXPERIMENT 2
Have provided the design solutions above, to
investigate the effects of the proposed design
solutions on the usability problems found,
experiment 2 is conducted. This section provides the
results of experiment 2 in terms of users’ perception
and performance. In order to control the variables
under the same conditions between experiments 1
and 2, the same research instruments used in
experiment 1 are used in experiment 2; including the
questionnaire, the task sheet, the participants and the
procedure. However, in order to avoid the
WEBIST 2011 - 7th International Conference on Web Information Systems and Technologies
180
participants learning from their experience with
experiment 1, the tasks designed for experiment 2
focus on different service activities, but remain the
same type of tasks as used in experiment 1. The
results obtained from the participants’ perception
and performance is analysed by using a paired-
sample T-test.
6.1 Users’ Perception
Table 6 reveals users’ perception in experiment 2.
Regarding the specific usability feature of links
having many different colours, and subcategories not
being present with a logical order, a significant
difference is found between experiments 1 and 2.
However, although no significant difference is
indicated between experiments 1 and 2 with respect
to the usability problems of visited links not being
clearly marked and many choices being given during
information seeking, the results still show that the
participants’ assessments are influenced after the
design solutions have been applied to the redesigned
London Authority 1.
Table 6: Experiment 2: user’ perception results.
Experiment 1 Experiment 2
Confusion with links that have many different colours.
Mean 2.58 4.33
Std. Deviation 0.669 0.492
Significance T= -8.042, P=0.000
Difficult to choose the option in subcategories because no
logical order of sub options is used in subcategories.
Mean 2.83 4.17
Std. Deviation 1.030 0.577
Significance T= -4.000, P=0.002
It clearly indicates which choices/links are already visited
because they have been marked.
Mean 2.92 3.58
Std. Deviation 1.084 1.165
Significance T= -1.685, P=0.120
I sometimes get lost due to being given too many choices
over sequences.
Mean 3.00 3.75
Std. Deviation 0.853 1.215
Significance T= -1.567, P=0.145
In other words, for each specific usability feature,
the participants’ assessment is significantly changed
in experiment 2. As indicated earlier, the proposed
design solutions have been applied to the target e-
government website in experiment 2. The results
show that the usability problems perceived in
experiment 1 have been improved in the redesigned
e-government website. Therefore, the findings
suggest that the proposed design solutions have
improved the usability problems identified in
experiment 1. In addition, it increases overall users’
perception of usability of London Authority 1.
6.2 Users’ Performance
Given that the usability problems have been
improved by the proposed design solutions in the
redesigned London Authority 1, and in order to
reveal the level of users’ interaction with the
redesigned London Authority 1, users’ performance
in experiment 2 is also measured based on the same
performance criteria used in experiment 1. By
focusing on such criteria, it comparatively analyses
performance results before and after the proposed
design solutions have been applied in experiments 1
and 2 respectively. The detailed results are presented
in the following subsections.
Table 7: Experiment 2: users’ performance results.
Experiment 1 Experiment 2
Total time spent completing tasks
Mean 16.209 10.009
Std. Deviation 8.102 2.334
Significance T=2.523, P=0.028
Number of steps to finish tasks
Mean 50.167 40.333
Std. Deviation 16.297 4.1141
Significance T=2.046, P=0.045
The amount of online help required
Mean 0.000 0.000
Std. Deviation 0.000 0.000
Significance T= N/A, P= N/A
Successful tasks completion
Mean 1.065 1.000
Std. Deviation 0.088 0.000
Significance T= N/A, P= N/A
Table 7 shows the participants’ performance in
experiments 1 and 2. As indicated in Table 7, the
results of the Paired-Samples T-test reveals a
significant difference in terms of the time spent
completing all tasks between experiments 1 and 2
(T=2.523, P=0.028). More specifically, the
participants in experiment 2 use less time to
complete all tasks, compared with experiment 1.
In addition, a significant difference in terms of
steps used for all tasks completion is found between
experiments 1 and 2 (T=2.046, P=0.045). In detail,
the participants in experiment 2 take fewer steps to
finish all the tasks than those who are in experiment
1.
The results of Paired-Samples T-test show that
the difference in terms of number of online help
actions required for all tasks completion is not
significantly different between experiments 1 and 2.
However, according to the mean score, it emerges
that the participants in experiment 2 required less
ADDRESSING E-GOVERNMENT WEBSITE USABILITY - A Users' Centred Evaluation
181

online help to complete all the tasks compared with
experiment 1. Similarly, although the difference in
terms of number of successful tasks completion is
not significant between experiments 1 and 2, the
mean score also indicate that the participants finish
more tasks in experiment 2 than experiment 1.
Based on the performance results, it seems that
the participants’ performance with the redesigned
London Authority 1 is significantly enhanced in
experiment 2. These are also reflected in the results
of users’ perception, which reveal that the proposed
designed solutions on the redesigned London
Authority 1 have improved the usability problems
identified in experiment 1. A possible explanation is
that since the proposed design solutions have
improved the usability problems, it increases the
overall users’ perception of usability, which in turn,
makes for better users’ performance. This is also
supported by previous studies (e.g. Amoako-
Gyampah, 2007; Baker, 2009), which suggested that
the overall users’ perception of usefulness and ease
of use has positively influenced users’ performance
and intention to use the technology.
7 CONCLUSIONS
This study has evaluated the usability of one existing
UK e-government website, which uncovered a
number of usability problems. This suggests that this
e-government website has much room to improve its
usability. As such, this study offers and assesses a
set of proposed design solutions regarding the
usability problems found for the target e-government
website. The results show that the proposed design
solutions have improved the usability problems
identified. More significantly, after the proposed
design solutions have been implemented in the
redesigned e-government website, users’ task
performance has been also significantly improved.
Accordingly, it suggests that the proposed design
solutions may improve the overall users’ perception
of usability of the target e-government website,
which makes for better users’ performance.
Therefore, it is important to show that usability of e-
government websites meet users’ needs, so that
users’ interaction with e-governments may be
promoted. To achieve this goal, this study conducts
a user centred approach, which can help understand
the usability requirements of users. In addition, this
study combines usability evaluation and redesign of
an e-government website, which provides guidance
for designers to identify existing usability problems
and offer specific prescriptions for further usability
improvement of e-government websites. The final
target is to develop more usable e-government that
can generate greater users’ participation in e-
government.
However, there are also some limitations in this
study. For example, this study only evaluates one e-
government website, as an example. Further
research may be conducted with more distributed e-
government websites in the UK. Another limitation
relates to the redesigned e-government website in
experiment 2. The redesigned e-government website
is based on the target e-government website used in
experiment 1, keeping the same structure, layout and
content. However, the redesigned e-government
website does not include all the website pages from
the target e-government website. This may influence
users’ general perception when they conduct a free-
flow inspection. In addition, this study applies a set
of extended heuristics to evaluate usability of current
e-government websites. In order to support
designers’ usability knowledge and skills for e-
government development, there is also a need to
conduct future study to develop usability guidelines
that contain detailed usability design features,
specifically for the development of better e-
government websites.
REFERENCES
Amoako-Gyampah, K., 2007. Perceived usefulness, user
involvement and behavioural intention: an empirical
study of ERP implementation, Computer in Human
Behavior, 23, 1232-1248.
Anthopoulos, L. G., Siozos, P., Tsoukalas, I. A. 2006.
Applying participatory design and collaboration in
digital public services for discovering and re-designing
e-government services, Government Information
Quarterly, 24(2), 353-376.
Barker, D. L. 2009. Advancing e-government performance
in the United States through enhanced usability
benchmarks, Government Information Quarterly, 26,
82-88.
Barnes, S. J., Vidgen, R., 2004. Interactive e-government
services: modelling user perceptions with eQual,
Electronic Government, 1(2), 213-228.
Brinck, T., Gergle, D., Wood, S. D. 2002. Usability for the
web: designing web site that work, Morgan Kaufmann
Publishers, San Francisco, CA.
Brown, M. M. 2003. Digital government innovation,
School of Government, University of North Carolina
at Chapel Hill, Retrieved from
http://ncinfo.iog.unc.edu/pubs/electronicversions/pdfs/
dgib0301.pdf.
Casaló, L., Flavián, C., Guinalíu, M. 2008. The role of
perceived usability, reputation, satisfaction and
consumer familiarity on the website loyalty formation
WEBIST 2011 - 7th International Conference on Web Information Systems and Technologies
182

process, Computers in Human Behavior, 24(2), 325-
345.
Delice, E., Güngör, Z., 2009. The usability analysis with
heuristic evaluation and analytic hierarchy process,
International Journal of Industrial Ergonomics, 39(6),
934-939.
Donker-Kuijer, M. W., Jong, M., Lentz, L. 2010. Usable
guidelines for usable websites? an analysis of five e-
government heuristics, Government Information
Quarterly, 27, 254-263.
Dumas, J. S., Redish, J. C., 1999. A practical Guide to
usability testing, Intellect Ltd, USA.
Flavián, C., Guinalĭu, M., Gurrea, R. 2006. The role
played by perceived usability, satisfaction and
consumer trust on website loyalty, Information and
Management, 43, 1-14.
Følstad, A., Jørgensen, H. D., Krogstie, J., 2004. User
involvement in e-government development projects,
Nordic Conference on Human-Computer Interaction,
82, 217 - 224.
Garcia, A. C. B., Maciel, C., Pinto, F. B. 2005. A quality
inspection method to evaluate e-government sites,
Lecture Notes in Computer Science, 3591, 198-209.
Gillan, D. J., Bias, R. G. 2001 usability science I:
foundations, International Journal of Human
Computer Interaction, 13(4), 351-372.
Henriksson, A., Yi, Y., Frost, B., Middleton, M., 2007.
Evaluation instrument for e-government websites,
International Journal of Electronic Government, 4(2),
204-226.
Holden, S. H., Norris, D. F., Fletcher, P. D. 2003.
Electronic government at the local level: progress to
date and future issue, Public Performance and
Management Review, 26(4), 325-344.
Hvannberg, E. T., Law, E. L., Larusdottir, M. K., 2007.
Heuristic evaluation: comparing ways of finding and
reporting usability problems, Interacting with
Computers, 19(2), 225-240.
ISO 9241-11, 1998. Ergonomic requirements for office
work with visual display terminals part II: guidance on
usability, International Organization for
Standardization.
Jaeger, P. T. 2003. The endless wire: e-government as
global phenomenon, Government Information
Quarterly, 20(4), 323-331.
Karahoca, A., Bayraktar, E., Tatoglu, E., Karahoca, D.
2010. Information system design for a hospital
emergency department: a usability analysis of software
prototypes, Journal of Biomedical Informatics, 43,
224-232.
Kappel, G., Pröll, B., Reich, S., Retschitzegger, W. 2006.
Web engineering, the discipline of systematic develop-
ment of web applications, John Wiley & Sons.
Kossak, F., Essmayr, W., Winiwarter, W., 2001.
Applicability of HCI research to e-government, 9th
European Conference on Information Systems, 957-
968.
Larson, K., Czerwinski, M. 1998. Web page design:
implications of memory, structure and scent for
information retrieval, Proceedings of CHI’ 98
Conference on Human Factors in Computing Systems,
25-32.
Layne, K., Lee, J. 2001. Developing fully functional e-
government: a four stage model, Government
Information Quarterly, 18, 126-136.
Lee, S., Koubek, R. J., 2010. The effects of usability and
web design attributes on user preference for e-
commerce web sites, Computers in Industry, In Press,
Corrected Proof.
Muir, A., Oppenheim, C. 2002. National Information
policy developments worldwide in electronic
government, Journal of Information Science, 28(3),
173-186.
Nielsen, J., Molich, R., 1990. Heuristic evaluation of user
interface, Proceedings of the ACM CHI’92, 249-256.
Nielsen, J., 1994. Heuristic evaluation: usability inspection
methods, New York.
Nielsen, J. 2000. Deigning web usability: the practice of
simplicity, New Riders Publishing, Indiana, USA.
OECD 2003. OECD E-Government Studies: the e-
government imperative, OECD, Paris.
Reddick, C. G., 2005. Citizen interaction with e-
government: From the streets to servers?, Government
Information Quarterly, 22(1), 38-57.
Reddick, C. G. 2009. The adoption of centralized
customer service systems: a survey of local
governments, Government Information Quarterly,
26(1), 219-226.
Sauer, J., Sonderegger, A. 2009. The influence of
prototype fidelity and aesthetics of design in usability
tests: effects on users behaviour, subjective evaluation
and emotion, Applied Ergonomics, 40, 670-677.
Shareef, M. A., Kumar, V., Kumar, U., Dwivedi, Y. K.
2011. E-government adoption model (GAM): differing
service maturity levels, Government Information
Quarterly, 28, 17-35.
Sonderegger, A., Sauer, J., 2010. The influence of design
aesthetics in usability testing: effects on user
performance and perceived usability, Applied
Ergonomics, 41, 403-410.
Steyaert, J. C., 2004. Measuring the performance of
electronic government services, Information and
Management, 41(3), 369-375.
Tolbert, C., Mossberger, K., 2003. The effects of e-
government on trust and confidence in government,
Proceedings of the 2003 Annual National Conference
on Digital Government Research, Digital Government
Research Center, 1-7.
Virzi, R., 1992. Refining the test phase of usability
evaluation: how many subjects is enough? Human
factors, 24, 457-468.
Wang, L., Bretschneider, S., Gant, J., 2005 Evaluating
web-based e-government services with a citizen-
centric approach, Proceedings of the 38th Annual
Hawaii International Conference on System Sciences,
5, 129-139.
Yang, J. Q., Paul, S., 2005. e-Government application at
local level: issues and challenges: an empirical study,
International Journal of Electronic Government, 2(1),
56-76.
ADDRESSING E-GOVERNMENT WEBSITE USABILITY - A Users' Centred Evaluation
183
