
An Automated Tool for the Detection of
Electrocardiographic Diagnostic Features based on
Spatial Aggregation and Computational Geometry
Liliana Ironi and Stefania Tentoni
IMATI - CNR, via Ferrata 1, 27100 Pavia, Italy
Abstract. In this work we focus on Electrocardiographic diagnosis based on epi-
cardial activation fields. The identification, within an activation map, of specific
patterns that are known to characterize classes of pathologies provides an impor-
tant support to the diagnosis of rhythm disturbances that can be missed by rou-
tine low resolution ECGs. Through an approach grounded on the integration of
a Spatial Aggregation (SA) method with concepts borrowed from Computational
Geometry, we propose a computational framework to automatically extract, from
input epicardial activation data, a few basic features that characterize the wave-
front propagation, as well as a more specific set of diagnostic features that identify
an important class of rhythm pathologies due to block of conduction.
1 Introduction
One of the most important application domains where imaging has proved extremely
useful is Medical Diagnosis. The process of identifying a pathological condition can be
greatly supported by signs of deviations from normality that can be drawn from images.
Within this context the term “imaging” usually refers to techniques to build images of
anatomical districts of the human body (e.g. radiographies, CAT, NMR); more broadly,
it can include methods that provide graphical representations of spatially referenced
variables related to specific organ functions (e.g. EEG, ECG signals, activation maps),
and in this case the term “functional” imaging is more appropriate.
Many functional images are graphical representations of a physical field: a potential
contour map, for instance, is the spatial representation of a potential field. Thereby, the
task of analyzing such images is not adequately tackled by traditional Image Process-
ing methods, which have been designed for raster images. The issue of unveiling the
salient physical events underlying a functional image is more appropriately and effec-
tively addressed through feature extraction methods that can exploit the domain-specific
knowledge at different abstraction levels. Such an issue is particularly relevant in view
of performing explanation and automated reasoning tasks.
Within the field of Qualitative Spatial Reasoning, Spatial Aggregation (SA) [1] pro-
vides an appropriate conceptual framework for feature extraction at multiple levels,
according to a powerful hierarchical abstraction strategy. In the direction of making
the approach more robust and integrating, within the basic SA framework, methods
Ironi L. and Tentoni S..
An Automated Tool for the Detection of Electrocardiographic Diagnostic Features based on Spatial Aggregation and Computational Geometry.
DOI: 10.5220/0003197500030012
In Proceedings of the 2nd International Workshop on Medical Image Analysis and Description for Diagnosis Systems (MIAD-2011), pages 3-12
ISBN: 978-989-8425-38-6
Copyright
c
2011 SCITEPRESS (Science and Technology Publications, Lda.)

from quantitative research fields, several works have contributed to make it an attrac-
tive framework for the development of functional imaging tools [2, 3]. Any such tool
would ground on domain-specific knowledge, as the inference mechanisms rely on a
network of relations that, besides dealing with spatial properties, explicitly encode such
knowledge.
This work contributes to the on-going research effort aimed at delivering novel tools
to support the assessment of the electric cardiac function. Diagnosing the cardiac elec-
tric function has always been a hard task for the difficulty met in the identification of
salient electrical events and their spatial association with specific epicardial sites. In
the clinical context, diagnosis of conduction pathologies is still carried out on the ECG
signals. Several tools exist for automated ECG segmentation and classification, most of
which are based on the integration of wavelet transforms with neural/fuzzy-neural net-
works, to deal respectively with the signal decomposition and classification tasks (see
for example [5]). Within AI, Qualitative Reasoning has also played an important role in
providing a number of automated ECG interpretation tools [6–8]. Unfortunately some
important rhythm disturbances may be incorrectly located or missed by routine ECGs.
Even body surface high resolution mapping may fail because signs of cardiac electrical
events on the torso surface are weak.
In recent years, model-based numerical inverse procedures have made it possible
to obtain non-invasively the epicardial activation field from body surface data. That
has engaged researchers in the effort towards novel methods for electrocardiographic
imaging [9, 10]. However, the interpretative rationale for cardiac maps is only partially
defined, and the ability to abstract the most salient visual features from a map and relate
them to the complex underlying phenomena still belongs to few experts. Due to the ex-
treme complexity of the physical system the task of automating diagnosis of conduction
disturbances from a 2D/3D activation field is therefore hard, and necessarily limited to
the current interpretation rationale. Within this field functional image-based diagnosis
is at its beginning, and, in accordance with the available rationale, currently regards
only a few classes of conduction disturbances. The potential of Qualitative Spatial Rea-
soning in contributing to its development is high: a tool for the automated extraction
of spatially referenced features of the cardiac electrical function would bridge the gap
between established research outcomes and clinical practice.
To detect salient spatiotemporal features in the epicardial activation field, we ex-
ploit the inference mechanisms provided by a computational tool grounded on Spatial
Aggregation and on Computational Geometry concepts: from a given numeric field we
extract spatial objects that, at different abstraction levels, qualitatively characterize spa-
tiotemporal phenomena, and discover and abstract patterns diagnostically relevant.We
focus on epicardial activation maps, which convey information about the heart elec-
tric function in terms of the depolarization wavefront kinematics and are very useful to
diagnose rhythm disturbances. We describe how to abstract, from the given activation
data, such basic propagation features as the sites where the wavefront breaks through
and where it terminates, or its qualitative velocity patterns, and we define a set of dis-
tinctive features that identify an important class of rhythm disturbances due to blocks
of conduction.
4

2 Feature Abstraction from a Numeric Field
The comprehension of physical phenomena benefits from the visualization of the spatial
course of relevant variables. A visual representation obtained from a given numeric
field can be further inspected, and searched for homogeneities and specific patterns that
have a physical meaning. This “imagistic” reasoning activity, that goes beyond mere
visualization, is performed at multiple levels through a sequence of abstractions and
manipulations of spatial objects that capture key physical properties.
2.1 Spatial Aggregation
Spatial Aggregation (SA) is a general-purpose framework that provides a suitable
ground to capture spatiotemporal adjacencies at multiple scales in spatially distributed
data. It was designed to derive and manipulate qualitative spatial representations that
abstract important features of the underlying data, for their use in automated reasoning
tasks [1–3]. In outline, SA transforms a numeric input field into a multi-layered sym-
bolic description of the structure and behavior of the physical variables associated with
it. This results from iterating transformations of lower-level objects into more abstract
ones through the exploitation of qualitative equivalence properties shared by neighbor
objects.
SA abstraction mechanisms are based on three main steps, namely
Aggregation
,
Classification
, and
Redescription
, that exploit domain-specific knowledge and spatial
adjacencies (see Fig.1):
1.
Aggregation.
Spatial adjacency of low-level objects is encoded within a neighbor-
hood graph.
2.
Classification.
Neighbor objects are grouped by similarity, according to a domain-
specific equivalence predicate that defines a feature of interest.
3.
Redescription.
Similarity classes are singled out as new high-level objects that pro-
vide an abstract representation of the feature.
objects graph
field primitive equivalence
aggregation classification
redescription
objects
new higher-level
neighborhood
classes
Fig.1. Basic inference steps in Spatial Aggregation.
Step 1 mostly exploits geometrical properties, either metrical or topological. Its
robustness is ensured by taking into account also the available non-geometrical knowl-
edge, associated with the objects to be aggregated and related to the physical context
[2]. Step 3 is crucial in that a non-effectual redescription of new objects may jeopardize
subsequent abstractions stemming therefrom. Such steps are iterated over and over until
the behavioral and structural information about the underlying physical phenomenon,
required to perform a specific task, is extracted from the data set. The hierarchical struc-
ture of the whole set of the so-built objects defines a bi-directional mapping between
5

higher and lower-level aggregates, and, consequently, it facilitates the identification of
the pieces of information relevant for a specific task.
2.2 The Role of Computational Geometry
Within the SA abstraction mechanism,
Redescription
instantiates visual features that
play a role in the spatial reasoning process. The geometric representation of new objects
must convey a meaningful effectual visual synthesis of the underlying similarity class.
Computational Geometry methods and concepts play an important role in providing
algorithms for the redescription of newly abstracted objects.
An important class of objects whose representation particularly needs to suit the rea-
soning task is that of 2D bounded regions. These latter can result, for example, from the
application of a similarity relation grounded on interval values to a set of contiguous
isopoints. The similarity classes correspond to regions that need to be instantiated as
new geometrical objects for further treatment. In many situations the qualitative topo-
logical structure of the region needs to be captured at multiple scales.
The choice of the most appropriate format and scale for the redescribed object is
always task-driven. For qualitative reasoning tasks, a region descriptor should be:
i) robust and stable with respect to noise and small perturbations of the region bound-
ary,
ii) capable to roughly capture the location and global extent of the region,
iii) capable to capture the topological structure of the region at an appropriate scale of
details with respect to the task, and of course
iv) computationally feasible.
An effectual representation of a region can be provided by its “gross skeleton”, as
defined in the following. The concept of gross skeleton is derived from the “medial
axis”, which is geometrically defined as the locus of the centers of circles that are inter-
nally tangent to the region’s boundary. The medial axis is a sort of geometric skeleton
of the figure, and its complexity, given by the number of branches, corresponds to the
boundary complexity, defined as the number of its curvature extrema. Unfortunately,
that makes it very sensitive to small perturbations of the boundary: noisy contours pro-
duce many secondary branches. For its instability the medial axis is not suitable as a
figure descriptor in contexts affected by noise, and as such it is also inappropriate where
finer scale details are irrelevant and need to be ignored.
Exact computation of the medial axis is difficult in general. An approximation of
the medial axis of a region can be obtained from the Voronoi diagram related to a finite
set of points that sample the region’s boundary [11]. The following algorithm builds
a robust simplified topological skeleton of a given polygonal region, namely the gross
skeleton, by exploiting a relevance measure [12] to selectively prune the approximated
Voronoi medial axis.
Algorithm (
gross skeleton construction)
.
Given {P
1
, ..P
n
}, vertices of a polygonal region L, and a threshold β
∗
∈ (0, 1),
1. Compute M, Voronoi approximation of the medial axis of L, as follows:
6
(a) Build the Voronoi diagram related to the set of vertices {P
1
, ..P
n
},
(b) Retain only the edges that are completely internal to L.
2. Compute the “index of relevance” β(E) of each edge E ∈ M, as
β : M → (0, 1) β(E) = 2|l|/|∂L|
where if P
i
, P
k
are the generators of Voronoi edge E, |l| is the length of shortest
polygonal path connecting P
i
with P
k
along the region’s boundary ∂L, and |∂L| is
the regions’s perimeter (Fig.2).
3. (
Selective pruning
) Initialize L
∗
:= M, and ∀E ∈ M do
if β(E) < β
∗
then L
∗
:= L
∗
\{E}.
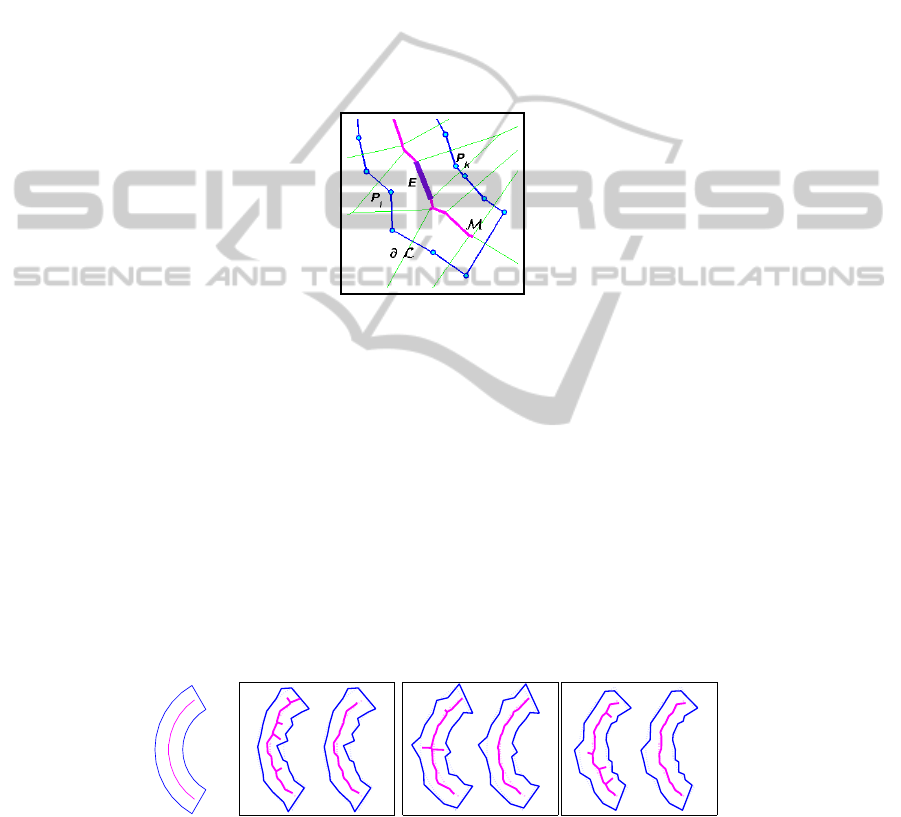
Fig.2. Steps in the construction of the gross skeleton of a polygonal region. Vertices P
i
, P
k
of
the region’s boundary generate Voronoi edge E (thicker line). Part of the Voronoi tessellation
(thin lines), and of the approximated medial axis M (thick line) are also shown.
Selective pruning of the medial axis M is performed according to an edge rele-
vance criterion by which irrelevant boundary details are dropped: edges with a very
low β value have a negligible effect on the region’s boundary. The result is a connected
linear structure that reflects the global topological structure of the region, as well as its
rough location and spatial extent. The choice of the relevance threshold β
∗
affects the
complexity of the resulting gross skeleton L
∗
, and adjusts the descriptor to the scale
required by the reasoning task: as greater β
∗
is, as more simplification is required.
In Fig. 3 a few perturbations of a smooth sample region are reported: in each case
both the Voronoi medial axis and the gross skeleton are computed. The figure clearly
shows how more robust the gross skeleton is with respect to the Voronoi medial axis
approximation, and how the global shape of the region is captured.
Fig.3. A set of perturbations of the smooth region shown on the left. In each panel: the Voronoi
based medial axis (left), and the gross skeleton obtained by pruning with β
∗
= 0.25 (right).
7

3 Functional Imaging of the Cardiac Electric Function
The heart is site of cyclic electrical activity which causes the muscle to rhythmically
contract. The propagation of the electric excitation within the myocardium is a quite
complex 4D spatiotemporal process that electrocardiologists explore on reference sur-
faces (epicardial, endocardial) by means of relevant variables, such as the electric po-
tential, the activation time and the wavefront propagation velocity. Due to the difficulty
of combining spatial and temporal aspects, exploring the potential u(x, t), a function of
space and time, is a hard task. A more global and synthetic view on the spatiotemporal
process of excitation is provided by the epicardial representation of the
activation time
τ(x), defined as the instant at which an epicardial site x changes its electric state from
resting to activated. Such an instant is commonly estimated as the point of minimum
derivative extracted from the electrogram t → u(x, t). Therefore, the activation time
embeds a qualitatively significant event in the electric potential time course, and, when
spatially represented on the whole epicardial surface, it holds a powerful diagnostic
potential.
In imaging of the cardiac electric function, an important role is played by activation
maps: such maps are contour maps of the activation time that convey information about
the wavefront structure and propagation.In [4], in accordance with the existing rationale
of interpretation, the problem of defining and abstracting, within the SA framework, a
set of spatial objects that capture a few important basic features of activation was tack-
led: isochrones, whose spatial sequence depicts the spread of excitation by snapshots,
wavefront breakthrough and exit locations, fast propagation pathways.
Fig.4. Activation map as obtained from noisy data.
As an example, Fig. 4 shows an activation map obtained from noisy simulated data
related to a case of normal propagation elicited by single site pacing. Let us remark that
the activation time field is actually related to a 3D model of the epicardium; in order to
have a unique global planar view with minimal spatial distortion, we operate on an axial
cylindrical projection (Fig. 5). After preliminary noise removal,from the activation field
the main wavefront propagation features are detected: the sequence of isochrones, the
breakthrough and extinction sites, which respectively mark where excitation starts and
ends on the epicardial surface, and the fast propagation pathways (Fig. 6).
Our work focusses on an important class of pathological conditions, namely reen-
try ventricular tachycardia (VT), and provide SA-based definitions and algorithms for
the abstraction and spatial redescription of the features involved. Reentry VT is usually
triggered by the presence of post-infarction scar tissue that slows conduction (propaga-
tion velocity ≤ 0.1 m/sec, [13]). When this happens, an anomalous activation pattern,
8
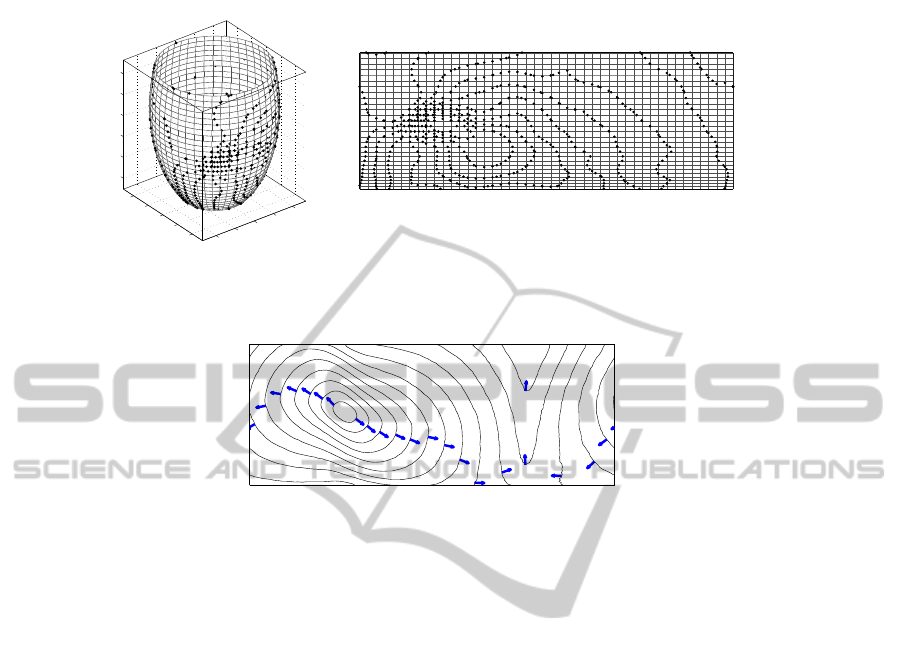
−2
−1
0
1
2
−2
−1
0
1
2
−4
−3
−2
−1
0
1
Fig.5. Isopoints (black dots) on the epicardial surface: the surface mesh is shown. Left panel: 3D
geometry. Right panel: 2D cylindrical projection.
B
e
e
e
E
Fig.6. Main wavefront propagation features abstracted from the sample data of Fig. 4: activation
isochrones, breakthrough (B) and exit sites (e/E), and fast propagation pathways (thick vectors).
called “reentry”, can appear: the excitation wavefront travels in single/multiple circu-
lar patterns, and reenters the area where it arose from. Much research effort has been
devoted to the study and characterization of this disorder. [14–16].
The key components of the reentrant VT pattern, in terms of wavefront kinematics,
are (i) a cul-de-sac-like region (isthmus), bounded by lines of block; (ii) a breakthrough
site in the isthmus area; (iii) a reentry propagation pattern; (iv) an excitation end site
located proximal to the breakthrough, outside the blocked area.
Given the discretized epicardial geometry Ω
h
and the activation time field τ =
τ(x
i
), x
i
∈ Ω
h
, the main steps carried out to map it to a structural spatial representation
of the salient propagation features, including the possible presence of a reentry VT
pattern, are here very briefly summarized:
1. Breakthrough and exit sites, isopoints, and the time sequence of the isochrones are
first obtained [4];
2. The velocity field is computed as v(x) = ∇τ(x)/|∇τ(x)|
2
where ∇ is the
gradient operator [17]. By mapping the velocity module range into a small set of
qualitative values, e.g. very-slow, slow, medium, high, in accordance with threshold
values suggested by the experts, the epicardial surface gets partitioned into homo-
geneous subregions, each of them labeled by the qualitative value of the velocity
module. In this context, the value very-slow marks a pathological condition. Then:
3. If the region L, labeled very-slow , is not empty,
9
(a) it gets redescribed by its gross skeleton, L
∗
, which represents the abstracted
“conduction block”
line;
(b) a set of propagation lines, obtained as stream lines of the vector field, are gen-
erated from a neighborhood of the ends of the block line, and classified into
“main propagation”
classes according to their ending site;
(c) among the ending sites associated with the main propagation paths, the nearest
to the isthmus area is located (loop pattern).
Step 3 aims at discovering and abstracting a possible reentry circuit by singling out
its key components. Let us remark that noisy data should be properly pre-processed to
reduce noise to acceptable levels and allow reliable and robust feature extraction. Data
smoothing actually corresponds to how the expert approaches the visual reasoning task,
by getting rid of minor or spurious details to catch the main patterns.
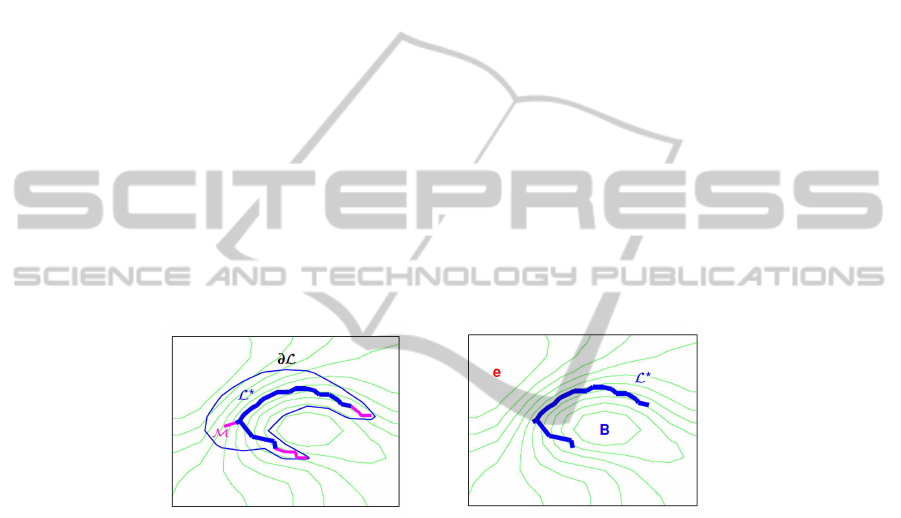
Figure 7 shows, for the data set corresponding to Fig. 5, a detail of the area where
isochrones are spatially denser: the boundary ∂L of a critical very-slow region is shown,
as well as the Voronoi based medial axis M, and the gross skeleton L
∗
(left panel). In
the right panel, the abstracted conduction block complex: a cul-de-sac region where
isochrones get more crowded, bounded by a line of block which separates a break-
through and an extinction sites, spatially close to each other. The line of block, extracted
as gross skeleton of the very-slow area, corresponds to merging the locally crowded
isochrones.
Fig.7. Left panel: the approximated medial axis M (thick line), and its pruned version L
∗
(dark
thick line) are shown within the very-low-velocity area bounded by ∂L. Right panel: the conduc-
tion block, extracted as a line of block (gross skeleton of the critical velocity area) which leaves
a breakthrough and an extinction site at opposite sides.
Figure 8 shows the global outcome of the abstraction processes. It consists of: the se-
quence of activation isochrones, the breakthrough and exit sites, the discovered block
of conduction, and the reentrant propagation patterns, starting at the ends of the block
arc.
4 Discussion and Conclusions
The approach herein proposed to automatically capture specific aspects of cardiac elec-
trical activity is of broad methodological interest to electrocardiography, and more in
general, to medical imaging. It results from the integration of standard computational
10

B
ee
ee
e
E
Fig.8. Outcome of the abstraction processes: activation isochrones (thin solid lines), break-
through/exit sites (B/E labels), and the block of conduction (thick solid line). A couple of wave-
front propagation lines, starting at the ends of the block arc, are shown (dashed thick lines).
geometry concepts with a spatial aggregation methodology. This latter, that aims at in-
terpreting a numeric input field, allows us to capture structural information about the
underlying physical phenomenon, and to identify its global patterns and the causal rela-
tions between them. Thanks to its hierarchical strategy in extracting objects at different
scales, it facilitates the definition of inference rules that favor automated reasoning on
spatiotemporal phenomena to perform a specific task.
Tested on a few sample data sets regarding cases of both normal and abnormal
propagation, the proposed methodology proved effective in the identification, from in-
put activation data, of the salient epicardial wavefront kinematics, and of specific spa-
tiotemporal features that characterize an important class of arrhythmias. At the current
stage of development, the analysis is limited to simplified scenarios, for which an inter-
pretative rationale is available. However, the results obtained even in presence of mild
noise make us confident about the feasibility of the realization, in the long term, of an
intelligent system for electrocardiac image understanding, based on such an approach.
Further work will regard:
(i) the validation of the methodology on measured data, to assess its weaknesses and
strengths when applied in a clinical context. To this regard, sensitivity to noise
should be more deeply investigated;
(ii) the study of more complex phenomena, such as those involving the Purkinje net-
work or multiple stimuli, and the proper characterization and identification of all
propagation aspects;
(iii) the definition of a strategy for the comparison of the features of a given map against
those of a nominal one, with the aim to detect and explain possible deviations from
the expected patterns.
As for the realization of a complete diagnostic tool for cardiac electric activity, fur-
ther insight into the electric function could be drawn from the analysis of temporal
sequences of potential data. From these data, especially intramural measurements, we
could derive information about the electrical activity prior to its surface breakthrough
that is complementary with respect to that obtainable from surface activation data. That
would allow us to locate intramural components of reentry pathways associated with
arrhythmogenic activity. However, the challenge of combining spatial and temporal as-
pects in a full 4D analysis goes with the still incomplete rationale of interpretation of
such maps, and makes advances in this direction more remote.
11

From a broader application perspective, besides contributing to a diagnostic tool
specifically designed for rhythm disturbances, the methodology we propose could be
used in a therapeutical context to evaluate the efficacy of a drug therapy aimed at nor-
malizing the rhythm, through the detection of its effects on the spatial activation pat-
terns.
References
1. Yip, K., Zhao, F.: Spatial aggregation: Theory and applications. J Artif Intell Res 5 (1996)
1–26
2. Ironi, L., Tentoni, S.: On the problem of adjacency relations in the spatial aggregation ap-
proach. In Proc. 17th Int. Workshop on Qualitative Reasoning. (2003) 111–118
3. Ironi, L., Tentoni, S.: Towards automated electrocardiac map interpretation: an intelligent
contouring tool based on spatial aggregation. In Berthold, M.R., Lenz, H.J., Bradley, E.,
Kruse, R., Borgelt, C., eds.: Advances in Intelligent Data Analysis V, Berlin, Springer (2003)
397–417
4. Ironi, L., Tentoni, S.: Automated detection of qualitative spatio-temporal features in electro-
cardiac activation maps. Artif Intell Med 39 (2007) 99–111
5. Clifford, G. D., Azuaje, F., McSharry, P. E., eds.: Advanced Methods and Tools for ECG
Analysis. Artech House Publishing, Boston/London (2006)
6. Bratko, I., Mozetic, I., Lavrac, N.: Kardio: A Study in Deep and Qualitative Knowledge for
Expert Systems. MIT Press, Cambridge, MA (1989)
7. Weng, F., Quiniou, R., Carrault, G., Cordier, M. O.: Learning structural knowledge from the
ECG. In: ISMDA-2001. Volume 2199. Berlin, Springer (2001) 288–294
8. Kundu, M., Nasipuri, M., Basu, D. K.: A knowledge based approach to ECG interpretation
using fuzzy logic. IEEE T Syst Man Cyb 28 (1998) 237–243
9. Oster, H. S., Taccardi, B., Lux, R. L., Ershler, P. R., Rudy, Y.: Noninvasive electrocardio-
graphic imaging: reconstruction of epicardial potentials, electrograms, and isochrones and
localization of single and multiple electrocardiac events. Circulation (1997) 1012–1024
10. Ramanathan, C., Ghanem, R. N., Jia, P., Ryu, K., Rudy, Y.: Noninvasive electrocardiographic
imaging for cardiac electrophysiology and arrythmia. Nat Med (2004) 1–7
11. Brandt, J. W., Algazi, V. R.: Continuous skeleton computation by Voronoi diagram. CVGIP:
Image understanding 55 (1992) 329–338
12. Sakai, H., Sugihara, K.: A method for stable construction of medial axes in figures. Electron
Comm Jpn 2 89 (2006) 48–55
13. Cranefield, P. F.: The Conduction of the Cardiac Impulse: the Slow Response and Cardiac
Arrhythmias. Futura Publishing Co, Mount Kisco NY (1975)
14. Burnes, J. E., Taccardi, B., Rudy, Y.: A noninvasive imaging modality for cardiac arrhyth-
mias. Circulation 102 (2000) 2152–2158
15. Burnes, J. E., Taccardi, B., Ershler, P. R., Rudy, Y.: Noninvasive electrocardiogram imaging
of substrate and intramural ventricular tachycardia in infarcted hearts. J Am Coll Cardiol 38
(2001) 2071–2078
16. de Bakker, J. M., van Capelle, F. J., Janse, M. J., Tasseron, S., Vermeulen, J. T., de Jonge,
N., Lahpor, J.R.: Slow conduction in the infarcted human heart. Zigzag course of activation.
Circulation 88 (1993) 915–926
17. Colli Franzone, P., Guerri, L., Pennacchio, M.: Spreading of excitation in 3-D models of
the anisotropic cardiac tissue. II. Effect of geometry and fiber architecture of the ventricular
wall. Math Biosci 147 (1998) 131–171
12
