
STATISTICAL ANALYSIS OF THE SIGNAL AND PROSODIC SIGN
OF COGNITIVE IMPAIRMENT IN ELDERLY-SPEECH
A Preliminary Study
Shohei Kato, Yuta Suzuki
Dept. of Computer Science and Engineering, Nagoya Institute of Technology
Gokiso-cho, Showa-ku, Nagoya 466-8555, Japan
Akiko Kobayashi, Toshiaki Kojima
Ifcom. Co., Ltd.
Time24 Bldg. 4F, 2-45, Aomi, Koto-Ku, Tokyo 135-8073, Japan
Hidenori Itoh
Nagoya Institute of Technology, Nagoya, Japan
Akira Homma
Tokyo Dementia Care Research and Training Center
1-12-1, Takaido Nishi, Suginami-ku, Tokyo 168-0071, Japan
Keywords:
Early detection of dementia, Speech prosody, Acoustic analysis, Feature selection, Speech prosody-based
cognitive impairment rating.
Abstract:
This paper presents a novel approach for early detection of cognitive impairment in the elderly. Our approach
incorporates the use of speech sound analysis and multivariate statistical techniques. In this paper, we focus on
the prosodic features of speech. Fifty six Japanese subjects (22 males and 34 females between the ages of 64
and 90 years) participated in this study. Blind to clinical groups, we collected speech sounds from segments of
dialogue during an HDS-R examination. The segments corresponds to speech sounds from answers to ques-
tions about time orientation and number backward counting. Ninety eight prosodic features were extracted
from each of the speech sounds. These prosodic features consisted of spectral and pitch features (13), formant
features (61), intensity features (22), and speech rate and response time (2). These features were refined by
principal component analysis and/or feature selection. In addition, we calculated speech prosody-based cog-
nitive impairment rating (SPCIR) by multiple linear regression analysis. The results indicate that a moderately
significant correlation exists between the HDS-R score and the synthesis of several selected prosodic features.
Consequently, the adjusted coefficient of determination (
¯
R
2
= 0.57) suggests that prosody-based speech sound
analysis could potentially be used to detect cognitive impairment in elderly subjects.
1 INTRODUCTION
Japan has a rapidly aging society and in 2005 had 2.05
million elderly patients with dementia. The number
of the patients with dementia is expected to increase
to more than 3 million over the next 10 years (Awata,
2009). Thus, the Ministry of Health, Labour and Wel-
fare (MHLW) has begun projects to improvedementia
treatment and quality of life. These projects are fo-
cused on the development of early detection methods
for dementia that are both sensitive and specific.
To screen for dementia and cognitive impair-
ment, a questionnaire test such as Mini-Mental State
Examination (MMSE) (Folstein et al., 1975), Re-
vised Hasegawa’s Dementia Scale (HDS-R) (Imai and
Hasegawa, 1994), Clinical Dementia Rating (CDR)
(Morris, 1993), and Memory Impairment Screen
(MIS) (Buschke et al., 1999), is commonly used in
addition to a neurophysiological test (e.g., using MRI,
FDG-PET, and CSF biomarkers). Questionnaire tests
have some disadvantages and their use is limited in
the clinic. The MMSE, HDS-R, and CDR are more
322
Kato S., Suzuki Y., Kobayashi A., Kojima T., Itoh H. and Homma A..
STATISTICAL ANALYSIS OF THE SIGNAL AND PROSODIC SIGN OF COGNITIVE IMPAIRMENT IN ELDERLY-SPEECH - A Preliminary Study.
DOI: 10.5220/0003189903220327
In Proceedings of the International Conference on Bio-inspired Systems and Signal Processing (BIOSIGNALS-2011), pages 322-327
ISBN: 978-989-8425-35-5
Copyright
c
2011 SCITEPRESS (Science and Technology Publications, Lda.)

time-consuming that a general practitioner’s consulta-
tion. In general, the questionnaire cannot completely
dismiss the influence of education, social class, and
gender difference on the results. In addition, there is
a possibility that practitioner subjectivity may affect
the scoring. Thus, we believe that the development of
a simple, non-invasive examination that is objective
and combined with a physiological test could enables
the early detection of dementia in a broad population.
In a pilot study, we focused on speech sounds dur-
ing the subject’s answers to the questionnaire. Taler et
al. have reported language (Taler and Phillips, 2007),
and grammatical, and emotional prosodic impairment
(Taler et al., 2008), as well as mild cognitive impair-
ment (MCI), in elderly patients with Alzheimer’s dis-
ease (AD). Hoyte et al. (Hoyte et al., 2009) reported
that the components of speech prosody are useful for
detecting the syntactic structure of speech. These re-
ports suggest the possibility of using speech prosodic
feature analysis to screen for dementia. This paper
presents a novel approach to the early detection of
cognitive impairment in the elderly that uses speech
sound analysis in combination with a multivariate sta-
tistical technique. In this paper, we focused on the
prosodic features of speech sound. We expect that
the computation and information technology of this
approach will enable general practitioners to easily
screen for dementia. In our preliminary study, we ex-
amined the relationship between the HDS-R score and
speech prosodic features. In addition, we addressed
the effectiveness of speech prosody in discriminating
among elderly individuals with normal cognitive abil-
ities (NL), patients with mild cognitive impairment
(MCI), and Alzheimer’s disease (AD).
2 METHOD
2.1 Design
We recorded the speech sound of elderly patients
while they provided answers for an HDS-R question-
naire test. We focused on questions questions about
time orientation and number backward counting. In
addition, we collected speech sounds while the pa-
tients were talking about the topics of hometown,
childhood, and school.
2.2 Participants
Fifty six Japanese subjects (22 males and 34 females
between the ages of 64 and 90 years) participated
in this study. With some exception, we collected
three samples of speech sound from each of the par-
ticipants. The number of total sound data points
was 146 as shown in Table 1. The sound data con-
tained 42 samples of speech by elderly individuals
with normal cognitive abilities (NL) (HDS-R score
was 28.6± 1.7, n=16), 41 samples from patients with
mild cognitive impairment (MCI) (HDS-R score was
25.4± 1.8, n=14), and 63 samples from patients with
Alzheimer’s disease (AD) (HDS-R score was 18.5 ±
5.5, n=22). Four subjects were excluded from these
clinical groups because of the diffuse Lewy body dis-
ease (DLBD).
3 MEASUREMENT
3.1 Prosodic Feature Extraction
Speech has three components: prosody, tone, and
phoneme. Past research indicates that the prosodic
component has important non-verbal information
such as emotional expressions (Cowie et al., 2001),
(Scherer et al., 2003), (Cho et al., 2009). In accor-
dance with our hypothesis, cognitive impairment was
observed in the elderly (Taler and Phillips, 2007),
(Taler et al., 2008). In this study, we considered 98
different acoustic correlates related to both segmental
and suprasegmental information from speech signals.
We used a computational data mining strategy based
on a statistical-analytical approach. We extracted as
many features as possible, and disregarded irrelevant
features using a feature selection technique. These
features were phrase-level statistics corresponding to
fundamental frequency (F0) and their time-series be-
havior (13 features), formant and its time-series be-
havior (61 features), power envelope and its time-
series behavior (22 features), speech rate, and re-
sponse time (2 features). Prosodic analysis was per-
formed in 23-ms frames and passed through a Ham-
ming window (1024 points). Voice waveforms (sam-
pled at 44.1 kHz with 16 bits) were extracted using a
short-time Fourier transform (STFT) every 11 ms.
3.1.1 Spectral and Pitch Features
The set of 13 spectral features is comprised of statisti-
cal properties and time-series behaviors of fundamen-
tal frequency (F0).
F1.-7. Amplitude of F0 contour during t sec after the be-
ginning of the phrase (t = 0.05,0.10,· · · , 0.35). The
F0 contour is recorded in the interquartile range.
F8. Spectral centroid.
F9.-12. Standard deviation, mean, maximum, and mini-
mum value of the F0 contour.
STATISTICAL ANALYSIS OF THE SIGNAL AND PROSODIC SIGN OF COGNITIVE IMPAIRMENT IN
ELDERLY-SPEECH - A Preliminary Study
323

Table 1: Category Breakdown of the Speech Data (N=52).
Age 64-70 71-75 76-80 81-85 86-90 Total
Male 9 (6) 0 (0) 14 (5) 26 (9) 5 (2) 54 (19)
Female 16 (6) 18 (7) 23 (8) 24 (8) 11 (4) 92 (33)
Subtotal 25 (9) 18 (7) 37 (13) 50 (16) 16 (6) 146 (52)
Value in bracket means the number of subjects.
F13. Gradient of the linear regression line of the F0 con-
tour.
3.1.2 Formant Features
Formant features consist of 61 values of frequency
and bandwidth for the first 4 formants of distinguish-
ing or meaningful frequency components within hu-
man speech.
For1. Power ratio of the sum of four formant components to
whole frequency range.
For2.-4. Power ratio of the sum for the first n formant
components to that of four formant components (n =
1,2,3).
For5. Power ratio between odd and even formant compo-
nents.
For6.-9. Standard deviation of the first, second, third, and
fourth formant frequencies.
For10.-13. Mean value of the first, second, third, and fourth
formant frequencies.
For14.-17. Maximum value of the first, second, third, and
fourth formant frequencies.
For18.-21. Minimum value of the first, second, third, and
fourth formant frequencies.
For22.-25. Median value of the first, second, third, and
fourth formant frequencies.
For26.-29. Difference between the maximum and minimum
values of the first, second, third, and fourth formant
frequencies.
For30.-33. Gradient of the linear regression line of the first,
second, third, and fourth formant frequencies.
For34.-37. Standard deviation of the first, second, third, and
fourth formant bandwidths.
For38.-41. Mean value of the first, second, third, and fourth
formant bandwidths.
For42.-45. Maximum value of the first, second, third, and
fourth formant bandwidths.
For46.-49. Minimum value of the first, second, third, and
fourth formant bandwidths.
For50.-53. Median value of the first, second, third, and
fourth formant bandwidths.
For54.-57. Difference between the maximum and minimum
values of the first, second, third, and fourth formant
bandwidths.
For58.-61. Gradient of the linear regression line of the first,
second, third, and fourth formant bandwidths.
3.1.3 Intensity (Energy) Features
We extracted 22 energy features with the statistical
properties of the power envelope.
Pow1. Gradient of the linear regression line of the power
envelope.
Pow2.-8. Median value of the first derivative of the power
envelope during the t seconds after the beginning of
the phrase (t = 0.05,0.10,· · · ,0.35).
Pow9.-15. Ratio of the power at t seconds after the be-
ginning of the phrase to the maximum power (t =
0.05,0.10,· · · , 0.35).
Pow16.-19. Standard deviation, mean, maximum, and mini-
mum value of the short-time power.
Pow20. Gradient of the linear regression line of the power
envelope from the beginning of the phrase to the peak.
Pow21. Gradient of the linear regression line of the power
envelope from the peak to the end of the phrase.
Pow22. Ratio between the time from the beginning of the
phrase to the peak and the time from the peak to the
end.
3.1.4 Speech Rate and Response Time
In addition, we measured two features concerning
speech rate and response time to answer in the ques-
tionnaire.
T1. Average duration for a single mora.
T2. Time taken to respond to the questionnaire.
3.2 Automatic Feature Selection
In our strategy for feature extraction, all of the
prosodic features described above may not be equally
useful and important for discrimination among NL,
MCI, and AD. This creates the need for systematic
feature selection. In this study, we used the forward
stepwise (FSW) method (Draper and Smith, 1998),
which is the most popular form of feature selection
in statistics and consists of a combination of the for-
ward selection and backward elimination methods.
FSW is a greedy algorithm that adds the best feature
(or deletes the worst feature) during each round. We
chose a model selection method based on the Akaike’s
information criterion (AIC) (Akaike, 1974), which is
BIOSIGNALS 2011 - International Conference on Bio-inspired Systems and Signal Processing
324
a measure of the goodness of fit of an estimated sta-
tistical model. Using this criterion if the FSW, we
were able to develop an estimation accuracy model
with high accuracy and avoid over-fitting to training
data. The AIC is defined as:
AIC = −2lnL+ 2k, (1)
where k is the number of parameters in the estimated
model, and L is the maximized value of the likeli-
hood function for the estimated model. Under the
assumption that the model errors are normally and in-
dependently distributed, this becomes (up to an addi-
tive constant, which depends only on n and not on the
model):
AIC = n · ln(RSS/n) + 2k, (2)
where n is the number of data points (sample size),
and RSS is the residual sum of squares from the es-
timated model. In this study, the RSS was obtained
by calculating the sum of the square error of the dif-
ference between the estimated and observed HDS-R
scores. FSW selects the best subset of all features to
minimize (locally) the AIC score.
When determining the model parameters using the
maximum likelihood estimation, it is possible to in-
crease the likelihood by adding additional parame-
ters; however, this also may result in over-fitting of
the data. This represents a tradeoff between precision
and complexity in the model. In addition to Schwarz’s
BIC (Schwarz, 1978), the AIC resolves this problem
by introducing a penalty term (corresponding to the
second term in Eq. (2)) for the number of parameters
in the model. This penalty discourages over fitting,
but it should be avoided so that the feature may be ef-
fectivelyeliminated. In this paper, we introduce a pre-
processing method that synthesizes prosodic features
by principal component analysis (PCA) prior to fea-
ture selection. This method is a combination of prin-
cipal component regression (Massy, 1965) and auto-
matic feature selection.
In the following section, the correlation between
HDS-R score and synthesis of selected prosodic fea-
tures is described by experimental results of mul-
tiple regression analysis through four manners of
feature selection: forward stepwise method with
AIC (FSW-AIC), PCA pre-processed forward step-
wise method with AIC (PCA-FSW-AIC), forced en-
try method without feature selection (FE) , and PCA
pre-processed forced entry method without feature se-
lection (PCA-FE).
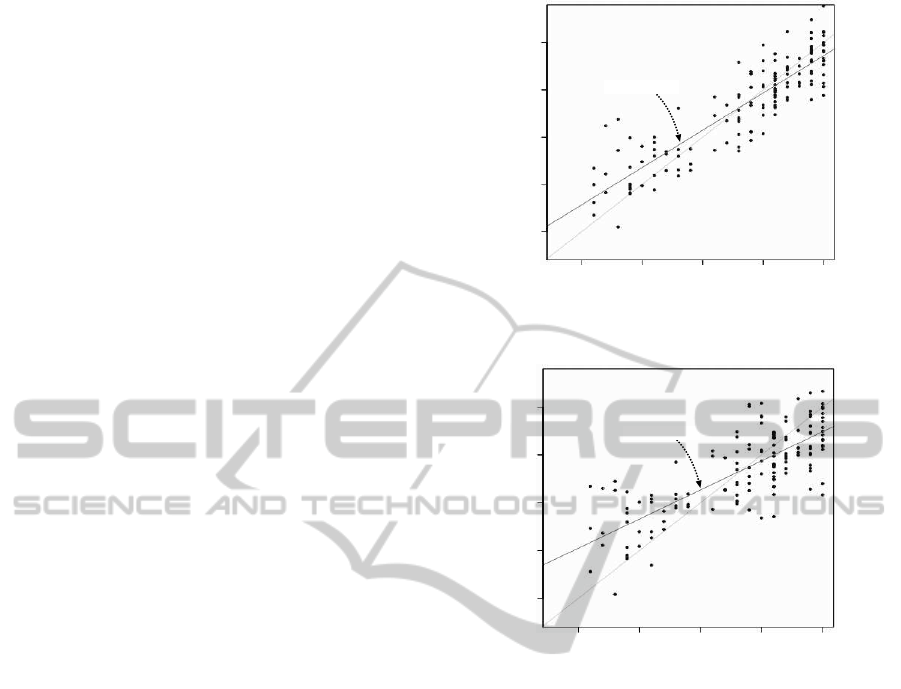
SPCIR_FE
HDS-R
10 15 20 25 30
10
15
20
25
30
Y=0.79X+4.95
Figure 1: Scatter plot of HDS-R and SPCIR
FE
(
¯
R
2
= 0.36).
SPCIR_FSW-AIC
HDS-R
10 15 20 25 30
10
15
20
25
30
Y=0.61X+9.15
Figure 2: Scatter plot of HDS-R and SPCIR
FSW-AIC
(
¯
R
2
=
0.50).
4 RESULTS AND DISCUSSION
This section describes the correlation between HDS-
R and speech prosody in elderly individuals using 146
speech voice samples (N=52), each with 98 prosodic
features. We calculated the speech prosody-based
cognitive impairment rating (SPCIR) by multiple lin-
ear regression using prosodic features (as regressors)
selected by the feature selection method mentioned
above. In PCA pre-processing, we used kernel PCA
(Sch¨olkopf et al., 1998) as the principal component
analysis. and calculated 98 PCs because the accumu-
lated contribution relevance is more than 90%.
SPCIR
FE
, SPCIR
FSW-AIC
, SPCIR
PCA-FE
, and
SPCIR
PCA-FSW-AIC
were calculated from the feature
set chosen by FE, FSW-AIC, PCA-FE, and PCA-
FSW-AIC, respectively. Table 2 shows the results of
the analysis and the scatter plots of HDS-R and the
SPCIRs are shown in Fig. 1-4. Table 3 shows the
dominant regressors obtained from each of the feature
selection methods.
STATISTICAL ANALYSIS OF THE SIGNAL AND PROSODIC SIGN OF COGNITIVE IMPAIRMENT IN
ELDERLY-SPEECH - A Preliminary Study
325
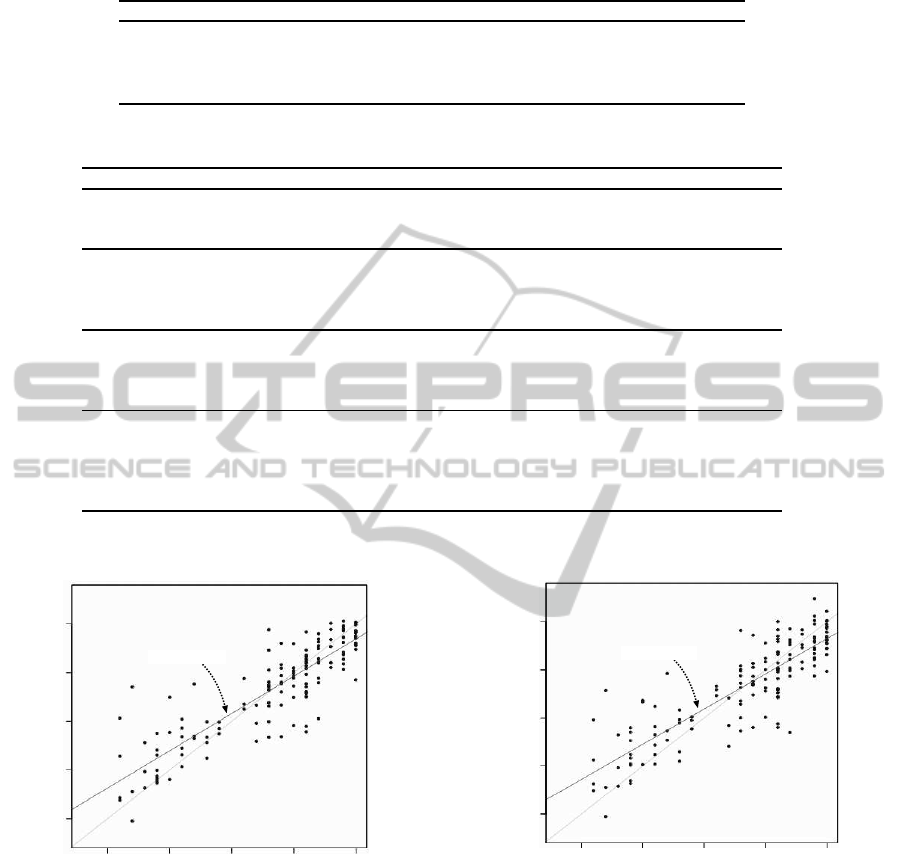
Table 2: Correlation between SPCIR and HDS-R by Multiple Linear Regression.
SPCIR
FE
SPCIR
FSW-AIC
SPCIR
PCA-FE
SPCIR
PCA-FSW-AIC
# of regressors 98 31 93 55
R 0.78 0.61 0.77 0.73
¯
R
2
0.36 0.50 0.35 0.57
S.E. 4.56 4.02 4.62 3.75
Table 3: Dominant Regressors for Estimate of HDS-R.
Method dominant regressors
SPCIR
FE
98 regressors in total
** Pow8, For48
* For49, For5, For55, For51
SPCIR
FSW-AIC
31 regressors in total
*** Pow7, Pow15, For48, For26, Pow18, F4, For47, For15, Pow9, Pow16
** Pow5, For29
* F13, For13, For46, For19, For50, For51, For21, For47
SPCIR
PCA-FE
93 regressors in total
*** PC93
** PC7, PC34
* PC27,PC32, PC71, PC19, PC8, PC51
SPCIR
PCA-FSW-FE
55 regressors in total
*** PC93, PC7, PC34
** PC29, PC32, PC71, PC19
* PC8, PC51, PC49, PC42, PC2, PC92, PC20, PC38, PC25, PC47, PC44,
PC53, PC80, PC10, PC39, PC30
***: with significance level of 0.001, **: with significance level of 0.01
*: with significance level of 0.05
SPCIR_PCA-FE
20 25 30
10
15
20
25
30
HDS-R
10 15
Y=0.77X+5.49
Figure 3: Scatter plot of HDS-R and SPCIR
PCA-FE
(
¯
R
2
=
0.35).
SPCIR
FE
apparently has a larger correlation with
HDS-R (R = 0.78); however the adjusted coefficient
of determination declined (
¯
R
2
= 0.36). This method
detected few dominant regressors suggesting over-
fitting of the samples and multicollinearity due to a
large number of regressors.
SPCIR
FSW-AIC
avoids the disadvantages of over-
fitting and increases the number of dominant regres-
sors; however it does not give a satisfactory HDS-R
correlation (R = 0.61) and an adjusted coefficient of
SPCIR_PCA-FSW-AIC
25 30
10
15
20
25
30
20
HDS-R
10 15
Y=0.73X+6.27
Figure 4: Scatter plot of HDS-R and SPCIR
PCA-FSW-AIC
(
¯
R
2
= 0.57).
determination (
¯
R
2
= 0.50). SPCIR
FSW-AIC
uses only
31 total regressors due to the penalty term of AIC,
which was based on model complexity. There might
be effective features for estimation of HDS-R in the
67 regressors that were not chosen by FSW-AIC.
SPCIR
PCA-FSW-AIC
, with the PCA pre-processed
forward stepwise method in combination with AIC,
solved the above-mentioned problems. In this
method, principal components of 98 features were
used as regressor candidates during feature selection,
and 55 PCs were used as regressors in multiple re-
BIOSIGNALS 2011 - International Conference on Bio-inspired Systems and Signal Processing
326

gression. As shown in Table 3, the principal com-
ponents with higher variance (i.e., PC7, PC8, PC2)
were dominant regressors; however the low-variance
principal components, such as PC93, PC71 and PC92,
were also important for estimation of HDS-R. Fi-
nally, we obtained the scatter plot shown in Fig. 4,
which suggests a positive linear relationship between
HDS-R and SPCIR. The results indicates a moder-
ately significant correlation (R = 0.73) between the
HDS-R score and the appropriate synthesis of sev-
eral selected prosodic features. Consequently, the ad-
justed coefficient of determination (
¯
R
2
= 0.57) sug-
gests that prosody-based speech sound analysis could
potentially be used to detect cognitive impairment in
elderly patients.
5 CONCLUSIONS AND FUTURE
WORK
Our study presented a novel approach to detect cog-
nitive impairment in elderly patients. This approach
uses prosody-based speech sound analysis and a mul-
tivariate statistical technique. As a clinical data exam-
ination, we collected 146 speech voice samples from
56 Japanese participants and extracted 98 prosodic
features from each of the samples. We then analyzed
the correlation between the HDS-R score and synthe-
sis of selected prosodic features by multiple linear re-
gression in combination with sophisticated feature se-
lection. We uncovered a moderately significant cor-
relation. Thus, this speech prosody-based approach
may be used to detect cognitive impairment in el-
derly patients. In future work, more expansive multi-
modality data collection will be performed using non-
invasive neurophysiological measurements such as
functional near-infrared spectroscopy (fNIRS). Much
more clinical trials will also be evaluated, and the
technique proposed here will be used as a screening
tool for dementia.
ACKNOWLEDGEMENTS
We are grateful to Dr. H. Endo and National Center
for Geriatrics and Gerontology for clinical assessment
and speech data collection. This work was supported
in part by SENTAN, Japan Science and Technology
Agency (JST), and part by Suzuken Memorial Foun-
dation.
REFERENCES
Akaike, H. (1974). A new look at the statistical model iden-
tification. IEEE Transactions on Automatic Control,
19(6):716–723.
Awata, S. (2009). Roll of the dementia medical center in
the community. In Japanese Journal of Geriatrics,
volume 46, pages 203–206. (in Japanese).
Buschke, H., Kuslansky, G., Katz, M., Stewart, W. F., Sli-
winski, M. J., Eckholdt, H. M., and Lipton, R. B.
(1999). Screening for dementia with the Memory Im-
pairment Screen. Neurology, 52(2):231–238.
Cho, J., Kato, S., and Itoh, H. (2009). Comparison of Sensi-
bilities of Japanese and Koreans in Recognizing Emo-
tions from Speech by using Bayesian Networks. In
IEEE International Conference on Systems, Man, and
Cybernetics, pages 2945–2950.
Cowie, R., Douglas-Cowie, E., Tsapatsoulis, N., Votsis,
G., Kollias, S., Fellenz, W., and Taylor, J. G. (2001).
Emotion recognition in human-computer interaction.
IEEE Signal Processing Magazine, 18(1):32–80.
Draper, N. and Smith, H. (1998). Applied Regression Anal-
ysis (3rd edition). John Wiley & Sons.
Folstein, M. F., Folstein, S. E., and McHugh, P. R. (1975).
“Mini-Mental State”: A practical method for grading
the cognitive state of patients for the clinician. J. Psy-
chiat. Res, 12(3):189–198.
Hoyte, K., Brownell, H., and Wingfield, A. (2009). Com-
ponents of Speech Prosody and their Use in Detection
of Syntactic Structure by Older Adults. Experimental
Aging Research, 35(1):129–151.
Imai, Y. and Hasegawa, K. (1994). The revised Hasegawa’s
Dementia Scale (HDS-R): evaluation of its usefulness
as a screening test for dementia. J. Hong Kong Coll.
Psychiatr., 4(SP2):20–24.
Massy, W. F. (1965). Principal Components Regression in
Exploratory Statistical Research. Journal of the Amer-
ican Statistical Association, 60(309):234–256.
Morris, J. C. (1993). The Clinical Dementia Rating
(CDR): Current version and scoring rules. Neurology,
43(11):2412–2414.
Scherer, K. R., Johnstone, T., and Klasmeyer, G. (2003).
Vocal expression of emotion. R. J. Davidson, H. Gold-
smith, K. R. Scherer eds., Handbook of the Affective
Sciences (pp. 433–456), Oxford University Press.
Sch¨olkopf, B., Smola, A., and M¨uller, K.-R. (1998). Non-
linear component analysis as a kernel eigenvalue prob-
lem. Neural Computation, 10(5):1299–1319.
Schwarz, G. E. (1978). Estimating the Dimension of a
Model. The Annals of Statistics, 6(2):461–464.
Taler, V., Baum, S. R., Chertkow, H., and Saumier, D.
(2008). Comprehension of grammatical and emo-
tional prosody is impaired in Alzheimer’s disease.
Neuropsychology, 22(2):188–195.
Taler, V. and Phillips, N. (2007). Language performance in
Alzheimer’s disease and mild cognitive impairment:
A comparative review. Journal of Clinical and Exper-
imental Neuropsychology, 30(5):501–556.
STATISTICAL ANALYSIS OF THE SIGNAL AND PROSODIC SIGN OF COGNITIVE IMPAIRMENT IN
ELDERLY-SPEECH - A Preliminary Study
327
