
DYNAMIC RESOURCE ALLOCATION THROUGH
SEMI-STRUCTURED ADAPTATION
Sander van Splunter, Elth Ogston and Frances Brazier
Dynamic Adaptive Systems Design group, Delft University of Technology, Jaffalaan 5, Delft, The Netherlands
Keywords:
Multi-agent systems, Autonomy, Distributed energy management, Reconfiguration.
Abstract:
Many of today’s systems are complex, distributed and networked, often situated in very dynamic environments.
Such systems are often designed to adapt to change autonomically, to manage themselves autonomously. The
Smart Energy Grid is an example of a large scale distributed system for which Distributed Energy Resource
Management is crucial. This paper proposes a loosely coordinated management structure for Virtual Power
Stations (VPS): hierarchical configuration. Within VPSs individual consumers and producers each with their
own goals and responsibilities also share responsibility for collective goals such as reliability. Hierarchic self-
management combines the strengths of centralised approaches with clear contracts and dependencies, with the
strength of a fully decentralised approach within which distributed parts of a system adapt autonomously.
Agent-based simulation experiments illustrate the potential of a hierarchical approach for distribution of re-
sources within and between Virtual Power Stations as conditions change. Comparisons to centralised manage-
ment and to fully decentralised management show that performance of the hierarchical approach is close to a
centralised approach, whilst flexibility and scaleability are comparable to a fully decentralised approach.
1 INTRODUCTION
In dynamic distributed systems the ability for a sys-
tem to adapt to a changing environment, whilst re-
specting global requirements for which it has been
designed, is a challenge. The Smart Energy Grid is
an example of a distributed system with Distributed
Energy Resource Management. Distributed Energy
Resource Management (DER) is designed to fulfil
global goals such as reliability. Many of today’s DER
systems are based on the creation of virtual groups
(Kok et al., 2005; Braun and Strauss, 2008; James
et al., 2008) of producers and consumers within which
power production and power consumption are rela-
tively balanced. In most cases dynamic virtual or-
ganisations are needed to cope with fluctuation in de-
mand and production. A virtual organisation with a
large number of solar panels, for example, may pro-
vide sufficient power for an office block on cloudy
days, but will, most likely overproduce when it is
sunny. Another virtual organisation may rely on other
sources and have too little production power when the
sun shines. These virtual organisations, referred to as
“Virtual Power Stations” (VPS), may agree to jointly
regulate power exchange as a shared responsibility,
e.g. to regulate a certain reliability of service across
their overall network. To this purpose VPSs, for
example, may collectively participate in whole-sale
electricity markets but also in local markets in which
small scale producers can sell energy that would oth-
erwise be wasted. The ability to match demand to
supply within and between VPSs has many potential
advantages: distributing responsibility and overhead
within and between VPSs. There is, however, a need
for coordination between the parties involved: in par-
ticular coordination of both capacity and production
targets across groups.
This paper extends previous research on distribu-
tion of autonomy and control of resources (Ogston
and Brazier, 2009), exploring different approaches
to system architecture. An agent-based experimen-
tal comparison of (1) a centralised, (2) a fully de-
centralised and (3) a hierarchical approach to DER
management is presented. The centralised approach
is shown to be limited in scalability and flexibility.
The fully decentralised approach is limited in its abil-
ity to assess the impact of local changes. The hier-
archical approach provides scalability and flexibility,
supporting automated assessment of the impact of lo-
cal changes to overall (global) system behaviour.
Two sets of experiments are performed: one to as-
sess the speed of adaptation, and the second to assess
the impact of the ability to redistribute responsibil-
ity. Section 2 describes the design of the experiments,
302
van Splunter S., Ogston E. and Brazier F..
DYNAMIC RESOURCE ALLOCATION THROUGH SEMI-STRUCTURED ADAPTATION.
DOI: 10.5220/0003188303020310
In Proceedings of the 3rd International Conference on Agents and Artificial Intelligence (ICAART-2011), pages 302-310
ISBN: 978-989-8425-41-6
Copyright
c
2011 SCITEPRESS (Science and Technology Publications, Lda.)

Section 3 presents experimental results for artificial
data for solar panels. Section 4 presents the results of
the same experiments with solar panel models based
on real world data. Section 5 discusses the results and
directions for future research.
2 EXPERIMENTAL SETUP
The purpose of experimentation is to explore the ef-
fect of system design, i. e. division of control and re-
sponsibility on system performance. Section 2.1 de-
scribes the scenario, the context within which the ef-
fect of division of responsibility is explored. Section
2.2 describes the services and agents involved.
Section 2.3 described the heuristics used within
the VPS to adapt to changes in production. The data
sets used within the simulation are described in detail
in Section 2.4.
2.1 Scenario
A scenario has been designed to explore the effect
of system designs, ie o compare different ways of
dividing resources and responsibilities between one
or more virtual power stations. A group of virtual
power stations is given a (global) target amount of
power to produce. This target is divided between the
VPSs to give each a local production target. Each
VPS then selects energy resources to contribute to its
local production. The goal is to meet the global tar-
get as well as possible. Failing to produce enough
power results in failing to meet an external service
level agreement, or additional costs to acquire power
from external sources. Producing too much results in
the extra power being wasted. The energy produced
by the resources varies over time, so that any single
configuration may not always be optimal.
The amount of power produced is managed in two
ways. First each VPS manages its own composition,
adding and removing resources from an external pool,
to best meet its local target. Second, production tar-
gets can be redistributed. Each VPS can have a dif-
ferent set of resources from which to choose. This
means that when one VPS is unable to meet its target
because it no longer has resources available in its ex-
ternal pool, another VPS may still be able to increase
its production using resources available in its external
pool. Redistributing production targets can result in a
better match of resources within each location.
The experimental model distinguishes VPS man-
agers and Resource managers. A VPS manager rep-
resents a VPS and is responsible for managing the
composition of the VPS, coordination between Re-
source managers within the VPS and interactions be-
tween the VPS and the external environment within
which the VPS exists. Resource managers represents
a small-scale prosumer, and are responsible for local
management of that prosumer’s energy resources. A
simple VPS consists of one VPS manager and a num-
ber of Resource managers. Each Resource manager
can only be a member of one VPS at a time. A com-
pound VPS consist of one VPS manager coordinating
multiple sub-VPS manager. A compound VPS is rep-
resented as a hierarchy of VPS managers, in which all
the leaves are resources, such the compound VPS de-
picted in Figure 1(c). Each VPS manager involved
manages a single level within the hierarchy of the
overall VPS.
For a given experiment a “map” defines which
VPS has access to which energy resources. This map
includes a geographical location for each resource,
and a geographical area covered by each VPS. A re-
source may only join a VPS if its position falls within
the VPS’s geographical area. VPS areas may be over-
lapping, meaning that some resources can be targeted
by more than one VPS.
More precisely, the scenario consists of a global
energy production target C(t) distributed among a set
of N virtual power stations, V = {v
1
, . . . , v
N
} such
that
∑
N
i=1
C
i
(t) = C(t) at all times, where C
i
(t) is the
target production of v
i
at time t. R = {r
1
, . . . , r
m
}
denotes the set of all resources. Each virtual power
station has a pool of energy resources, R
i
⊆ R from
which resources are selected. The set of active re-
sources at time t at VPS v
i
is denoted by A
i
(t) ⊆ R
i
,
where A
i
(t) ∩ A
j
(t) is assumed to be empty for all
i 6= j. Each energy resource r
j
has a variable energy
production e
j
(t). The goal of each virtual power sta-
tion is to assure that at all times its total production
meets its target production, E
i
(t) :=
∑
r
j
∈A
i
(t)
e
j
(t) ≥
C
i
(t). The goal of the system as a whole is to as-
sure that the total production of all the VPSs meets
the global target at all times,
∑
N
i=1
E
i
(t) ≥ C(t). This is
done either by changing the selected energy resources
A(t) := ∪
i
A
i
(t) and by redistributing the target pro-
duction C(t).
2.2 Simulation
The agent implementation used for the experiments
in this paper distinguishes: (1) VPS managers, that
maintain and manipulate a single level in a VPS con-
figuration. (2) energy resource managers, that man-
age the available resources, in this experiment - solar
panels; (3) a resource monitor, that monitors the pro-
duction of the managed energy resources and aggre-
DYNAMIC RESOURCE ALLOCATION THROUGH SEMI-STRUCTURED ADAPTATION
303

gation of information on production within a single
level of a VPS; and (4) a directory service, that main-
tains a list of the resources that are available at any
given time, resources that could join a VPS.
Each VPS manager manages a single level within
a VPS. A VPS manager is either a simple or a com-
pound VPS manager. A simple VPS manager main-
tains a level in a VPS containing only resource man-
agers, such as the VPS manager depicted in Figure
1(a). A compound VPS manager maintains a level
in a VPS containing only other VPS managers, for
example the top two layers of VPS managers de-
picted in Figure 1(c). A complete VPS is represented
as the VPS manager of all of the levels in the VPS
together with the active energy Resource managers.
Each VPS manager performs modifications on its own
level: adding or dropping resources, or redistribut-
ing target capacities over subVPS manager. The fre-
quency at which these modification are performed, m,
determines the stability of the overall VPS. In this
paper m = 30 minutes is used, preventing the over-
all VPS from becoming too instable. Decisions to
select modifications are made based on information
provided by a local resource monitor and heuristics
further described in Section 2.3.
An energy resource manager represents a solar
panel, to allow simple contracts to be negotiated with
VPS managers, and to exchange information on the
current output of its represented energy resource. The
solar panels used within this experiment are described
in section 2.4.2.
A resource monitor provides a VPS manager in-
formation on the current energy output of its managed
level in the VPS. To monitor the energy output of a
VPS with multiple VPS managers, as depicted in Fig-
ure 1(c), monitoring needs to distributed. Each VPS
manager within a VPS has an associated resource
monitor. The Resource monitor interacts with the en-
ergy Resource managers and with Resource managers
of subVPS managers to construct reports on current
energy output of the managed level of its associated
VPS manager. Similar to the hierarchy of VPS man-
agers, a hierarchy of resource monitors is created in
which each node in the tree periodically reports its ag-
gregate output of its underlying resources. Each VPS
manager has access to an estimate of the total current
output of its members. The frequency with which ag-
gregation updates are made, f , determines the accu-
racy of these values. In this paper f = 5 minutes is
used, which corresponds to the rate at which the out-
put data for the solar panels changes. This gives a
fairly accurate measurement, though updates are not
synchronised and thus the measurement is not precise.
Increasing f allows us to test the effect of less accu-
rate, less communication intensive, monitoring.
The directory service maintains a list all energy
Resource managers not currently assigned to a VPS.
The directory records resource capacities and loca-
tions. When a VPS manager requires a new resource
it queries the directory to get a list of available re-
source management agents. When a VPS drops a re-
source it is put back into the directory.
The simulation is programmed in AgentScope, of
which the initial version is described in (Oey et al.,
2010), with Platform 9 3/4 as backend.
2.3 Reconfiguration Process
A simple or compound VPS manager locally adapts
the system configuration using heuristics. These
heuristics are for local assessment of over- and un-
derproduction. Choice of reconfiguration actions is
determined on the basis of these local assessments,
and consist of adding and dropping resources, or re-
distribution of target capacities.
Over- and underproduction are determined as fol-
lows. The VPS manager retrieves the current out-
put of its aggregated resources from its local resource
monitor. The difference between its production tar-
get, C
i
(t), and the current output of its underlying
resources E
i
(t) is determined. A set of managed re-
sources is underproducing if it does not meet its pro-
duction target, E
i
(t) − C
i
(t) < 0. A set of managed
resources is overproducing when its production target
is overshot with exactly or more than the production
of its smallest contributing resource, E
i
(t) − C
i
(t) ≥
min
r
j
∈A
i
(t)
e
j
(t).
A simple VPS manager adds a resource to com-
pensate underproduction, or removes a resource to
compensate overproduction. VPS manager can only
modify the status of a single resource during each re-
configuration step. For the sake of simplicity all re-
sources in a managed location are assumed to be sim-
ilar to each other (homogeneous) The responsibility
for the production of the VPS is divided equally over
each of the resources.
A compound VPS managers relies in most cases
on the VPS managers of its managed subVPSs for re-
solve under- and overproduction. Overproduction can
always be handled by subVPSs, as underlying active
resources can be dropped. However, if a configuration
manager of a subVPS is not able to resolve under-
production, i. e. it has no further available resources
to extend the production, the target production for
this subVPS needs to be reduced. The dependencies
within the level of the compound VPS are modified to
redistribute the target capacities. The heuristics used
for this redistribution are to remove 20% of the tar-
ICAART 2011 - 3rd International Conference on Agents and Artificial Intelligence
304

get production set for the subVPS unable to resolve
underproduction, and redistribute this evenly over the
remaining subVPSs, that are still able to extend their
production. If none of the remaining subVPSs is able
to extend its production, then the reconfiguration pro-
cess fails, for which the configuration manager of the
parent VPS is informed, that also this compound VPS
manager is unable to resolve its underproduction.
2.4 Data Sets
Two types of data are important for the purpose of
experimentation: the map dataset and the solar panel
dataset. The map datasets specify (1) the number of
resources, and VPS managers, (2) the organisation
of the VPS, in terms of relations between VPS man-
agers, (3) the the geographical locations/areas of both
resources, and VPS managers (4) the initial VPS con-
figuration specifying allocation of resources, and of
responsibilities. The solar panel dataset specifies the
models to determine the output of each solar panel
within the experiment.
2.4.1 Map Data Sets
Each map has in total 31 nodes, of which 7 virtual
nodes (V = {v
1
, . . . , v
7
}) representing VPS managers,
and 24 representing a solar panel (R = {r
1
, . . . , r
24
}).
The number of virtual nodes that are activated during
a simulation is dependent on the organisation of the
virtual network. In a centralised network only 1 of the
7 virtual nodes is used, in the decentralised version 4
virtual nodes are used, and in the hierarchical network
7 nodes are used. Each virtual node has an overall
target production, dependent on the specific map.
The solar panels are distributed over four geo-
graphical areas. For these experiments, the panels are
distributed evenly over the locations.
Organisational Variations. Dependent on the dif-
ferent organisations the maps are varied. Three varia-
tions are considered, depicted in Figure 1: centralised,
decentralised, and hierarchical.
In a centralised VPS only 1 of the 7 virtual nodes
is used (V = {v
1
}). The centralised VPS has access
to the resources in all four geographic areas, allowing
its resource pool to contain all resources: R
1
= R.
In the decentralised VPS 4 virtual nodes are used
V = {v
4
, . . . , v
7
}, where each virtual node has its own
separate geographical area. The solar panels are dis-
tributed evenly over these four areas, so that each area
has six resources:
• R
4
= {r
1
, . . . , r
6
}
• R
5
= {r
7
, . . . , r
12
}
VPS
panel
panel
panel
panel
panel
panel
panel
panel
panel
panel
panel
panel
(a)
VPS
panel
panel
panel
VPS
panel
panel
panel
VPS
panel
panel
panel
VPS
panel
panel
panel
(b)
VPS
VPS
VPS
VPS
VPS
VPS
VPS
panel
panel
panel
panel
panel
panel
panel
panel
panel
panel
panel
panel
(c)
Figure 1: Visualisations of different organisations of VPS
networks. (a) Centralised VPS network; (b) Decentralised
VPS network; (c) Hierarchical VPS network.
• R
6
= {r
13
, . . . , r
18
}
• R
7
= {r
19
, . . . , r
24
}
The hierarchical VPS is equal to the decentralised
VPS, however with the addition of three VPS nodes,
in which v
2
manages {v
4
, v
5
}, v
3
manages {v
6
, v
7
}
and v
1
manages {v
2
, v
3
}. As {v
1
, v
2
, v
3
} only man-
age virtual nodes (compound VPS managers), their
resource pools are empty: R
1
= R
2
= R
3
=
/
0.
Allocation of Resources and Responsibilities.
This paragraph describes (1) setting production tar-
gets for the virtual nodes, and (2) determining the de-
fined initial configuration. Note that the initial config-
urations match the configurations depicted in Figure
1.
The experiments uses a well-balanced map as a
base case, representing an ideal case, in which the
overall system has been designed for an equal division
of responsibilities. The initial situation/configuration
is also defined as such.
The production target for the central VPS equals
the overall production target (C
1
(t) = C(t)). The pro-
duction target at initialisation (t = 0) is: C
1
(0) = 24.
The initial configuration is: A
1
(0) = {r
1
. . . r
12
}.
The production target for the decentralised VPS is
equally distributed so that the total production meets
the overall production. The production targets at ini-
tialisation are: C
4
(0) = C
5
(0) = C
6
(0) = C
7
(0) =
6. The initial configuration is: A
4
(0) = {r
1
. . . r
3
}.
A
5
(0) = {r
7
. . . r
9
}. A
6
(0) = {r
13
. . . r
15
}. A
7
(0) =
{r
19
. . . r
21
}.
The scenario with the hierarchical VPS is similar
to the scenario with the decentralised VPS, with an
extension for production targets. The production tar-
gets of the additional VPS nodes are such that they
equal the summation of the production targets of the
VPS that each node manages: C
2
(0) = C
3
(0) = 12,
and C
1
(0) = 24.
2.4.2 Solar Panel Data Sets
The scenario includes 3 data sets to examine the out-
DYNAMIC RESOURCE ALLOCATION THROUGH SEMI-STRUCTURED ADAPTATION
305
put of the solar panels. Three data sets are used: two
artificial and one based on real data. The artificially
generated data sets used are stepwise upward output,
stepwise downward output. The model based on real
data is the measured output panel. The artificial pan-
els have been constructed to simulate substantial sud-
den changes.
In stepwise upward output panel, illustrated in
Figure 2(b), a constant output is produced which in-
creases in a single step to a higher constant output.
This panel switches from an average output, to high
output.
In stepwise downward output panel, illustrated in
Figure 2(b), a constant output is produced which de-
creases in a single step to a higher constant output.
This panel switches from an average output, to low
output.
In measured output panel, as illustrated in Fig-
ure 2(c), a solar panel with dynamically gradually
changing power output is simulated, based on mea-
surements of a solar panel over several hours during
noon. It starts with a low power output at the start,
rising to its maximum output at the middle of the day,
and then decreasing its output, on the remainder of
the session. The measurements have been scaled to
the range of the other panels .
(a) (b) (c)
Figure 2: Outputs of the solar panel models. (a) Stepwise
upward output panel; (b) Stepwise downward output panel;
(c) Measured output panel;
3 EXPERIMENTAL RESULTS
This section presents the experimental results of two
sets of experiments: one to explore adaptation speed,
and one to explore the exchange of responsibilities.
For each of the system designs (organised centrally,
decentrally and hierarchically) the resulting output is
presented for the two experiments as are the points
in time at which the VPS nodes perform management
tasks, e. g. adding, dropping or redistributing respon-
sibilities.
3.1 Adaptation Speed Experiment
The adaptation speed experiment illustrates differ-
ences in speed of adaptation comparing a single au-
tonomous point of control versus multiple points of
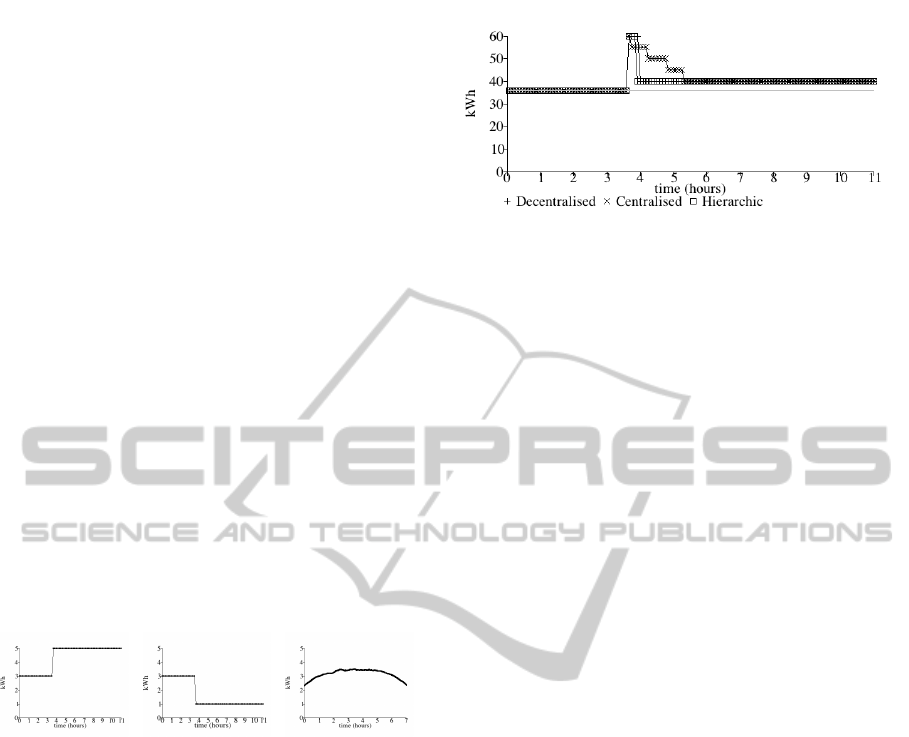
Figure 3: Resulting output when only simple adaptations
are performed. The goal of the overall VPS is to return to
the initial total output, after a sudden increase of production.
control. This experiment is designed to not require re-
distribution of production targets. In this experiment
all solar panels are of type stepwise upward output
panel. In the initial situation each VPS is able to meet
its target output. The stepwise improvement causes
an overproduction which needs to be countered by re-
moving solar panels from the VPSs.
The overall production graphs, in Figure 3, show
a steep increase in overall production when the so-
lar panels increase production: the overall production
increases from 36 to 60. This causes an overproduc-
tion, given that the production target of each approach
is 36. The hierarchical, decentralised and the cen-
tralised approach decrease their production to better
meet their production targets.
The centralised approach has a gradual decrease
in production. It requires 4 sequential steps to reduce
its production from 60 to 40.
The hierarchical and the decentralised approach
are able to quickly reduce their production within a
single time steps. The resulting overall output to
which both approaches converge is 40. The graph
displaying the management interactions of each VPS
node, in Figure 4(b) and 4(c), shows one time steps
in which four VPS nodes concurrently perform ac-
tions to drop solar panels, in order to decrease pro-
duction. The VPS nodes performing these changes
are the lower VPS nodes that are directly managing
the solar panels (v
4
, v
5
, v
6
, v
7
). When the production
of the solar panels increase, all VPSs v
4
, v
5
, v
6
, v
7
have
an overproduction which needs to be reduced. These
VPSs have a local target of 9, and locally their pro-
duction is 15. Each of these VPS managers drop 1 of
their 3 panels.
3.2 Responsibility Exchange
Experiment
This experiment is designed such that half of the net-
work increase production, while the other half de-
creases production. The netto overall output is stable.
ICAART 2011 - 3rd International Conference on Agents and Artificial Intelligence
306
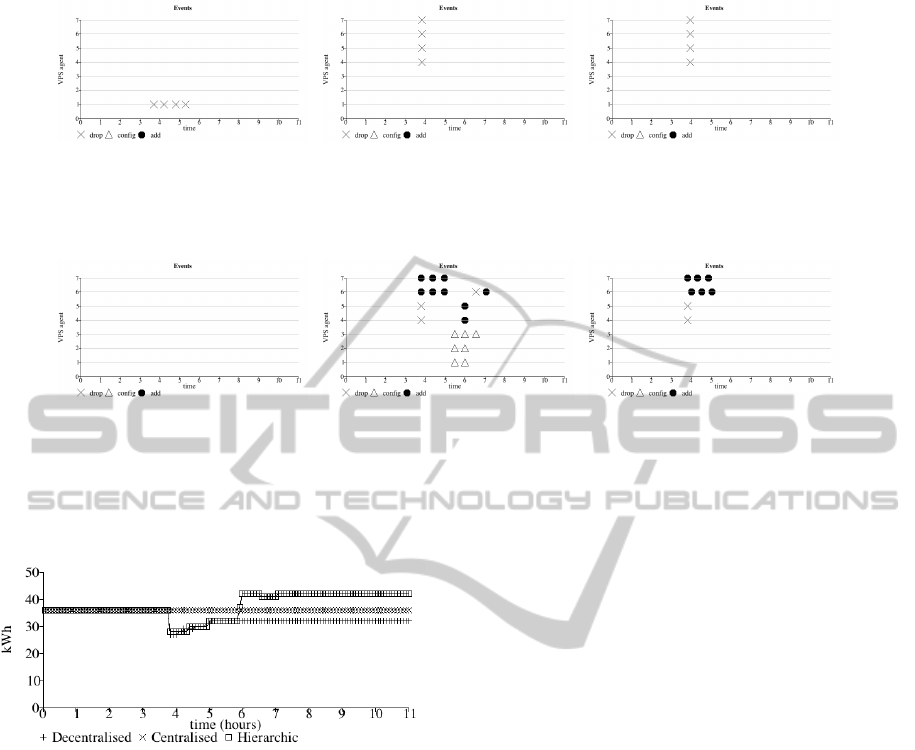
(a) Central Events (b) Hierarchic Events (c) Decentral Events
Figure 4: Resulting events related to the adaptation speed. The centralised approach is limited to sequential modifications,
due to a single VPS manager agent, whereas the hierarchical and decentralised approach use multiple VPS manager agents.
(a) Central events (b) Hierarchic events (c) Decentral events
Figure 5: Resulting events related to the exchange of responsibilities. Half of the solar panels decrease output, and the other
half of the solar panels increase output. The VPS manager in the centralised approach does not observe a change in its overall
output, and performs no actions The VPS managers in decentralised approach only react locally. The VPS managers in the
hierarchical approach react locally and redistribute responsibilities.
Figure 6: Resulting output when responsibilities are ex-
changed. The goal of the overall VPS is to return at least
to the initial total output, after half of the solar panels de-
creased output, and the other half increased output.
However, one part of the network will underproduce
while another part overproduces. In this experiment
half of the solar panels (r1...r12) are of type stepwise
upward output and the other half (r13...r24) are of
type stepwise downward output.
In the initial situation each VPS is able to meet
its target output. The change in production causes
a shift in production at the solar panels. In the cen-
tralised VPS, the VPS manager observes no change
in the overall total output, as the decrease in produc-
tion of half of its managed resources is compensated
by an increase of the other half of its managed re-
sources. For the decentralised and hierarchical VPSs
the change in production results in a strong decrease
in the production on locations R6, R7 and an increase
in production in locations R4, R5. This production
shift results in that local production targets are not
met: locally there is either overproduction or under-
production.
The overall production graph, Figure 6 shows that
the three approaches behave differently. The cen-
tralised approach shows, as its netto production is not
affected, a stable constant output at 36 kWh. The cen-
tralised approach requires no management interven-
tions. The decentralised and hierarchical approaches
show more varying behaviour.
The decentralised VPS is unable to redistribute
production responsibilities, and is limited to meet-
ing its initial local production responsibilities. The
management interactions of the VPS nodes are visu-
alised in Figure 5(c). The VPS nodes managing loca-
tions R4, R5, each have the responsibility to produce
9kWh, which they meet at the initial situation. At
the point of change, their local production increases
from 9 kWh to 15 kWh, which leads to dropping one
of the solar panels reducing the production from 15
kWh to 10kWh, and effectively reducing most local
overproduction. The VPS nodes managing locations
R6, R7, each have the responsibility to produce 9kWh,
which they meet at the initial situation. At the point of
change, their local production decreases from 9 kWh
to 3 kWh, which leads to adding three panels each in
three consecutive steps, after which all panels in the
location are in use. These additions increase produc-
tion from 3 kWh to 6 kWh, still leaving an under-
production of 3 kWh for each of both locations. The
DYNAMIC RESOURCE ALLOCATION THROUGH SEMI-STRUCTURED ADAPTATION
307

overall production eventually results in 32 kWh, re-
sulting in an overall underproduction of 4 kWh, and
not adhering to the overall production target.
The hierarchical VPS is able to redistribute pro-
duction responsibilities, and first adapts to its ini-
tial local production responsibilities, and, after fail-
ing to do so, redistributes the production responsibil-
ities. The management interactions of the VPS nodes
are depicted in Figure 5(b). The VPS nodes man-
aging locations R4, R5, each have the responsibility
to produce 9kWh, which they meet at the initial sit-
uation. At the point of change, their local produc-
tion increases from 9 kWh to 15 kWh, which leads to
dropping one of the solar panels reducing the produc-
tion from 15 kWh to 10kWh, and effectively reducing
most local overproduction.
The VPS nodes v6, v7 managing locations R6, R7,
each have the responsibility to produce 9kWh, which
they meet at the initial situation. At the point of
change, their local production decreases from 9 kWh
to 3 kWh, which leads to adding three panels each in
three consecutive steps, after which all panels in the
location are in use. These additions increase produc-
tion from 3 kWh to 6 kWh, still leaving an underpro-
duction of 3 kWh for each of both locations.
As it is not possible to meet the local production
targets, one of the two underproducing VPSs, in this
case v6 request a redistribution of production target to
v3. Note that both v6 and v7 are requesting redistribu-
tion of production, however, due to the distribution of
control these request will not arrive simultaneously.
The supervising VPS 3 designates part of the target
production of v6 to v7. The production target of v6
is lowered from 9kWh to 7.2 kWh, while the produc-
tion target of v7 is increased from 9 kWh to 10.8 kWh.
This is immediately followed by the request from v7
to redistribute capacity. As the supervising VPS man-
ager v3 is now aware that local redistribution is not
sufficient, it escalates to the root node v1, to redesig-
nate part of the capacity of v3. This effectively assigns
part of the production target from v6 and v7 through
v3 − v1 − v2 to v4 and v5. This is done twice, af-
ter which enough of the production targets is shifted
from the locations with a lowered production, to the
locations with an increased production. There is a
small rebalancing between v6 and v7, which compen-
sates for the first redistribution of production, before
v3 was aware that both subVPSs were unable to meet
their targets.
The overall production eventually results in 42
kWh, resulting in an overproduction of 6 kWh, but
adhering to the overall production target.
3.3 Discussion
The results of the Adaptation speed experiment show
that both the distribution of productional and decen-
tralised approach are able to converge in less time
after substantial changes due to the effect of having
multiple autonomous management nodes, able to re-
act to changes in parallel. The centralised approach is
slower in its convergence, as it has a single point of
control.
The results of the responsibility exchange experi-
ment show that in the non-centralised approach, adap-
tations are required in production targets to be able to
handle non-homogeneous behaviour in different parts
of the network. A purely decentralised approach, with
complete partitioned control, and pre-defined set of
local targets (the initial set), is therefore incapable of
handling this behaviour. The hierarchical approach
that can adapt production responsibilities using only
local reasoning, supports scalable adaptivity. Non-
centralised approaches often lead to an increase in-
efficiency in terms of overproduction, due to the dis-
tribution of the central production target into multi-
ple distributed targets. The requirement that all local
production needs to be equal or larger than the local
production targets, causes more overproduction in the
overall system.
4 EXPERIMENTAL RESULTS
BASED ON REAL WORLD
DATA
The two experiments described in the previous sec-
tion are based on artificial data sets. These data sets
provide a means to analyse the impact of substantial
sudden change within VPSs with different organisa-
tion structures. As the artificial models for the solar
panels are not realistic, two experiments are included
using solar panel models based on measured output of
solar panels.
The main differentiating factors are that the mea-
sured output changes gradually, instead of switching
between two static output values. This section de-
scribes two experiments relating to: the adaptation
speed, and to the exchange of responsibilities with the
real data.
The first experiment, related to the adaptation
speed, creates a situation in which enough spare ca-
pacity is available. All resources are equally dis-
tributed within the overall VPS, and the overall target
output, 24, is lower than the total output of the initial
configuration. The results of this first experiment are
depicted in Figures 7 and 8.
ICAART 2011 - 3rd International Conference on Agents and Artificial Intelligence
308
(a) Central events (b) Hierarchic events (c) Decentral events
Figure 8: Resulting events with real world data,based on VPSs with an equal distribution of resources.
Figure 7: Resulting output with real world data, based on
VPSs with an equal distribution of resources.
The second experiment, related to the exchange
of responsibilities, creates a situation that strains the
overall system. The resources are not equally divided
over the location, and the overall target output, 43,
is set high compared to the total available capacity
within the system. The results of this first experiment
are depicted in Figures 9 and 10.
In general, due to the gradual change, the cen-
tralised approach meets its production target during
most of both experiments. This changes during the
last phase of both experiments. The centralised ap-
proach meets its overall output target slightly more
effectively than the other two approaches. In the last
hour of the two experiments the total reduction in pro-
duction increases despite the addition of a single solar
panel.
Distribution of production targets over multiple
VPS agents in both the decentralised and hierarchical
approaches, effects the time needed to meet the target
total output. The ability to redistribute responsibilities
is clearly illustrated in the second experiment: the de-
centralised approach fails to meets its set target, the
hierarchical approach is able to recover from the un-
equal distribution of resources.
Figure 9: Resulting output with real world data, based on
VPSs with an equal distribution of resources.
5 DISCUSSION AND FUTURE
WORK
This paper focuses on coping with changes in large
distributed systems, and, more specifically, in Dis-
tributed Energy Management. This work extends re-
search described in (Ogston and Brazier, 2009), in-
troducing an agent-based experimental framework to
compare different approaches to appointing auton-
omy and control of resources for Distributed Energy
Resource Management.
The approaches for appointing autonomy and con-
trol explored in this paper are based on centralised,
decentralised, and hierarchical control. The experi-
ments explore the speed at which the overall system
reacts to changes, the ability to reason and act on the
responsibilities of the overall system.
The results show that the centralised approach is
best in handling responsibilities of the overall sys-
tem, due to its knowledge of the overall system, and
its modifications directly effect the satisfaction of the
overall responsibilities. On the other hand, a cen-
tralised approach is, by definition, limited in scala-
bility due to communication overhead.
Distributed approaches adapt the overall system
simultaneously at different nodes, resulting in a
higher flexibility, and a higher speed to complete
complex modifications. Static distribution of respon-
sibilities over subparts of the system provides less
flexibility.
A hierarchical approach supports redistribution
of the responsibilities of the overall system over
subparts, while also responding quickly to system
changes. It combines the strengths of the centralised
and decentralised approach. The hierarchical ap-
proach is scaleable supporting local redistribution of
responsibilities.
More general, the experiments indicate that the
distribution of autonomy and control supports better
management in large-scale distributed systems, with
hierarchical adaptation as an example.
Future work will focus on increasing heterogene-
ity of the scenario integrating other data sets based on
measurements of power output of solar panels, inte-
DYNAMIC RESOURCE ALLOCATION THROUGH SEMI-STRUCTURED ADAPTATION
309

(a) Central events (b) Hierarchic events (c) Decentral events
Figure 10: Resulting events with real world data,based on VPSs with an unequal distribution of resources.
gration of batteries, handling rapidly changing power
outputs, and integration of local power demand. As-
pects of further exploring autonomy and control will
exploring dynamic clustering of pools and VPSs, and
introducing heterogeneous strategies for VPSs.
ACKNOWLEDGEMENTS
The authors thank NGI for their support of this work,
part of the NGI project Self-Managed Dynamic Insti-
tutions in Power Grids: Sharing the Cost of Reliabil-
ity.
REFERENCES
Braun, M. and Strauss, P. (2008). A review on aggrega-
tion approaches of controllable distributed energy unts
in electrical power systems. International Journal of
Distributed Energy Resources, 4(4):297 – 319.
James, G., Peng, W., and Deng, K. (2008). Managing
household wind-energy generation. IEEE Intelligent
Systems, 23(5):9–12.
Kok, J. K., Warmer, C. J., and Kamphuis, I. G. (2005). Pow-
ermatcher: multiagent control in the electricity infras-
tructure. In AAMAS ’05: Proceedings of the fourth
international joint conference on Autonomous agents
and multiagent systems, pages 75–82, New York, NY,
USA. ACM.
Oey, M. A., van Splunter, S., Ogston, E., Warnier, M., and
Brazier, F. M. T. (2010). A framework for devel-
oping agent-based distributed applications. In Pro-
ceedings of the 2010 IEEE/WIC/ACM International
Conference on Intelligent Agent Technology (IAT-10).
IEEE/WIC/ACM. To appear.
Ogston, E. and Brazier, F. M. T. (2009). Apportionment of
control in virtual power stations. In In the proceed-
ings of the international conference on infrastructure
systems and services 2009: Developing 21st Century
Infrastructure Networks.
ICAART 2011 - 3rd International Conference on Agents and Artificial Intelligence
310
