
PREDICTING PERFORMANCE IN TEAM GAMES
The Automatic Coach
Guillermo Jim´enez-D´ıaz
1
, H´ector D. Men´endez
2
, David Camacho
2
and Pedro A. Gonz´alez-Calero
1
1
Complutense University of Madrid, Computer Science Department, Madrid, Spain
2
Universidad Aut´onoma de Madrid, Computer Science Department, Madrid, Spain
Keywords:
Videogames, Clustering.
Abstract:
A wide range of modern videogames involves a number of players collaborating to obtain a common goal.
The way the players are teamed up is usually based on a measure of performance that makes players with a
similar level of performance play together. We propose a novel technique based on clustering over observed
behaviour in the game that seeks to exploit the particular way of playing of every player to find other players
with a gameplay such that in combination will constitute a good team, in a similar way to a human coach.
This paper describes the preliminary results using these techniques for the characterization of player and team
behaviours. Experiments are performed in the domain of Soccerbots.
1 INTRODUCTION
Online games are the fastest growing market in en-
tertainment. A key feature that explains online game
success is their social nature. In these games, players
collaborate and compete against other players around
the world. An online multiplayer match can be ar-
ranged basically in two ways, either a group of friends
configure their own match to play together, or an in-
dividual player joins a match from a list of matches
currently in progress in the server.
Most online multiplayer games offer an entrance
hub for matchmaking. The matchmaking process
helps individual players to find a match where they
are likely to have an enjoyable gameplay experience.
The most sophisticated matchmaking services pro-
vide recommendations based on the player skill level.
The best known skill rating system is the Elo system
(Elo, 1978), adopted by the World Chess Federation
to rank chess players, which is also used as a rat-
ing system for multiplayer competition in a number
of computer games. The TrueSkill
TM
rating system
(Herbrich et al., 2006) is an evolution of the Elo sys-
tem and it is employed in the Xbox Live online gam-
ing system.
Matchmaking based on the players skill level as-
sumes that games have to be balanced in order to be
fun to play. However, this assumption is clearly re-
stricted for multiplayer games, where different play-
ers usually adopt different roles in the team, and per-
formance as well as gameplay satisfaction depends on
the careful combination of roles. Just imagine a soc-
cer team with only goalkeepers.
We propose to extend matchmakingin multiplayer
online games with information about the particular
abilities of the players that make them more apt for
playing a given role in the team. For such a match-
making approach it should be possible to infer the best
role for a player based on his observed behaviour in
the game. This paper demonstrates that it is possible
to do using classification and clustering techniques.
The rest of the paper runs as follows. Next Sec-
tion briefly introduces the classification and clustering
techniques used in the paper. Section 3 describes the
experimental setup in the Soccerbots domain, while
Section 4 presents the experimental results. Finally, in
Section 5, conclusions and future work are discussed.
2 CLUSTERING BEHAVIOURS
There has been used different approximations based
on Machine Learning and Data Mining to model the
player behaviour. These approaches, usually named
human or robot behaviour modelling, has been ap-
plied in different domains like Robossocer simula-
tions (Grollman and Jenkins, 2007; Aler et al., 2009;
401
Jiménez-Díaz G., D. Menéndez H., Camacho D. and A. González-Calero P..
PREDICTING PERFORMANCE IN TEAM GAMES - The Automatic Coach.
DOI: 10.5220/0003185104010406
In Proceedings of the 3rd International Conference on Agents and Artificial Intelligence (ICAART-2011), pages 401-406
ISBN: 978-989-8425-40-9
Copyright
c
2011 SCITEPRESS (Science and Technology Publications, Lda.)

Leng et al., 2010). In this work some popular meth-
ods from Data Mining (Larose, 2005), such as clus-
tering or classifiers algorithms, are combined to ex-
tract the behaviour of players during a game session,
and to classify how they are is playing against their
opponents. The proposed techniques are exemplified
using simulations of soccer matches with robots, so
the techniques are employed to characterize the be-
haviour of a team and its individual robots during a
soccer match.
To apply Data mining methods it is usually nec-
essary to make an intensive phase of data preprocess-
ing. Initially the information must be analysed and
stored in some kind of database system, cleaned and
separated. This preprocessing phase is used to avoid
outliers, missclassifications and missing data. The
second step is related to normalization. It allows to
compare data features with different kind or range of
values. Z-Score (Carroll and Carroll, 2002) and Min-
Max (Han and Kamber, 2006) normalization methods
are commonly used for preprocessing the data.
Both normalization algorithms takes the attribute
records and they try to find a standard range for them.
Min-Max has a fixed range, [0,1], while Z-Score de-
pends of mean and standard deviation. These algo-
rithms obtain the normalized values from data using
the following equations:
• Min-max: It computes maximum and minimum
values of the attributes and it applies the equation:
x
′
=
x− min(X)
max(X) − min(X)
• Z-Score: It computes mean and standard devia-
tion of the values and it applies the equation:
x
′
=
x− mean(X)
SD(X)
Once data is preprocessed and normalized, a high
number of possible data mining methods could be
used to analyse it. We have selected some popular
Classification and Clustering algorithms. C4.5 (Quin-
lan, 1993) and CART (Breiman and Stone, 1984)have
been employed to extract information from different
datasets. We have employed these methods to ana-
lyze the strategies of the whole teams using the match
results, i.e. comparing the time in a particular zone,
the number of kicks or the distance to the center of
the field for each player. These algorithms allow to
automatically compare (classify) how the teams are
playing using the individual results from each player.
The main problem with these algorithms is the length
of trees generated. C4.5 and CART algorithms are not
able to directly process the huge amount of data (see
Section 3), so a binning method (Larose, 2005) has
been used to control the tree’s size.
Finally, clustering methods have been used to
classify what kind of behaviour (offensive, defensive,
or balanced) is deployed by a particular team in a
match. Simple algorithms such as statistical algo-
rithms (Expectation Maximization, EM) or K-means
have been tested to compare the available matches.
With these methods it is possible to establish the real
behaviour of a team and then automatically classify
them using their behaviour.
2.1 A Short Description on Clustering
and Classification Algorithms
From the wide area of clustering and classification
methods, only several well known algorithms have
been selected to evaluate how these techniques can be
used to automatically extract the behaviour of teams
and the team members. From classification methods,
some popular approaches are based on decision trees.
In these algorithms a tree is built from scratch using a
set of values that characterizes a feature. These trees
are usually employed to extract a set of rules that later
can be used to classify a new pattern. The algorithms
used in this work to compare the results obtained by a
particular team using their results in a gameplay are:
• C4.5 (Quinlan, 1993) is an extension of ID3 al-
gorithm (Quinlan, 1986). Both algorithms use the
concept of information entropy reduction. C4.5
has the main following characteristics: it produces
a tree of more than one variable shape; for cat-
egorical attributes it produces a separated branch
for each value of the categorical attribute; and it
uses entropy reduction methods to select the opti-
mal split. The entropy reduction method consists
on (Larose, 2005):
– Split the records into subsets by choosing a in-
stance or candidate.
– The mean information of each subset is calcu-
lated as the weighted sum of the entropies for
the individual subsets.
– Once the mean information is computed for all
the candidates, the information gain for each of
them is calculated, it is based on the entropy.
– The candidate split that has the greatest infor-
mation gain is chosen.
– Finally, the process continues recursively until
all the instances are classified.
• CART (Breiman and Stone, 1984) is another pop-
ular algorithm that builds a binary tree using op-
timal splits. These optimal splits are chosen ac-
cording to a criteria based on a measure of the
ICAART 2011 - 3rd International Conference on Agents and Artificial Intelligence
402

“goodness” of a candidate split at a node. This
measure is calculated using the neighbor nodes
and conditional probability on the records con-
ditionated to these nodes. The optimal split is
whichever split that maximizes this measure over
all possible splits at the selected node. Recur-
sively, CART splits the records in the training data
set into subset of records with similar values for
the target attribute (Larose, 2005).
Finally, the clustering algorithms used to classify
the real observed behaviour in a set of gameplays (we
call them the team behaviour) are:
• Expectation-Maximitation (Robert Hogg and
Craig, 2005), or simply EM, is a blind clustering
algorithm that tries to classify and create the clus-
ters for the data. This algorithm is useful when
data is hidden or missed. Initially, it takes a like-
lihood and tries to maximize it. The process con-
sists on apply the two following steps iteratively
until it finishes:
– Expectation step: Calculate the expected value
of the log-likelihood function and redefine it.
– Maximization step: Find the parameter that
maximizes the likelihood function.
• K-means (MacKay, 2003) is another popular and
well knownalgorithm. It is a straightforward clus-
tering guided method (usually by a heuristic or di-
rectly by a human) to try to classify data in a fixed
number of clusters. The number of clusters can
be predefined or it can be estimated using heuris-
tics or other kind of algorithms, like genetic algo-
rithms (Gonzalez-Pardo et al., 2010). This algo-
rithm runs in 5 steps (Larose, 2005):
– Define (fix) the number of clusters (k).
– Assign k records to be the initial cluster center
location.
– For each record, find the nearest cluster center.
– For each of the k clusters, find the cluster cen-
troid, and update the location of each cluster
center to the new value of the centroid.
– Repeat the two last steps until a convergence
criteria or a termination condition is reached.
3 EXPERIMENTAL SETUP
The approaches described in this paper has been
tested using a dataset generated using Soccerbots.
Soccerbots
1
simulates the dynamics and dimensions
1
Soccerbots: http://www-2.cs.cmu.edu/∼trb/TeamBots/
Domains/SoccerBots/
of a regulation RoboCup small size robot league
game. Two teams of five robots compete in a soc-
cer field by pushing and kicking a ball into the oppo-
nent’s goal. This simulator has been employed as a
sandbox in several works related to the application of
different machine learning techniques in multiagent
systems (Aler et al., 2009; Leng et al., 2010).
The data has been extracted using SBTourna-
ment
2
, a tool for generating Soccerbots tournaments
and trace generation of robot behaviour. SBTour-
nament extracts periodically the position, direction
and velocity for every robot and the ball during a
match. Additionally, the kick actions and goals are
asynchronously extracted. SBTournament uses these
traces to generate CSV files about every robot, team
and matches played. Finally, the dataset employed
in our evaluation has been enhanced computing some
statistical data extracted from the CSV files, described
below.
The dataset contains information about ∼ 15000
matches played by 74 different teams implemented by
students of Computer Science at Complutense Uni-
versity of Madrid during different academic courses.
There are three different types of information con-
tained in the dataset:
Information about each Robot. The dataset stores
statistics about every robot that has participated
in a match. For every match and every robot, we
have the number of goals scored and kicks per-
formed, the time the robot spent in its own field
and opponent field and in its own and in the op-
ponent goalkeeper area, the time the robot spent
in “ball possession” and the average distance be-
tween the robotand the ball, the center of the field,
its own goal and the opponent goal.
Information about each Team during a Match.
The information about each robot is compiled
for generating the global statistics for each team
during the match. These team statistics contain
the aggregation and the average values from
every feature extracted from the robots that make
up the team, such as the number of goals scored
and received by the team, the sum up of the team
robot kicks, the average time that the team robots
spent in their own field and in the opponent field
or the total time that the team robots spent in “ball
possession”, among others.
Global Information about every Team. Using the
information about a team during all the played
matches we generate a set of descriptive statistics
that summarizes the global team behaviour. These
2
SBTournament: http://gaia.fdi.ucm.es/projects/
soccerBots/SBTournament 1.2.zip
PREDICTING PERFORMANCE IN TEAM GAMES - The Automatic Coach
403

statistics contain information about the number of
goals scored and received by the team, the number
of wins, lost and ties or the total number of kicks
performed, among others.
For testing our clustering methods we have to
choose the best soccer teams, as we will describe in
Section 4.3. These teams have been selected from the
winners of the tournaments
3
. celebrated every year at
the Complutense Universityof Madrid with the robots
implemented by the students –the robots employed to
create the dataset.
4 RESULTS
The data previously described has been processed fol-
lowing the steps described in the next subsections in
order to allow their automatic analysis.
4.1 Preprocessing
The CSV files described in Section 3 were separated
in two groups: individual player results and team re-
sults. These data are used to analyze how the player
behaviour influences on the team.
Owing to the fact that the program can be config-
ured with different match time, the data needs to be
normalized (see Section 2). A min-max standardiza-
tion is the easiest way to join this data and it simpli-
fies the binning methods, although other normaliza-
tion method like Z-Score was used. Some characteris-
tics in the data (like different time duration in matches
played) affect negatively to mean and standard devia-
tion in the normalization process.
4.2 Exploratory Data Analysis
4.2.1 The Goals-kicks Results
The first approximation of the data analysis reveals
that there are few strategies with satisfactory results.
These strategies are divided on defensive, balanced
and offensive. It is worth noting that a player gets
better scores when it drags the ball instead of kick it.
4.2.2 Type of Player
The exploratory data analysis reveals that the play-
ers have different behaviours that can be related be-
tween them. Choosing these special situations, the
data shows that a few of players have special features.
These players are categorized in:
3
The final results of these tournaments are available at
http://gaia.fdi.ucm.es/grupo/software.html
• Keeper. This player is always close to the goal
area. It also kicks frequently the ball. The pattern
is based on the attributes ‘time spend in own goal’,
‘time spend in own field’, ‘distance to the ball’,
‘number of kicks’ and ‘distance to the own goal’.
• Defender. This player usually stands in its field
side, except when an opponent is close to the cen-
ter or it takes the ball. The pattern is based on the
attributes ‘time spend in own field’, ‘time poses-
sion’ and ‘distance to the center’.
• Midfield player. This kind of player has a ran-
dom behaviour. Usually, the whole team is ini-
tially programmed to have only midfield players.
The pattern is based on the attributes ‘time spend
in own field’, ‘time spend in opponentfield’, ‘time
posession’ and ‘center distance’.
• Kicker-Forward. This kind of player usually
stands in the opponent field side, close to the cen-
ter. When it takes the ball, it tries to kick it.
The pattern is based on the attributes ‘time spend
in opponent field’, ‘time posession’, ‘center dis-
tance’, ‘number of kicks’ and ‘opponent goal dis-
tance’.
• Dragger-Forward. This player also stands in the
opponent field side, but when it takes the ball, it
drags the ball to the opponent goal. The pattern
is based on the attributes ‘time spend in opponent
field’, ‘time posession’, ‘center distance’, ‘num-
ber of kicks’, ‘opponent goal distance’ and ’time
spend in the opponent goal’.
4.2.3 Type of Team
The team behaviour is similar to the player behaviour.
Following the same analysis criteria, the teams can be
divided into three different main categories:
• Defensive. This kind of team usually plays in its
field side. It usually has a keeper and at least a
couple of defenders.
• Offensive. This kind of team usually plays closed
to the center. It has no keeper, and normally the
players do not spend too much time in its own
area.
• Balanced. A balanced team mixes the previous
behaviour. This kind of team is the most difficult
one to be (automatically) discriminated because
the behaviour of the team can evolve from defen-
sive to offensive, or vice versa, during the match.
4.2.4 Decision Trees (C4.5/CART)
The initial analysis shows different strategies that the
teams have used. Therefore, it is important to classify
ICAART 2011 - 3rd International Conference on Agents and Artificial Intelligence
404
them with their results. Decision trees allow to ana-
lyze the result of the classification showing rules that
could be generated by a good or a bad result based on
the initial data. Binning the data, the size of the tree
generated by CART and C4.5 and their accuracy are
shown in table 1.
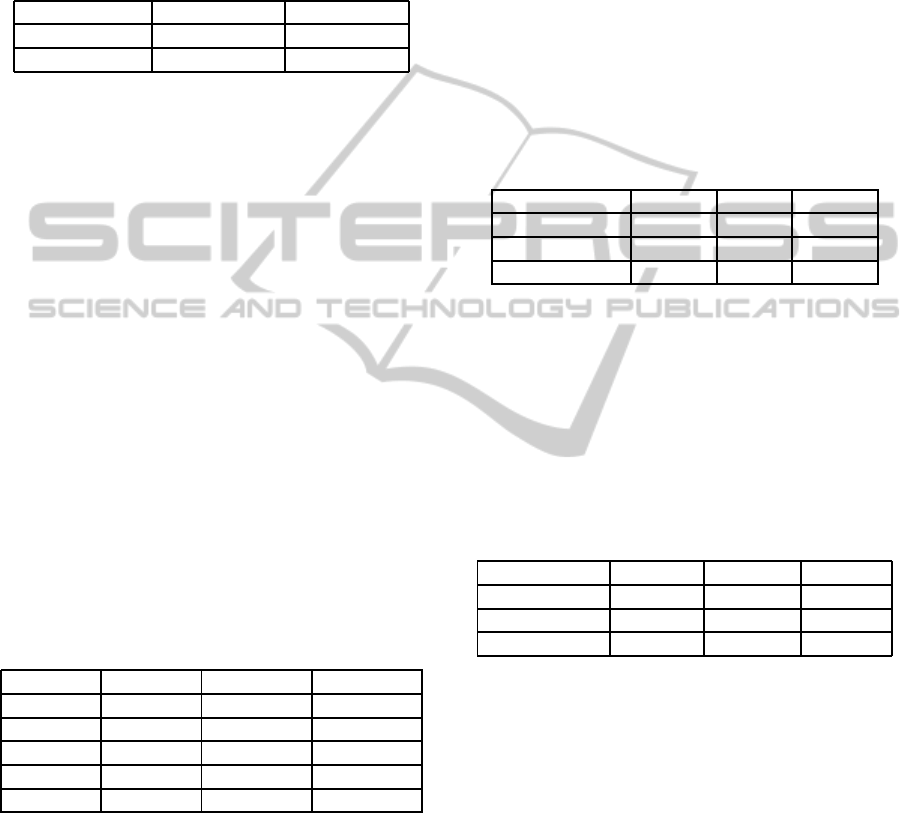
Table 1: Leaves and accuracy percentage.
C4.5 CART
Goals Against 783 (87,7%) 121 (87,6%)
Goals For 2980 (57,6%) 277 (57,8%)
These results show that it is easier to classify a
bad strategy than a good one. This result demon-
strates that they have no similar behaviour to obtain
their goals. For this reason, clustering methods have
been selected to classify teams behaviour instead of
their strategy.
4.2.5 Clustering (EC/K-Means)
After the strategy classification, the teams were clas-
sified using the clustering methods. The results are
depicted in Table 2, which shows the results of sev-
eral variations in EM and K-Means algorithms with
team data. For every algorithm, it shows the number
of clusters generated and the percentage of instances
that belongs to the cluster (if there are more than one
cluster, the percentage of each cluster has been in-
dicated). First, Expectation-Maximization algorithm
has been tested with all the data and with the normal-
ized data. Finally, K-means classification has been
tested choosing k values from 4 to 6 clusters.
Table 2: Clusters classification. For each algorithm, the ta-
ble contains the number of clusters and the percentage of
instances classified in each cluster.
Algorithm Offensive Defensive Balanced
EM 1/30% 1/25% 2/33%,12%
EM (Nor.) 0 0 1 / 100%
4-Means 1/34% 1/25% 2/14%,27%
5-Means 1/32% 2/25%,13% 2/11%,20%
6-Means 2/27%,7% 2/23%,12% 2/11%,20%
Clustering shows that the teams have similar be-
haviours during the matches. The criteria of each be-
haviour has been described in previous section.
Clusters also show that there are teams that fol-
low multiple behaviours and teams that only follow an
specific behaviour. This result explains why it is dif-
ficult to classify the balanced behaviour. 6-means al-
gorithm also classifies correctly the team results. This
information helps us to find a good opponent for each
team, and it will be used for the testing phase.
4.3 Tests
The best teams of the tournaments –described in Sec-
tion 3– have been classified using previous approach.
With the clusterings methods previously described the
results are used to define what kind of opponents are
“good” opponents against them.
4.3.1 Testing the Model
Table 3 contains the statistics about the global results
performed by the best teams. The best teams have
achieved a high number of winnings and ties but a
small number of looses.
Table 3: Best teams results.
Team Won Lost Tie
ISBCUnited 68,5% 1,75% 29,75%
JGDTeam 70,25% 3,5% 26,25%
WetTunaTeam 66,60% 5,25% 28,15%
The analysis results of the best teams behaviour
based on 6-means is shown in Table 4. This table
shows the percentage of team instances that belongs
to each cluster over the total instance number. These
tables show that the best teams have a defensive pro-
file while their offensive profile is reduced. It could
be the reason because they also have a high percent-
age of tie games.
Table 4: Best teams classification.
Team Offensive Defensive Balanced
ISBCUnited 3% 61,5% 35,5%
JGDTeam 11,11% 51,24% 37,65%
WetTunaTeam 7,98% 81,72% 10,3%
Tables 5 summarizes the behaviour of one of these
teams against its best opponents, selected for testing
the model. The table shows the rate of winnings and
their the classification of 6-means cluster for these
teams. This simple analysis provides a good exam-
ple about how the proposed approach can be helpful
when it is necessary to find a good team.
• Table 5 shows the teams that have defeated ISB-
CUnited. These results show that defensive teams
are usually more efficient than offensive teams.
Nevertheless, completely and middle offensive
behaviours also obtain goods results.
PREDICTING PERFORMANCE IN TEAM GAMES - The Automatic Coach
405
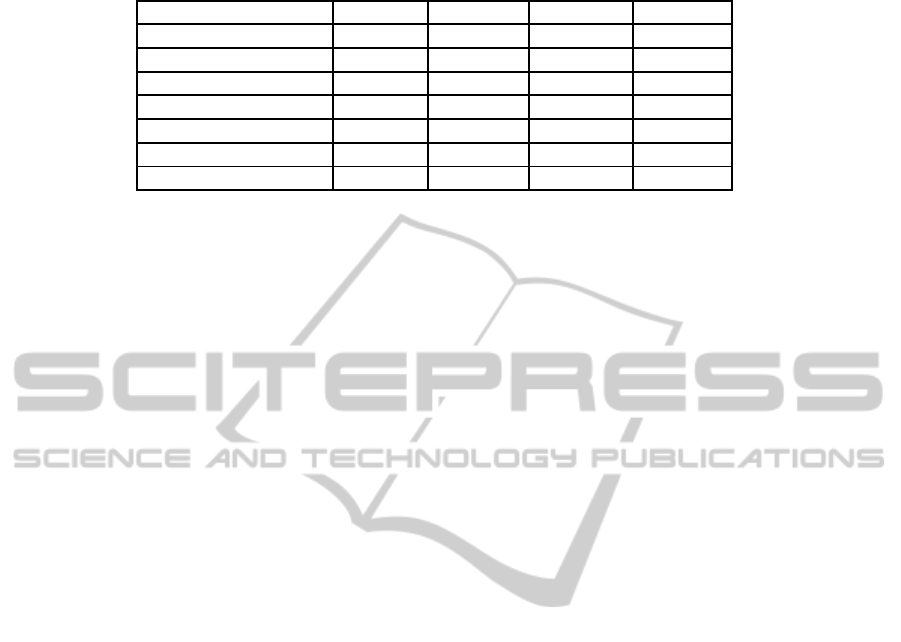
Table 5: ISBCUnited best opponents.
Team Victories Offensive Defensive Balanced
MetalTeam 12,5% 50,01% 20,98% 29,01%
AmigosDeGattuso 12,5% 5,88% 93,28% 0,84%
D2JTeam 12,5% 10,49% 88,89% 0,62%
DJBTeam 12,5% 11,42% 83,33% 5,25%
JMPTeam 12,5% 100% 0% 0%
FourtyTwoTeamCBR 6,25% 43,75% 16,75% 39,5%
EspartanosRBR 6,25% 9% 83,75% 7,25%
5 CONCLUSIONS AND FUTURE
WORK
This paper has presented some preliminary results
about the use of classification and clustering tech-
niques employed for characterizing the behaviour of
a player during a gameplay in order to find interest-
ing players to play with. The techniques employed
and their results seem to be promising. They can be
applied to team-up human players or to find compat-
ible bots to play with human players. We intend to
explore the application of these techniques in other
games with actual human data.
Our future work is related with the generation of
promising teams. We want to create a team with play-
ers of different teams and check how a player influ-
ences in the composition of its team. This kind of
automatic human-like behaviours analysis could be
easily extended to other domains such as computer
(online) games or virtual worlds.
ACKNOWLEDGEMENTS
This work has been partly supported by: Span-
ish Ministry of Science and Education under grant
TIN2009-13692-C03-03, TIN2010-19872 and Span-
ish Ministry of Industry under grant TSI, 020110-
2009-205.
REFERENCES
Aler, R., Valls, J. M., Camacho, D., and Lopez, A. (2009).
Programming robosoccer agents by modeling human
behavior. Expert Systems with Applications, 36:1850–
1859.
Breiman, L., F. J. O. R. and Stone, C. (1984). Classifica-
tion and Regression Tree. Wadsworth & Brooks/Cole
Advanced Books & Software.
Carroll, S. R. and Carroll, D. J. (2002). Statistics Made
Simple for School Leaders. Rowman & Littlefield.
Elo, A. E. (1978). The rating of chess players: Past and
present. Arco Publishing, New York.
Gonzalez-Pardo, A., Granados, A., Camacho, D., and Ro-
drguez, F. D. (2010). Influence of music representa-
tion on compression-based clustering. In IEEE World
Congress on Computational Intelligence, pages 2988
– 2995. IEEE.
Grollman, D. H. and Jenkins, O. C. (2007). Learning
robot soccer skills from demonstration. In Inter-
national Conference on Development and Learning,
pages 276–281.
Han, J. and Kamber, M. (2006). Data mining: concepts and
techniques. Morgan Kaufmann.
Herbrich, R., Minka, T., and Graepel, T. (2006).
Trueskill
tm
: A bayesian skill rating system. In
Sch¨olkopf, B., Platt, J. C., and Hoffman, T., edi-
tors, Advances in Neural Information Processing Sys-
tems 19, Proceedings of the Twentieth Annual Con-
ference on Neural Information Processing Systems,
pages 569–576. MIT Press.
Larose, D. T. (2005). Discovering Knowledge in Data. John
Wiley & Sons.
Leng, J., Fyfe, C., and Jain, L. (2010). Reinforcement
learning of competitive skills with soccer agents. In
Knowledge-Based Intelligent Information and Engi-
neering Systems, volume LNCS 4692, pages 572–579.
Springer.
MacKay, D. (2003). Information Theory, Inference and
Learning Algorithms. Cambridge University Press.
Quinlan, J. R. (1993). C4.5: Programs for Machine Learn-
ing. Morgan Kaufmann Publishers.
Quinlan, R. J. (1986). Induction of decision trees. Machine
Learning, 1:81–106.
Robert Hogg, J. M. and Craig, A. (2005). Introduction to
Mathematical Statistics. Pearson Prentice Hall.
ICAART 2011 - 3rd International Conference on Agents and Artificial Intelligence
406
