
DEVELOPMENT AND VALIDATION OF A PRESSURE
TRANSDUCER AND ITS ELECTRONICS FOR ESOPHAGEAL
MANOMETRY
D. S. Ferreira, L. M. Gonçalves, J. H. Correia and G. Minas
Algoritmi Centre, Universidade do Minho, Campus Azurém, 4800-058 Guimarães, Portugal
Keywords: Manometry, Esophageal motility disorders, Solid-state strain gauge.
Abstract: This paper reports the development and validation of strain gauge transducers and its readout electronics
with the ultimate goal of integration in a commercial endoscopic capsule (EC). The deposition process of
strain gauge transducers on a capsule surface, using microfabrication techniques, is described. An electronic
circuit is designed, implemented and tested for the amplification of the transducer output signal.
Electromechanical tests are performed on a cylindrical tube, which simulates the capsule weight and
dimensions, and the obtained results allowed establishing a correlation between the output signal and the
stress applied on an EC. These results represent an important step for the implementation of a more
advanced capsule manometry system.
1 INTRODUCTION
The gold standard for the assessment of esophageal
motor functions is manometry. With this technique it
is possible to measure pressure changes that reflect
the strength and timing of muscles contraction and
relaxation. The major indications for esophageal
manometry are the evaluation of dysphagia and non-
cardiac chest pain. Esophageal manometry is, as
well, the standard method to establish the diagnosis
of: achalasia - low repetitive amplitude contractions
(10-40 mmHg); diffuse esophageal spasm -
uncoordinated contractions (>30 mmHg); and
Nutcracker esophagus - high-amplitude peristaltic
pressure waves (>180 mmHg) (Murray, 2003;
Holloway, 2006; Bodger, 2006; Pandolfino, 2009).
Manometry equipment is composed by two
major components: a pressure transducer and a
recording system. The transducer element can be a
water-perfused catheter connected to external
transducers, or intraluminal solid-state strain gauge
transducers. These are used to determine pressure
profiles in the esophageal sphincters and body, and
to convert it into an electrical signal. Although being
more expensive, solid-state manometry devices
present some important advantages: they have much
higher frequency response characteristics, and they
require less technical expertise to use (Murray,
2003; Holloway, 2006; Bodger, 2006).
Solid-state strain gauges are based on the
piezoresistive effect, i.e. there is a change of
electrical resistance upon mechanical deformation of
the surface where they are attached to. These are
usually placed in a Wheatstone bridge configuration,
with all resistors attached to the mechanical surface
to minimize the effect of temperature.
(Wolffenbuttel, 1994). The output signals of the
bridge, which provide a direct measure of
intraluminal pressure, are amplified before being
recorded on a computer for further data processing
and analysis (Murray, 2003; Bodger, 2006).
More recently, the basic format of manometric
studies has been replaced by intraluminal pressure
topography plots. This novel technique is known as
high-resolution manometry and its concept consists
in miniaturizing and increasing the number of
transducers on the manometric instrument, so that it
is possible to define the pressure profile as a spatial
continuum (Bodger, 2006; Pandolfino, 2009).
The long term of this project is to integrate
manometry functions within a commercial
endoscopic capsule (EC), using solid-state strain
gauge transducers. Some capsules, such as the pH
and pressure capsule, have incorporated a single
solid-state transducer to record mechanical events.
397
Ferreira D., Gonçalves L., Correia J. and Minas G..
DEVELOPMENT AND VALIDATION OF A PRESSURE TRANSDUCER AND ITS ELECTRONICS FOR ESOPHAGEAL MANOMETRY.
DOI: 10.5220/0003169303970400
In Proceedings of the International Conference on Biomedical Electronics and Devices (BIODEVICES-2011), pages 397-400
ISBN: 978-989-8425-37-9
Copyright
c
2011 SCITEPRESS (Science and Technology Publications, Lda.)
However they are not yet able to record images from
the gastrointestinal tract (Camilleri, 2008). With the
very promising developments on the capsule
locomotion and stopping mechanisms, the addition
of manometry functions as a complement to existent
EC imaging functions will be of great clinical utility.
Using microtechnologies it is possible to build
small transducers on the capsule surface. These
technologies enable implementation of many
transducers that can record pressure values all
around the capsule area. As a first step, the
deposition process of strain gauge transducers is
studied and described. Also, an electronic circuit for
the readout of the transducer output signal is
designed and implemented. The proper functioning
of the circuit will be first tested using a commercial
strain gauge transducer. The results of the system
performance and amplification circuit are described.
2 EXPERIMENTAL
2.1 Fabrication of Transducer Element
The transducer element can be fabricated with thin-
film deposition and patterning processes. However,
some constrains were already studied and must be
considered during the fabrication process: the
polymer of current available EC cannot support
temperatures above 120 ºC and is incompatible with
chemicals (solvents) used in some photo-
lithographic processes; and the curved surface of EC
limits the use of rigid lithographic masks.
The fabrication of the sensing element starts with
a polyimide film (5 mm in length and width, and a
thickness of 25 µm). Next, a chromium layer is
deposited in the polyimide film by e-beam. A
photoresist mask is created by lithography processes
to be used in the wet-etching of the chromium film.
The polyimide film is then etched, using the
chromium pattern film as mask. This patterned
polyimide film is after used as shadow mask in the
deposition of metal in the EC. A shadow mask
process allows the fabrication of the transducer
element, despite the constraints previously
considered. The mask is glued to the EC surface
before the deposition of a thin metal layer. Since
there is only a single mask, there are no concerns
regarding its alignment. The metal deposition occurs
through the etched region of the polyimide mask,
creating regions were metal will be deposited, and
regions without metal, forming the transducer
element in the EC. After the deposition, the mask is
removed, exposing the transducer that should be
encapsulated with a biocompatible polymer. Due to
the mentioned fabrication constraints, the deposition
process is being optimized for the capsule surface
polymer, and is currently in progress.
2.2 Circuit Design
For the circuit design and test, one commercial
solid-state strain gauge transducer was connected in
a quarter Wheatstone bridge configuration (Figures
1 and 2). The transducer length and width is equal to
5 and 1.8 mm, respectively, and it has a resistance of
120 ± 5%. Since our surface is not planar we will
not use two gauges because it cannot be assured the
same proportion of compressive and tensile stress in
both transducers. Also, an in vivo study of Cowles et
al. (1978) found that mechanical events recordings
obtained from a one quarter Wheatstone bridge
transducer were of the same quality as those
produced by a one half bridge configuration, in
terms of accuracy, sensitivity and stability.
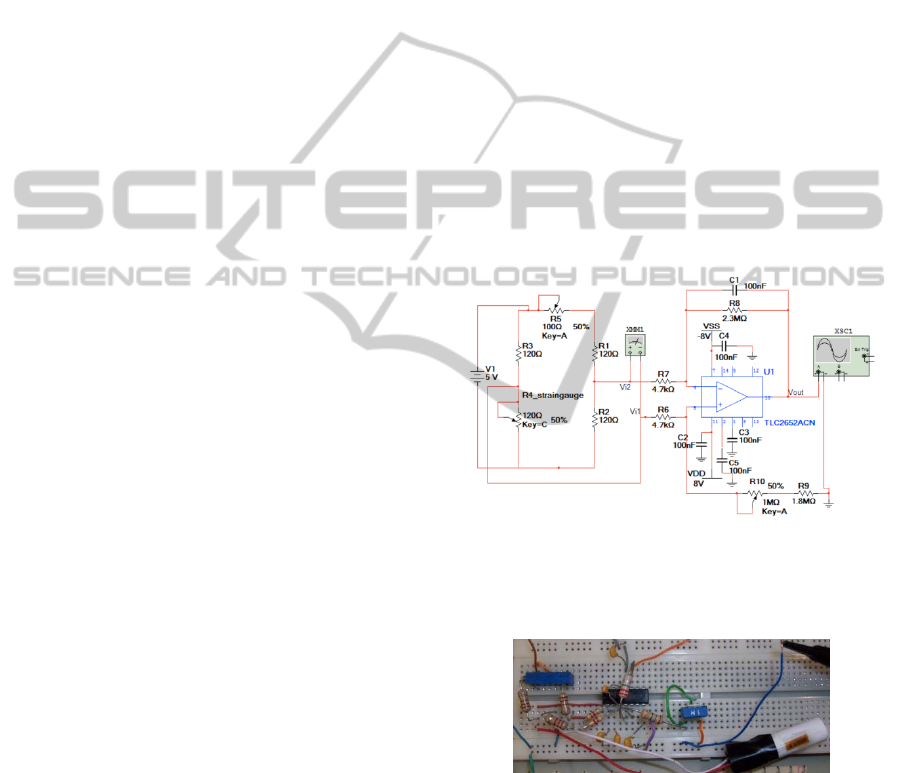
Figure 1: Layout of the system circuit with a differential
amplifier, TLC2652CN, to increase the amplitude of the
bridge output signal. The TLC2652CN features low offset
voltage 1PV with -0.003 V/°C, and a CMRR of 120 dB.
Figure 2: Implementation of the circuit on a breadboard.
The strain gauge was glued to a cylindrical tube
using cyanoacrylate glue. The gauge lead out wires
were then soldered to electrical wires and mounted
on a breadboard, in a bridge circuit, together with
three resistors - R1, R2 and R3 - of the same value
(120 ). The multi-turn potentiometer (R5) is used
to compensate the resistance tolerance of the bridge
BIODEVICES 2011 - International Conference on Biomedical Electronics and Devices
398

resistors. Several capacitors are used to minimize the
noise introduced by the power supply.
The Wheatstone bridge output (V
out2
) is
calculated using Equation 1 (Buchla, 1992), where R
is equal to 120 , R corresponds to the strain
gauge resistance variation (directly correlated with
the applied stress), and V
ref
is equal to 5 V.
=
−
=
.
∆
(1)
The transducer output is transmitted to an
amplifier with a gain of 500. The output signal (V
out
)
from the amplifier is expressed as:
=
.
−
(2)
For the circuit to work as a differential amplifier:
=
(3)
Due to the mismatched of the resistors tolerance,
which in our circuit is amplified by a factor of 4, the
errors that can be introduced are in the order of 20%:
≈
4
1
00
=0.2
(4)
where p is the resistors tolerance and H is the
fractional difference between the two ratios. To
solve this mismatch we can use high precision
resistors, but a more cost-effective solution for a
printed circuit board is the addition of a
potentiometer (R10) in series with R9, to adjust
Equation 3 and balance the circuit. Therefore, we
will have a fixed and a variable resistor:
=
−
4
100
.
= 1.84
(5)
=2.
4
100
.
= 0.92
(6)
2.3 Electromechanical
Characterization
The effects of applied displacement in the
piezoresistive gauge, attached to a cylindrical
surface, were investigated under a three point
bending test. There are many techniques to assess
the gauge mechanical behavior, but three point
bending test has the advantage of being simple and
reproducible (Schriefer, 2005). The test was
performed in an AG-IS Shimadzu testing machine
with a load cell of 1 KN. The cylindrical tube was
positioned for transversal loading with a distance
between the lower supports (L) of 10 mm.
The ultimate stress (
V
, in MPa) was calculated
using the force (F, in N) versus displacement curves
(obtained directly from the testing machine), and the
following equation:
=
4
(7)
where I is the second moment of area (in mm
4
). For
a circular cross section I is calculated as follows:
=
4
(8)
in which R is the tube radius (equal to an available
EC radius, 5.5mm) (Schriefer, 2005).
3 RESULTS AND DISCUSSION
In order to test the reliability and calibrate the
electronic circuit with applied stress, the transducer
was glued on a cylindrical tube, and a three point
bending test was performed. The test was carried out
to simulate the mechanical functions of the
esophageal sphincters.
With the testing machine four cycles of
displacement were applied with a maximum
displacement of 0.02 mm. A constant speed of
0.1 mm/min was used, and the force-displacement
data was collected every second (Figure 3).
Figure 3: Representative force-displacement graph.
From the above data, the values of force at each
displacement could be determined. The strain gauge
transducer’s resistance variation was also measured
during the four cycles of displacement (Figure 4). As
would be expected, the transducer’s electrical
resistance variation is proportional to the mechanical
deformation: it reaches its maximum variation
(119.518 ), compared to its initial value at 0 mm,
when the displacement is equal to 0.02 mm.
Simultaneously, output voltages (V
out
) were
recorded using a data acquisition platform (Arduino
Uno) and a LabView interface. This software
platform makes it possible to process and display
0.000
0.005
0.010
0.015
0.020
0.025
0.00 0.50 1.00 1.50
Displacement (mm)
Force (N)
DEVELOPMENT AND VALIDATION OF A PRESSURE TRANSDUCER AND ITS ELECTRONICS FOR
ESOPHAGEAL MANOMETRY
399

Figure 4: Transducer’s resistance variation with applied
displacement, for all the four cycles.
pressure-voltage data in real-time. The stress was
then calculated using Equations 7 and 8, and the
stress-output voltage curve was traced (Figure 5).
In Figure 5 one of the cycles is represented, and
it can be concluded that the bridge output voltage is
nearly proportional to the mechanical stress applied
on the tube. With this result it will be possible to
establish a correlation between the measured voltage
and the stress induced on a capsule while travelling
in the esophagus.
Figure 5: Representative stress-ouput voltage graph.
The main goal of the experiment was to verify
this stress-voltage relation which was achieved for
circuit calibration and for a further implementation
in a microelectronics process, like CMOS.
4 CONCLUSIONS
There is a great interest in developing
gastrointestinal manometry systems using solid-state
strain gauge transducers. Manometry techniques,
using long catheters have the potential to be replaced
by more comfortable and simple procedures using
endoscopic capsules. We report the design and
performance of a strain gauge transducer and its
readout circuit, calibrated for the measurement of
the induced stress on endoscopic capsules. The
initial results obtained make it possible to go a few
steps further in system miniaturization and
integration and represent a very important step for
the development of a more advanced capsule
manometry system. In the future, we aim to improve
and integrate all the readout circuit within a CMOS
chip. Moreover, we want to optimize the transducer
deposition process, overcoming the constraints
related with the capsule polymeric material.
ACKNOWLEDGEMENTS
This research was supported by the Portuguese
Foundation of Science and Technology and the
MIT|Portugal Program (SFRH / BD / 38978 / 2007).
The author acknowledges Vitor Sencadas, Hélder
Covas and Leandro Cruz, for all their supportive
assistance during mechanical and electronic tests.
REFERENCES
Bodger, K., Trudgill, N., 2006. Guidelines for oesophageal
manometry and pH monitoring. BSG Guidelines in
Gastroenterology, 1-12.
Buchla, D., 1992. Applied Electronic Instrumentation and
Measurement, Merrill, New York.
Camilleri, M. et al., 2008. American
Neurogastroenterology and Motility Society consensus
statement on intraluminal measurement of
gastrointestinal and colonic motility in clinical
practice. J Neurogastroenterol Motil., 20, 1269-1282.
Cowles, V. E. et al., 1978. A Quarter Wheatstone Bridge
Strain Gage Force Transducer for Recording Gut
Motility. Digestive Diseases, 23, 936-939.
Holloway R. H., 2006. Esophageal Manometry. GI
Motility online.
Murray, J. A., Clouse, R. E., Conklin, J. L., 2003.
Components of the standard oesophageal manometry.
Neurogastroenterology And Motility, 15, 591-606.
Pandolfino, J. E., Fox, M. R., Bredenoord, A. J., Kahrilas,
P. J., 2009. High-resolution manometry in clinical
practice: utilizing pressure topography to classify
oesophageal motility abnormalities.
Neurogastroenterology And Motility, 1-11.
Schriefer, J. L. et al., 2005. A comparison of mechanical
properties derived from multiple skeletal sites in mice.
Journal of Biomechanics, 38, 467-475.
Wolffenbuttel, R. F., Schekkerman, A. R., 1994.
Integrated Instrumentation Amplifier for the Phase
Readout of Piezoresistive Strain Gauges. IEEE
Transactions on Instrumentation and Measurement,
43, 906-911.
119.516
119.518
119.520
119.522
119.524
119.526
119.528
119.530
0.000
0.005
0.010
0.015
0.020
0.025
0 20406080100
Resistance ()
Displacement (mm)
Time (sec)
Displacement
Resistance
-90
-75
-60
-45
-30
-15
0
0 50 100 150 200
Output Voltage, V
out
(V)
Stress (mmHg)
BIODEVICES 2011 - International Conference on Biomedical Electronics and Devices
400
