
SPECTRAL ANALYSIS OF THE CEREBRAL ACTIVITY
DURING VOLUNTARY MODULATION OF MENTAL STATES
A High Resolution EEG Study
J. Toppi
1,2
, F. Babiloni
3
, F. Cincotti
2
, F. De Vico Fallani
2,3
, G. Vecchiato
2,3
, S. Salinari
1
D. Mattia
2
and L. Astolfi
1,2
1
Dept. of Computer Science and Systems, Univ. of Rome “Sapienza”, Rome, Italy
2
IRCCS “Fondazione Santa Lucia”, Rome, Italy
3
Dept. of Physiology and Pharmacology, Univ. of Rome “Sapienza”, Rome, Italy
Keywords: High Resolution EEG, Spectral Cortical Maps, Mental Imagery Task, Correction for Multiple Comparisons,
False Discovery Rate correction, Bonferroni correction.
Abstract: In the neuroscience field, the use of advanced techniques of EEG recording and analysis, led to look for
adequate methodology to prevent type I errors, which occur in computing thousands of univariate tests in
order to highlight the brain areas in which significant activity arises. In this paper we illustrate the capability
of tracking the brain activity during tasks consisting in tennis playing imagery and spatial navigation
imagery, by using advanced high resolution EEG methodology accompanied by the use of appropriate
statistical techniques that takes into account the risk of the Type I errors. Results showed that in the Spatial
Navigation condition the power spectra activity is significantly different from the rest in the bilateral
parietal areas and left motor area, while in the Tennis condition the cortical activity differs from the rest in
bilateral parietal areas and in the left sensory-motor cortex. These preliminary findings are in partial
accordance with previous hemodynamic studies.
1 INTRODUCTION
The rationale beyond this study relies on some
considerations about the use of adequate statistical
techniques in the framework of the
neuroelectromagnetic brain mapping.
With the use of advanced EEG/MEG recording
setup, involving a high number of sensors and
thousands of sources, the issue of the protection
against the Type I errors that could occur during the
execution of a high number of univariate statistical
tests has become of relevance.
Considering that in neuroscience, thousands of
univariate tests are performed to highlight the brain
areas in which significant activity arises, to seek for
adequate methodology to prevent this type I errors
has remarkable importance.
In this paper we illustrate the capability of
tracking the brain activity during some mental
imagery tasks (Owen et al., 2006), by using
advanced high resolution EEG methodology in the
time and frequency domains, accompanied by the
use of appropriate statistical techniques that takes
into account the risk of the Type I errors.
2 METHODS
2.1 Experimental Design
Five healthy volunteers took part in the experiment.
All the subjects were informed about the aim of the
EEG recording and signed an informed consent.
Subjects seated in front of a monitor. They executed
one of the three fixed imagery task (Play Tennis,
Relax or Imagine to visit the rooms of your house)
according to the position of a red target on the
screen (Figure 1).
The experiment was divided into 6 sessions of 18
trials each (6 for each task), with events randomly
ordered within each session. We set a task length of
15s and an inter-trial interval of 2s.
A 61-channel system was used to record EEG
potentials by means of an electrode cap. Sampling
rate was 200 Hz. EEG signals were then band pass
285
Toppi J., Babiloni F., Cincotti F., De Vico Fallani F., Vecchiato G., Salinari S., Mattia D. and Astolfi L..
SPECTRAL ANALYSIS OF THE CEREBRAL ACTIVITY DURING VOLUNTARY MODULATION OF MENTAL STATES - A High Resolution EEG Study.
DOI: 10.5220/0003168902850288
In Proceedings of the International Conference on Bio-inspired Systems and Signal Processing (BIOSIGNALS-2011), pages 285-288
ISBN: 978-989-8425-35-5
Copyright
c
2011 SCITEPRESS (Science and Technology Publications, Lda.)

filtered (1-45 Hz) and eye movements were removed
from recordings utilizing Independent Component
Analysis (ICA). For the EEG analysis we considered
the interval [5:10] seconds in the middle of task
execution.
Figure 1: Stimulation window used for the experiment.
Subjects were asked to execute a particular task of mental
imagery according to the position of a red target on the
screen.
2.2 High Resolution EEG
High-resolution EEG technologies have been
developed to enhance the spatial information content
of EEG activity.
Accurate estimates of the cortical current density
could be obtained by using adequately detailed
geometrical reconstruction of the main
compartments lying between the cortical generator
sources and the EEG sensors. These estimates can be
obtained by solving a linear problem (Babiloni et al.,
2005), by means of a transfer matrix (lead field
matrix) that mimics the effects of the volume
conductor. In mathematical terms the relationship
between the modeled sources x, the lead field matrix
A, the EEG measurements b and the noise n can be
written as
Ax = b + n (1)
The solution of this linear system provides an
estimation of the dipole source configuration x that
generates the measured EEG potential distribution b.
The system includes also the measurement noise
n, assumed to be normally distributed. A is the lead
field or the forward transmission matrix, whose j-th
column describes the potential distribution generated
on the scalp electrodes by the j-th unitary dipole.
The current density solution vector ξ was
obtained as:
(
)
2
2
2
minarg
NM
A xbx
x
λξ
+−=
(2)
where M, N are the matrices associated to the
metrics of the data and of the source space,
respectively, λ is the regularization parameter and
|| x ||
M
represents the M norm of the vector x. The
solution of Eq. (2) is given by the inverse operator
G:
Gbξ
=
(3)
(
)
1
111
−
−−−
+
′′
= MAANANG
λ
(4)
An optimal regularization of this linear system was
obtained by the L-curve approach.
Using the relations described above, an estimate
of the signed magnitude of the dipolar moment for
each one of the 5,000 cortical dipoles was obtained
for each time point.
2.3 Spectral Cortical Activity
From the cortical waveforms, we estimated the
spectral activity, during the considered task time
interval, for each one of the 5 thousands dipoles of
the cortical model used.
T-test values obtained from comparisons
between Tennis-Rest and Navigation-Rest were then
mapped on the cortical model in different frequency
bands, defined according to Individual Alpha
Frequency (IAF) to take into account inter-
individual differences in localization of alpha band.
The IAF, defined as the individual frequency peak
within the alpha band, was determined from the Fast
Fourier Transform spectra over posterior leads
(parietal, parieto-occipital, and occipital).
Individually defined bands considered were:
Theta (IAF-6 / IAF-2), Alpha (IAF-2 / IAF+2), Beta
(IAF+2 / IAF+14) and Gamma (IAF+15 / IAF+30).
The uncorrected Student’s test and the appropriate
techniques of the False Discovery Rate (FDR) (Yoav
and Yekutieli, 2001) and the Bonferroni correction
for multiple comparisons were applied to the
evaluation of the power spectral maps estimated
from the data.
3 RESULTS
By following the procedure and the methods
illustrated above, we obtained statistical scalp and
cortical maps for each frequency band of interest
and experimental condition.
In the following figures, T-test values,
BIOSIGNALS 2011 - International Conference on Bio-inspired Systems and Signal Processing
286
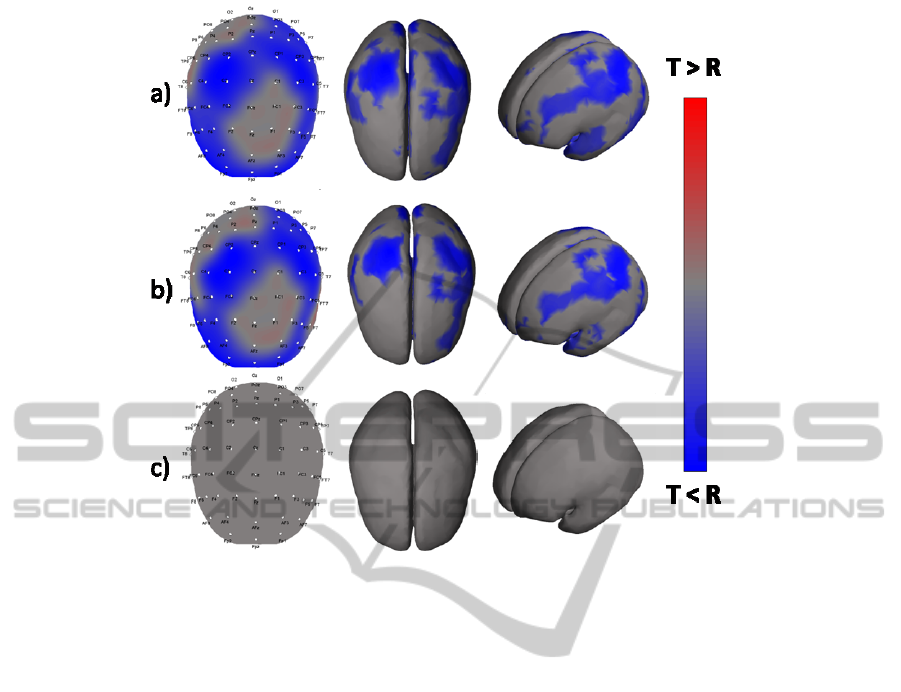
Figure 2: Statistically significant spectral maps in the Alpha band, depicted on the average brain model used in the analysis.
The color scale codes for the value of the t-test in that pixel for the comparison Tennis versus Rest, in three different
cases: a) no correction; b) False Discovery Rate; c) Bonferroni.
corresponding to a statistical significance of 0.05,
were mapped on scalp and cortical average model in
three different cases: no correction for multiple
comparisons (panel a), FDR correction (panel b) and
Bonferroni correction (panel c). The head is seen
from above, with the nose pointing down. For each
comparison, only frequency bands with significant
statistical activations are presented.
In Fig. 2 we show results in a representative
subject, describing the statistically significant
spectral maps in the Alpha band for the contrast
Tennis task (T) versus Rest condition (R).
Scalp maps, obtained without applying any
corrections for multiple comparisons (Figure 2a)
reveal a decrease of EEG activity in Tennis task on
electrodes located in the posterior areas, in the
central part of right side of the head and in the
frontal region. Cortical maps lead to a better
localization of deactivated areas, in particular in the
bilateral parietal lobes and left motor cortex.
In both scalp and cortical maps the corrections
for multiple comparisons, needed to prevent Type I
errors, brings to a decrease of the number of
activated pixels on the cortex model. In particular,
low reduction in the size of activated areas is shown
for FDR correction (Figure 2b), while no significant
activations survive using Bonferroni methods
(Figure 2c).
In Fig. 3 we show results in a representative subject,
describing the statistically significant spectral maps
in the Alpha band for the contrast Navigation task
(N) versus Rest condition (R). Significant
activations on scalp model, not corrected for
multiple comparisons, result in left parietal and
central areas (Figure 3a). Cortical maps lead to a
better localization of deactivated area, in particular
in the bilateral parietal and left motor area. Low
reduction in the size of activated areas both on scalp
and cortical model, is shown for FDR correction
(Figure 3b). No significant activations were found
using Bonferroni correction for multiple
comparisons (Figure 3c).
4 CONCLUSIONS
Thanks to the high resolution EEG techniques and
the appropriate use of statistical methods, we tracked
the subject’s brain activity during different
imagination tasks. Analyzing the effect of the two
methods of correction for multiple comparisons on
SPECTRAL ANALYSIS OF THE CEREBRAL ACTIVITY DURING VOLUNTARY MODULATION OF MENTAL
STATES - A High Resolution EEG Study
287
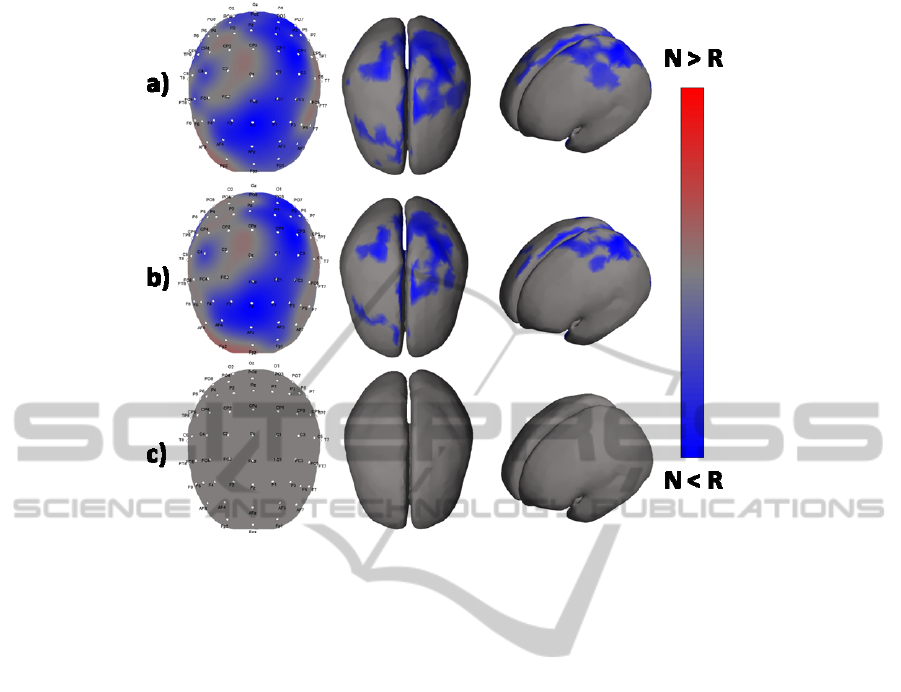
Figure 3: Statistically significant spectral maps in the Alpha band, depicted on the average brain model used in the analysis.
The color scale codes for the value of the t-test in that pixel for the comparison Navigation versus Rest, in three different
cases: a) no correction; b) False Discovery Rate; c) Bonferroni.
the estimated areas, the technique of False
Discovery Rate results as a good compromise to
prevent both type I and type II errors. In fact in the
Bonferroni method, the increased incidence of false
negative led to non-physiological results.
As a whole, these results suggest that the high
resolution EEG spectral mapping opens a way to
address the analysis of brain imaginative functions,
allowing to discriminate between different mental
states without the limitations of the use of an fMRI
scanner.
ACKNOWLEDGEMENTS
This work was supported by the European ICT
Program FP7-ICT-2009-4 Grant Agreement 247919
DECODER.
REFERENCES
Babiloni F. et al., 2005. Estimation of the cortical
functional connectivity with the multimodal
integration of high resolution EEG and fMRI data by
Directed Transfer Function. Neuroimage.
Owen A. M. et al, 2006. Detecting Awareness in the
Vegetative State. Science.
Yoav B. and Yekutieli D., 2001. The control of the false
discovery rate in multiple testing under dependency.
The Annals of Statistics.
BIOSIGNALS 2011 - International Conference on Bio-inspired Systems and Signal Processing
288
