
A REAL-TIME CELL PROLIFERATION AND MOTILITY
MONITORING SYSTEM
Nicola Moscelli, Sander van den Driesche, Michael J. Vellekoop
Institute of Sensors and Actuator Systems, Vienna University of Technology, Gusshausstrasse 27-29/E366, Vienna, Austria
Wojciech Witarski
Institute of Virology, Slovak Academy of Sciences, Dubravska Cesta 9, Bratislava, Slovak Republic
Keywords: Optical detection, CCD sensor, Real-time monitoring, Epithelial cells.
Abstract: In this contribution we present a compact imaging system to monitor the proliferation and the motility of
cells in real-time. Our monitoring system is compatible with standard multi-well plates and operates in CO
2
,
temperature and humidity controlled cell-culture incubators. Adherent grown epithelial cells in a multi-well
plate well, positioned on top of a custom made holder, have been monitored in real-time with a fixed CCD
image sensor. As light source an LED is placed above the plate holder. A field of view of 3.3 × 2.5 mm
2
was achieved by using a 4.6 × 4.0 mm
2
image sensor and mini lens system. The image sensor has a
resolution of 640 × 480 pixels. Consequently, the obtained sensing resolution of the imaging system is about
5 μm. The cell monitoring system has first been validated by visualizing micro-beads of known dimensions.
Then, our system has been successfully tested, tracking the migration paths and proliferation of respectively
adherent grown MDCK (Madin-Darby canine kidney) and A549 (human lung carcinoma) epithelial cells.
1 INTRODUCTION
The study of cell motility is of importance to
understand the mechanisms related to many
physiological and pathological processes such as
tumour progression and immunological responses
(Suresh, 2007). A commonly used technique to track
and quantify cell motility is by conducting gold
colloidal phagokinetic assays (Niinaka, 2001):
because of their movement, the adherently grown
cells displace gold monodisperse nanoparticles
deposited on the substrate, tracing clearly visible
paths. This technique is attractive for time-lapse
measurements, where the preservation of optimal
cultivation conditions such as fixed temperature,
humidity, oxygen and CO
2
levels for biological
culture growth is required. In order not to influence
the cultivation conditions during cell proliferation
and motility experiments, lab microscopes are
normally equipped with additional expensive stages
to control temperature, humidity, and CO
2
levels
(Poujade et al., 2007). Our proposed real-time
imaging system is a compact and low-cost
alternative to such an optical setup: it can be
operated in standard lab incubators and is also
compatible with unmodified lab disposables. Gabriel
et al. have presented a real-time cell monitoring
solution for incubator comprising a contact imaging
device. These devices are based on an image sensor
array directly in contact with the sample to be
investigated (Gabriel et al., 2009). However, this
proposed imaging device needs ad hoc modified lab
disposables and an elaborate cleaning step when
serial experiments are desired. Moreover, unlike
conventional optical imaging systems, where the
resolution depends on the pixel number and the lens
magnification, contact imaging devices have a
resolution which depends on the pixel size together
with the distance between the object and the sensor
surface (Ji et al., 2007). This limits the suitability of
such devices, because the sensor needs to be
decoupled by the biological sample to preserve its
functionality.
In the following section, we provide a
description of our monitoring system setup. In
Section 3 we present and discuss the validation tests
and the cell monitoring experiments.
230
Moscelli N., van den Driesche S., Vellekoop M. and Witarski W..
A REAL-TIME CELL PROLIFERATION AND MOTILITY MONITORING SYSTEM.
DOI: 10.5220/0003167002300233
In Proceedings of the International Conference on Biomedical Electronics and Devices (BIODEVICES-2011), pages 230-233
ISBN: 978-989-8425-37-9
Copyright
c
2011 SCITEPRESS (Science and Technology Publications, Lda.)
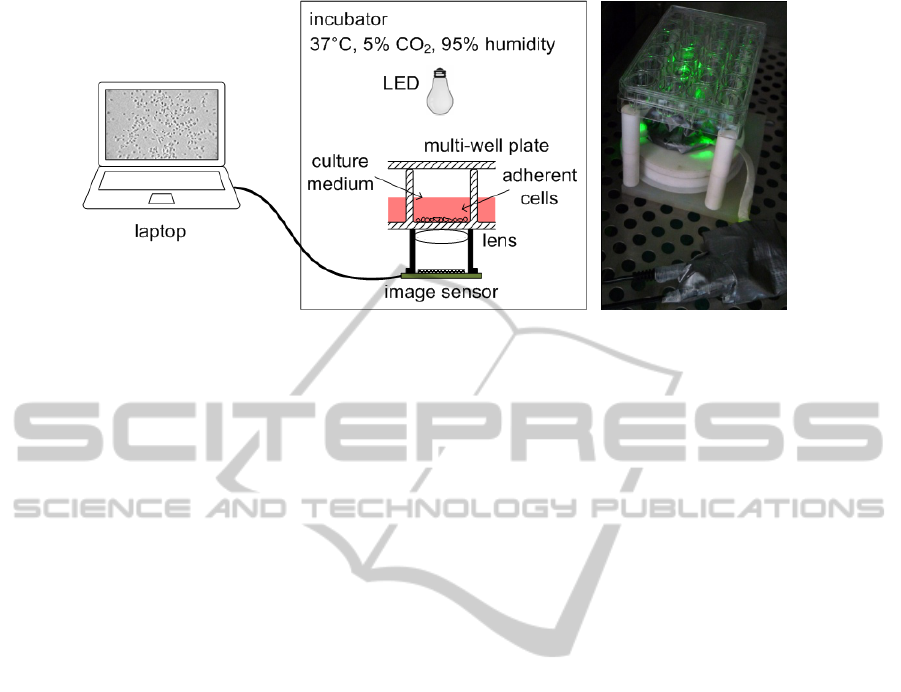
Figure 1: (a) Schematic of the monitoring system setup; (b) Photograph of the system with a 24-well plate in the incubator.
To withstand the high humidity condition inside the incubator, the sensor and the printed circuit board have been
hermetically sealed with Parafilm and Duct tape.
2 SENSOR SYSTEM
Our monitoring system operates with standard
disposable multi-well plates. A multi-well plate is
positioned on top of a custom made Teflon holder. A
CCD sensor (Sony ICX-098BQ with Fire-i Digital
Remote Camera Board) is placed underneath the
multi-well plate, aligned and fixed in close
proximity to the well containing the biological
sample. The image sensor features a resolution of
640 × 480 pixels over a surface of 4.6 × 4.0 mm
2
.
Together with a mini lens, the sensor is capable to
focus over an area of 3.3 × 2.5 mm
2
, yielding to an
overall optical resolution of approximately 5 µm in
both dimensions. The CCD sensor is capable of
progressive scanning, and thus full frame non-
interlaced acquisition. Typical image acquisition
settings (frame rate, shutter, gain, gamma, white
balance, black level) are fully adjustable in order to
obtain the finest image conditions. Moreover, the
sensor is placed on a remote unit which allows
minimal area encumbrance under the multi-well
plate. A schematic representation and a photo of the
optical imaging system setup are depicted in Fig. 1.
In order to prevent condensation on the electronics
due to high humidity conditions in the incubator, we
sealed the sensor and the PCB with several layers of
polymeric films and tapes (Parafilm and Duct tape),
as depicted in Fig. 1b. A 10° angle focused
illumination is provided by a LED light source
(Luxeon Star/O) mounted orthogonally at 20 cm
distance over the multi-well plate. Vertical
illumination from the top of the biological sample is
attractive to minimize light scattering through the
radiation path (the light radiation has to cross the
cover lid of the multi-well, the cultivation medium,
the cells, and the bottom substrate of the well). The
cells are almost transparent and therefore hard to be
optically detected, if high light scattering occurs.
The supplied power for the LED was about 36 mW;
during our tests in incubator, no noticeable
overheating has been experienced.
3 RESULTS AND DISCUSSION
3.1 System Validation
In order to characterize our imaging system, we have
visualized particles of known shape and size. For
this scope, we have selected monodisperse non
transparent polystyrene spherical beads with a
diameter of 12 µm (Sigma Aldrich Fluka 885110).
In Fig. 2 the sedimented beads imaged by our
system are shown. The pixel distribution has been
determined by visualizing four individual beads and
two beads in close proximity. The comparable
intensity distributions of the four individual beads
show that each bead corresponds approximately to a
2 × 2 pixel matrix. This result is consistent with the
calculated optical system resolution of 5 × 5 µm
2
per
pixel. Also, the image shows the feasibility to
clearly discriminate between two beads in close
proximity, as long as the distance between them
measures more than one pixel.
(
b
)
(
a
)
A REAL-TIME CELL PROLIFERATION AND MOTILITY MONITORING SYSTEM
231
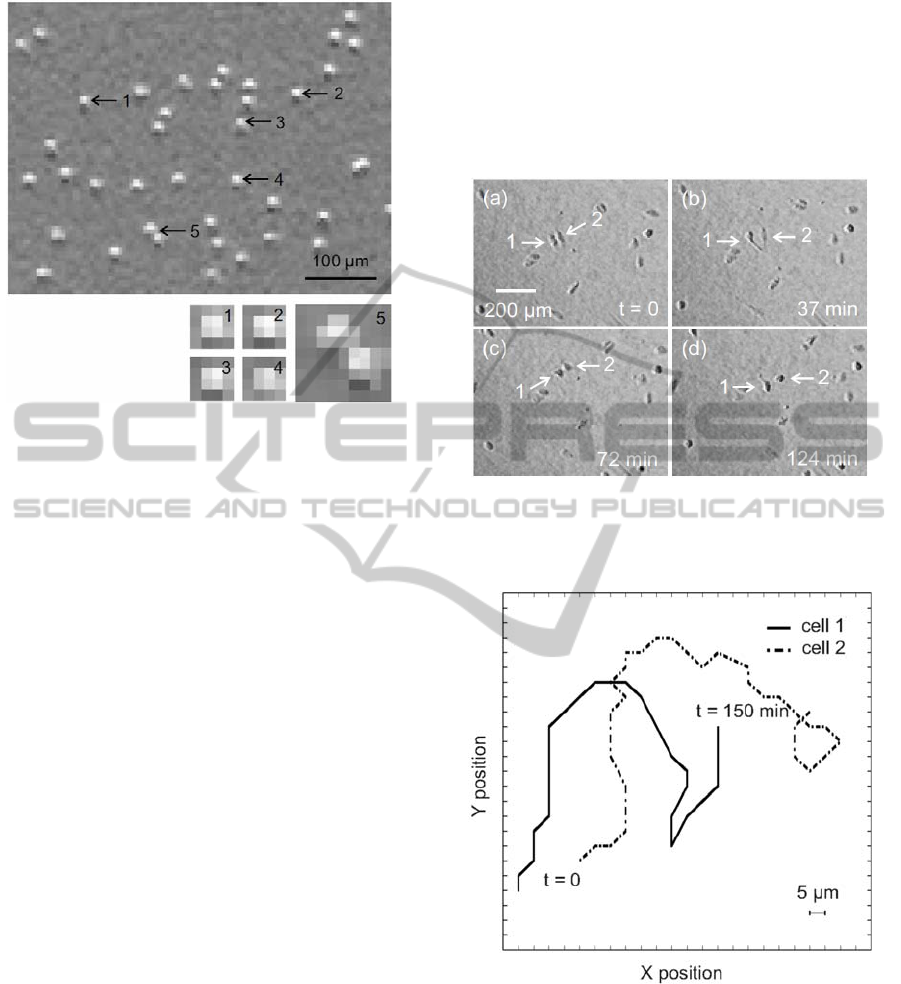
Figure 2: On top, individual polystyrene spherical beads of
12 µm diameter observed with our imaging system; below,
magnified pixel distributions of four different single beads
(1 to 4) and two beads in close proximity (5).
3.2 Cell Monitoring
We have tested our optical system with two different
epithelial cell lines: human carcinomic alveolar
basal (A549, ATCC CCL-185) and Madin-Darby
canine kidney cells (MDCK, ATCC CCL-34). The
cultivation media consisted of DMEM (Dulbecco's
Modified Eagle Medium) with 4.5 g/L glucose, 10%
fetal calf serum, 2 mM L-glutamine, and antibiotics.
The cells have been incubated at 37°C and with 5%
CO
2
concentration (a NAPCO CO
2
1000 incubator
was used).
In a first experiment, we have tracked the
motility of adherently grown individual MDCK
cells. In order to promote cell movement, HGF
(Hepatocyte Growth Factor) in a concentration of 50
ng/ml has been added to the cell sample under
investigation. The frame-capture rate of the sensor
system has been set to one frame each 3 minutes,
which was sufficient enough to detect changes of
cell position within the parameters of this
experiment. After the cells have sedimented and
attached to the bottom of the well, their activity has
been recorded for 2.5 hours. In Fig. 3a-d, four
frames highlight the movement of two cells. The
pictures illustrate only a section of the detected area.
Also the migration paths covered by the two cells
during the 2.5 hours experiment time frame are
plotted (see Fig. 4). The trajectories of the cells have
been obtained with MATLAB software (MathWorks
Inc.) by extracting the coordinates of the cells per
each recorded frame. During the 2.5 hours
observation, both cells have covered a distance of
about 220 µm, which corresponds to a velocity of
about 1.5 µm/min. The detected migration paths
shown demonstrate that the achieved pixel
resolution of our system is adequate for epithelial
cell motility studies.
Figure 3: (a) ‒ (d) Frames showing sparse MDCK cells in
movement: cell positions as well as morphological
changes during motion are clearly detectable.
Figure 4: Migration trajectories of the two selected cells
during the 2.5 hours experiment; in that period both cells
covered a distance of about 220 µm, which corresponds to
a velocity of about 1.5 µm/min.
In a second experiment, we have observed the
proliferation of adherently grown A549 epithelial
cells in sparse concentration. Identical sensor
recording settings were kept for this second
measurement. In Fig. 5 a 2 hours time lapse of
dividing A549 cells is depicted in 8 frames. The
pictures clearly illustrate cell division in all its
BIODEVICES 2011 - International Conference on Biomedical Electronics and Devices
232
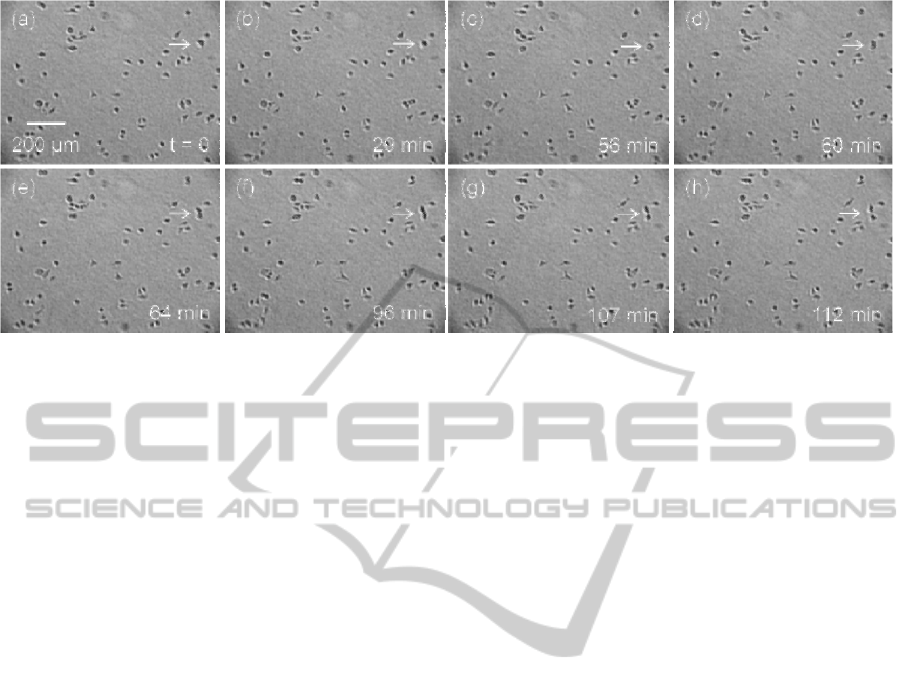
Figure 5: An A549 cell before, during and after the division process. (a) The cell is visible with its protrusions; (b) The cell
assumes a round shape; (c) The cell (brighter) partially detaches from the substrate and starts the division process; (d) ‒ (f)
The cell is in the cytokinetic phase; (g) End of the mitosis; (h) The two daughter cells get separated. The whole division
process (from (c) to (g)) takes place in about 50 minutes.
phases and prove that epithelial cell events related to
morphological cell changes can be well monitored in
time by our system.
In addition, from both experiments other
biologically relevant parameters such as the amount
of cells and their position in real-time can be
obtained. The shown frames have not been
processed with any software image manipulation
technique.
4 CONCLUSIONS
The successful results of the shown experiments
prove the suitability of our optical monitoring
system for real-time adherent grown cell
observation. Furthermore, by utilizing multiple
sensors the simultaneous recording and tracking of
different cell samples in the same multi-well plate is
feasible. This would allow real-time observation of
multiple cells exposed to diverse analytes (e.g.:
growth factors, motility inhibitors, and toxins).
Finally, the compatibility of our system with
unmodified lab disposables together with standard
incubators makes it an attractive and versatile
analysis tool for biomedical applications.
ACKNOWLEDGEMENTS
This project is part of the EU Marie Curie Research
Training Network “On-Chip Cell Handling and
Analysis” CellCheck (MRTN-CT-2006-035854).
The authors gratefully acknowledge Filippo Iuliano
of the Institute of Virology of the Slovak Academy
of Sciences in Bratislava for his valuable help in the
early stage of the device development.
REFERENCES
Suresh, S., 2007. Biomechanics and Biophysics of Cancer
Cells. Acta Materialia, Vol. 55, Elsevier.
Niinaka, Y., Haga, A., Raz, A., 2001. Quantification of
Cell Motility: Gold Colloidal Phagokinetic Track
Assay and Wound Healing Assay. Methods in
Molecular Medicine, Vol. 58, Springer.
Poujade, M., Grasland-Mongrain, E., Hertzog, A.,
Jouanneau, J., Chavrier, P., Ladoux, B., Buguin, A.,
Silberzan, P., 2007. Collective Migration of an
Epithelial Monolayer in Response to a Model Wound.
PNAS, Vol. 104, No. 41.
Gabriel, M., Picollet-D'hahan, N., Block, M., Haguet, V.,
Monitoring Adherent Cells by Contact Imaging, 2009.
In Proc. MicroTAS 2009.
Ji, H., Sander, D., Haas, A., Abshire, P. A., Contact
Imaging: Simulation and Experiment, 2007. IEEE
Trans Circ Sys, Vol. 54, No. 8.
A REAL-TIME CELL PROLIFERATION AND MOTILITY MONITORING SYSTEM
233
