
FETAL CARDIAC BYPASS ANALYSIS BY MEANS OF
CORRELATION DIMENSIONS
G. D’Avenio, C. Daniele and M. Grigioni
Dept. of Tecnology and Health, Istituto Superiore di Sanità, Rome, Italy
Keywords: Fractal dimension, Correlation integral, Physiological signals.
Abstract: During in vivo experiments of fetal cardiac surgery performed in sheep, physiological signals were
recorded, and subsequently analyzed. In order to characterize their complexity, the fractal dimension was
calculated. The adopted model of dimension estimation allowed for a possible multifractal nature of the
signals, by considering two distinct fractal dimensions ѵ
1
, ѵ
2
at different length scales. A comparison was
also carried out with an alternative measure of system complexity, Approximate Entropy (ApEn). The
results of the analysis suggest that fractal dimension may be a useful indicator of the cardiac stress and,
ultimately, of the quality of the support delivered during the operation.
1 INTRODUCTION
Fetal cardiac surgery is actively being studied
worldwide, with the favourable prospective of
providing the treatment of congenital cardiac
malformations as early as possible. In principle, in
utero interventions would allow to treat simple
primary lesions in order to prevent complex
secondary ones. The physiologic fetal low-flow
condition and the possibility to use the residual
pregnancy as a sort of natural ECMO would allow
for the anatomic and functional recovery of the
fetus. The final result would be the absolute
avoidance of systemic consequences of congenital
heart lesions with overall better outcomes compared
to those obtained by application of current neonatal
and infant repair techniques (Hanley, 1994; Carotti
et al., 2003).
However, although the technical feasibility of fetal
cardiac or cardiopulmonary bypass has already been
demonstrated (Sakata et al., 1998; Reddy et al.,
1996a; Reddy et al., 1996b), its main drawback
remains the progressive deterioration of the
fetoplacental unit function, occurring especially
during the post-bypass recovery phase. Hence, a
relevant research effort is ongoing, based on
methods to improve the fetoplacental tolerance and
to monitor the fetoplacental unit function during
extracorporeal circulation (Carotti et al., 2003).
In our study we sought to investigate the
effectiveness of new methods for monitoring left
ventricular contractility during experimental fetal
cardiac surgery procedures, based on a nonlinear
analysis of the left ventricular pressure, according to
the concept of fractal dimension.
The aim of the study was to provide useful insights
on fetal monitoring with regards also to the topic
phase of post-operative recovery.
2 MATERIALS AND METHODS
The experimental model used for fetal surgery
procedures was the fetal lamb at 110 to 130 days of
gestation (delivery term is approximately 145 days).
Two animals were selected and managed according
to the anaesthesiological and surgical protocols
already described (Grigioni et al., 2000), in
compliance with the Guide for Care and Use of
Laboratory Animals of the Italian Ministry of
Health.
Prolonged extracorporeal circulation (ECC) was run
under steady-flow assistance without the use of an
oxygenator, using a miniaturized bypass circuit to
minimize the autologous priming volume (Carotti et
al., 2003).
Left ventricular pressure was measured with a Millar
pressure transducer (Millar Instruments, Inc.,
Houston, Texas. USA), mounted on a catheter tip. A
12-bit A/D board (AT-MIO16F, National
Instruments, USA) was used to sample the signal at
the output of the pressure amplifier, under control of
489
D’Avenio G., Daniele C. and Grigioni M..
FETAL CARDIAC BYPASS ANALYSIS BY MEANS OF CORRELATION DIMENSIONS.
DOI: 10.5220/0003166104890495
In Proceedings of the International Conference on Bio-inspired Systems and Signal Processing (BIOSIGNALS-2011), pages 489-495
ISBN: 978-989-8425-35-5
Copyright
c
2011 SCITEPRESS (Science and Technology Publications, Lda.)

an original software developed in the LabView
(National Instruments Corp., USA) environment.
The analysis of the signals was carried out by means
of original Matlab (The MathWorks, Natick, MA,
USA) programs.
After instrumentation of the animal, the baseline
signals were recorded. Subsequently, atrial venous
and pulmonary arterial cannulation were performed
and a 60-min. cardiac bypass was run at a flow rate
of 300 ml/Kg/min. At the end of the circulatory
assistance the cannulae were removed, blood
priming volume was reinfused, and a 90-minute
observation period followed (recordings at 30, 60,
90 min. after ECC) before animals were sacrificed.
Correlation dimension. The left ventricular pressure
was analyzed using the estimation of the fractal
dimension, according to the method of (Grassberger
and Procaccia, 1983).
Denoting by x the signal whose fractal dimension is
to be calculated (in this case, the left ventricular
pressure), the set of points defined as
() ( ) ( )(){}
τ
τ
ξ
1,.., −
+
+= mtxtxtx
iiii
,
Ni ,..2,1=
(1)
where
τ
is an appropriate delay, constitute a
geometrical object (usually denoted as an attractor)
which is embedded in the m-dimensional phase
space.
The dimension of this object, then, will be smaller
than m, for sufficiently high values of m. Denoting
the correlation integral as
()
∑
=
∞→
−−=
N
ki
ki
N
l
N
lC
1,
2
1
lim)(
ξξθ
, (2)
where
()
1=x
θ
for x>0 and
()
0=x
θ
otherwise,
i
ξ
and
k
ξ
being two noncoincident points in the phase
space, defined by (1),it can be demonstrated that, for
small values of the distance l,
ν
llC ∝)( . The
exponent
ν
can be considered as the fractal
dimension of the constructed set of points in the
phase space.
In the current study, the delay
τ was chosen equal to
2/1
τ
, i.e., the value at which the autocorrelation
function
()
τ
f of the original pressure signal falls at
half its maximum value,
()
0f . Thus, an excessive
degree of correlation between components of the
vectors
i
ξ
was avoided. In fact, setting τ at a very
low value has the consequence that the attractor is
stretched along the diagonal of the phase space, as
shown in Fig. 1; this renders more difficult to
compute the correlation dimension. It is convenient,
instead, to choose
τ equal to
2/1
τ
, yielding a more
expanded structure in the phase space, and at the
same time not having too much decorrelation
between the components of
i
ξ
, which would be
characteristic of a purely noisy signal.
x
(
t
)
x
(
t+τ
)
Figure 1: Two-dimensional section of the attractor
composed of the points
i
ξ
, according to (1), when τ =1
ms. The time series x(t) is the left ventricular pressure
recorded during the experiments described in the text. In
this limit case, the attractor is stretched along the diagonal
of the phase space, rendering more difficult the extraction
of the correlation dimension.
In this study, we adopted a slight modification of the
correlation integral, proposed by (Theiler, 1986).
This procedure is aimed at minimizing the effect of
the degree of autocorrelation present in the original
signal, in that the linear range (in the log-log plane)
of the correlation integral is not restricted, as
happens with the original Grassberger-Procaccia
algorithm. In the following, a Theiler window of
T=5 sampling points was employed in the
calculation of the modified form of the correlation
integral.
The dimension of phase space was set to m=5. As
shown in the Results section, this is higher than what
is strictly required for the calculation of a fractal
dimension
ν (i.e., m>2ν, according to the Takens
criterion (Takens, 1980)). In order to have a more
general estimation scheme, we considered more than
a single fractal dimension. Thus, a pair (
ν
1
, ν
2
) of
fractal dimensions was calculated,
ν
1
(ν
2
) being the
slope of the regression line relative to lower (higher)
distances l in the phase space. The cut-off distance
marking the separation between the low- and high-
distance regions was found as the one warranting a
BIOSIGNALS 2011 - International Conference on Bio-inspired Systems and Signal Processing
490

good quality of the
)(lC
data fit: considering, for
each regression line, the correlation between the
)(lC points and the relative approximating line, in
terms of the Pearson correlation coefficient r, the
cut-off distance
l
′
between the two regions was
yielded by the maximization of the sum of the
coefficients r relative to the low and high distances
l in the phase space.
The usefulness of calculating two correlation
dimensions was verified with the analysis of a
monodimensional signal, whose values were given
by the abscissae of the Cantor set (Mandelbrot
1982), with noise added to investigate about the
efficiency of the proposed scheme for correlation
dimension estimation.
The Cantor set is a fractal object, built with an
iterative procedure. In the first step, the interval [0,
1] is split in three equal parts, and only the intervals
[0, 1/3] and [2/3, 1] are retained. For the n-th
iteration, each of the intervals retained after the n-1-
th iteration is subjected to the same procedure,
discarding the central third. The Cantor set is
comprised of the extrema of the retained intervals, in
the limit
∞→n . For such a fractal set, the
Hausdorff-Besicovich dimension is
)3log(/)2log(=
HB
D .
Since it has been demonstrated that
HB
DD ≤
2
,
2
D
denoting the correlation dimension (Grassberger and
Procaccia, 1983), we compared the result of the
correlation dimension calculation with the
theoretical value,
)3log(/)2log( . This is particularly
well-grounded, in this case, since the strict
inequality
HB
DD <
2
can be expected only for the
case of a dynamical system not spanning uniformly
the phase space, whereas the uniform coverage of
the attractor implies that
HB
DD =
2
(see section 3 of
(Grassberger and Procaccia, 1983)). In our example
the data points were taken once and only once from
the Cantor set, so that it can be excluded that some
regions of the phase space were covered more often
than others. Therefore, we expect that
HB
DD
=
2
)3log(/)2log(= .
We added to the series
()
kx
c
, generated after 13
iterations of the procedure previously described, a
noise with a flat probability density function, of zero
mean and range equal to 2
-11
. The embedding
dimension was set to m=1. As shown in Fig. 2,
where the value (1/2)2
-11
is marked by a vertical line,
the determination of two fractal dimensions
correctly highlights the presence of additive noise: at
the lower values of l, the fractal dimension
ν
1
was
found to be 0.9434, as a result of the “space-filling”
property of stochastic data (Grassberger and
Procaccia, 1983), i.e., the noise added to the Cantor
set data. Instead, the calculated value of n2 was
0.6277, very close to the theoretical value 0.6309.
Had a unique correlation dimension been carried
out, it would have been biased by the noisy data, and
overestimated (in this example, n=0.6614). Thus, the
proposed procedure can be used to automatically
identify a noise level, and calculate the appropriate
correlation dimension above that noise level, making
use efficiently of the available data. It must be
underlined that this is a parameter-free procedure.
Figure 2: Calculation of the correlation dimensions
21
,
ν
ν
,
for a synthetic signal consisting of the Cantor set with
zero-mean added noise, in the range ±a, with a= (1/2)2
-11
(this value is overlaid as a vertical line). The higher-scale
correlation dimension
2
ν
=0.627 agrees well with the
theoretical fractal dimension of the Cantor set,
notwithstanding the presence of the additive noise.
In order to investigate about the nonlinear features
of the signals, we analysed also the surrogate time
series derived by the originals signals with the
iterative amplitude adjusting procedure, described in
(Schreiber and Schmitz, 1996). With this technique,
the amplitude distribution and the power spectrum of
the original signal are simultaneously retained, for
each generated surrogate. The algorithm consists of
a simple iteration scheme: a sorted list is stored of
the time-series values
{
}(){}
nn
txx ≡ , together with
the squared amplitudes of the Fourier transform of
{
}
n
x , denoted by
{
}
2
n
X . A random shuffle (without
replacements)
{
}
)0(
n
x
of
{
}
n
x is calculated. Then,
each iteration consists of two steps: 1)
{
}
)(i
n
x is
brought to the desired power spectrum, using the
FETAL CARDIAC BYPASS ANALYSIS BY MEANS OF CORRELATION DIMENSIONS
491
original squared amplitudes
{
}
2
n
X
in the Fourier
transform of
{
}
)(i
n
x , retaining the phases of the
transform itself and transforming back; 2) rank order
the resulting series, in order to impart to it the
original amplitude distribution given by
{}
n
x . The
algorithm is iterated until a negligible change in the
spectrum is attained between successive iterations.
Before extracting the correlation dimension of the
surrogates, we checked for a possible
nonstationarity, that would have biased the
conclusions derived from the surrogate analysis. In
particular, we adopted the weak stationarity criterion
(Andrzejak et al., 2001), which compares the
average deviation of the amplitudes and of the center
frequency of the signal (
x
F
and
ω
F
, respectively)
with the same quantities, calculated for each of the
N surrogates (here, N=40). The criterion requires
that
x
F
(
ω
F
) must fall within the range of
x
isurr
F
,
(
ω
isurr
F
,
), i=1,2,.. N.
An alternative measure of system complexity,
Approximate Entropy (ApEn) (Pincus, 1991), was
also adopted to analyze the data, in order to quantify
the amount of regularity in left ventricular pressure
recordings. Approximate Entropy represents a
family of statistics, hence it is denoted as
()
Nrm ,,ApEn , where m is the dimension of the
vectors built with the time series data (left
ventricular pressure in the current study), r is a
vector comparison distance and N is the length of the
data array. In the present study, we set m=2 and
)( dev. std.0.2 Xr ×= ; these values give reliable
results for N>1000, as reported in (Pincus, 1991)
3 RESULTS
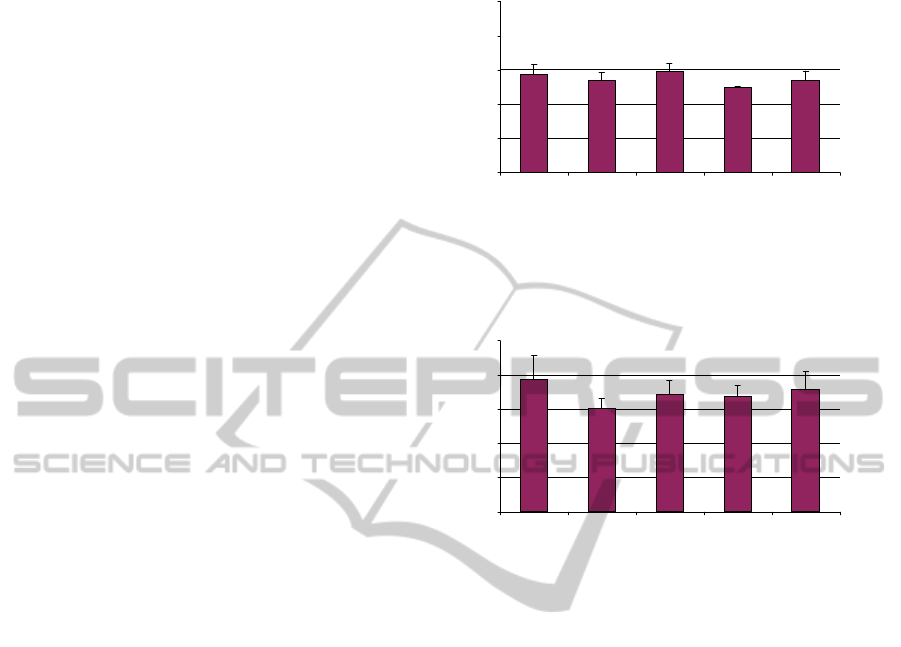
Fig. 3 reports the results of the correlation dimension
analysis for the experiment A, at baseline condition,
during the extracorporeal circulation, and during the
post-ECC recovery phase (at 1, 30 and 90 minutes
after ECC). Fig. 4 provides the same information for
the experiment B.
The statistical analysis of the results for the
correlation dimension relative to different phases of
the experiments is reported in Table I and II, for case
A and B, respectively.
A
0
0.5
1
1.5
2
2.5
baseline ECC 1' off 30' off 90' off
ν
2
Figure 3: Correlation dimension
2
ν
during the course of
the experiment A (mean value + s.d.).
B
0
0.5
1
1.5
2
2.5
baseline ECC 1' off 30' off 90' off
ν
2
Figure 4: Correlation dimension
2
ν
during the course of
the experiment B (mean value + s.d.).
As shown in the error bars in Figs. 3-4, the standard
deviation of the measurements for the fractal
dimension was small, assuring a satisfying
repeatability of the measurements (typically three
consecutive recordings were used in each phase).
The effect of the ECC phase on the dimension of the
relative attractor is evident in case B, where lower
values of the correlation dimension
2
ν
were found
with respect to the baseline. On the other hand, a
less evident effect, if any, was found in case A. The
t-test for the difference in
2
ν
between baseline and
ECC supports this view (Table 1 and 2).
As for the surrogate analysis, the weak stationarity
criterion was always met by the signals and the
respective surrogates, then we proceeded to compare
the correlation dimension for the two types of data.
Fig. 5 reports the results of the surrogate analysis for
one recording relative to each of three phases of the
experiment (case A, baseline and 30 and 90’ off-
ECC). A slight variation of the calculated value from
the one reported in Fig. 3, for the relative phase, is
due to the fact that, in the same graph, values were
averaged over three runs, whereas in Fig. 5 only one
run and the relative surrogates were depicted, for the
BIOSIGNALS 2011 - International Conference on Bio-inspired Systems and Signal Processing
492
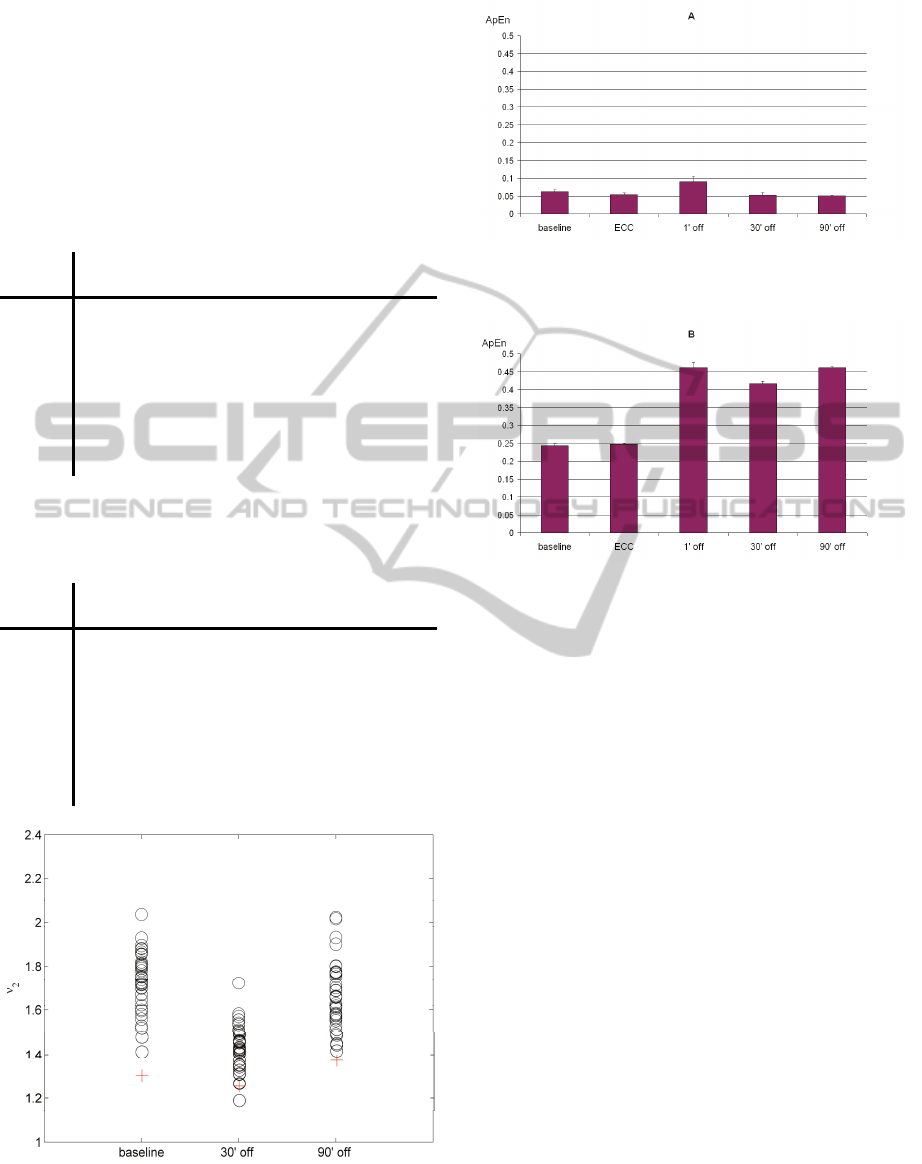
sake of clarity. It is evident how the calculated
correlation dimension
2
ν
of the original was found
to lie outside of the range of the respective surrogate
ensemble (with only one exception for the 30’ off
case), so that there is a strong indication for
nonlinearity.
Table 1: Results of t-tests between the correlation
dimension values
2
ν
relative to different phases of
experiment A.
exp. A basal ECC 1’ off 30’ off 90’ off
basal
0.139 0.403 0.037 0.443
ECC
0.038 0.155 0.273
1’ off
0.152 0.344
30’ off
0.025
Table 2: Results of t-tests between the correlation
dimension values
2
ν
relative to different phases of
experiment B.
exp. B basal ECC 1’ off 30’ off 90’ off
basal
0.003 0.024 0.007 0.057
ECC
0.135 0.378 0.083
1’ off
0.670 0.783
30’ off
0.298
Figure 5: Surrogate analysis, case A, baseline and 30 and
90’ off-ECC. Crosses (circles): correlation dimension
2
ν
relative to the original (surrogate) data.
Figure 6: Approximate Entropy (ApEn) during the course
of the experiment A (mean value + s.d.).
Figure 7: Approximate Entropy (ApEn) during the course
of the experiment B (mean value + s.d.).
With regard to the Approximate Entropy values
(Fig. 6 and 7), in case A we did not find a very large
difference between the start and the end of the
experiment (Fig. 6). A slight decrease of ApEn was
observed during ECC with respect to baseline, as
also in Fig. 3 for correlation dimension.
Instead, for case B (Fig. 7) a marked increase of
ApEn can be seen for the off-ECC phases with
respect to both basal and ECC. In this case, the
transition from the basal state to any of the post-
ECC phases was always significant; the same
applies also for the transition from the ECC phase to
any of the post-ECC phases.
A clear increase of ApEn was found for the post-
ECC pahse with respect to baseline, for both cases.
This confirms that a higher degree of irregularity
characterize the phase immediately after return to
unassisted circulation.
Later on, during the experiments, in case A ApEn
returned to the lower values observed during
baseline (Fig. 6), whereas for case B the values
remained high at 30’ and 90’ post-ECC phases (Fig.
7).
The transition between 1’ off and 90’ off is related
to significant difference for both correlation
dimension and ApEn, for case A. In this case, we
recall that the experiment could be carried out with
FETAL CARDIAC BYPASS ANALYSIS BY MEANS OF CORRELATION DIMENSIONS
493

no apparent problem until the end of the protocol.
Thus, it can be assumed that from 1’ to 90’ a
normalisation of the foetus conditions took place. As
opposed to this, in case B the same transition is not
statistically significant, for both analysis techniques.
Probably, the lack of a satisfying return of the
cardiac function to normal values, in this case, is
reflected by a not statistically significant difference
between the start and the end of the post-ECC phase.
4 DISCUSSION
The estimation of the fractal dimension according to
the method of Grassberger and Procaccia (1983) is
especially useful for the analysis of single-variable
temporal series.
As already reported in the Methods section, we
considered more than a single fractal dimension in
order to have a more general estimation scheme.
Thus, a pair (
21
,
ν
ν
) of fractal dimensions was
calculated,
1
ν
(
2
ν
) being the slope of the regression
line relative to lower (higher) distances l in the phase
space.
The presented results refer only to the fractal
dimension
2
ν
, because at the lower distances the
effect of noise can be important, possibly masking
useful information connected to the physiological
conditions. For instance, noise is produced by the
A/D conversion of the LV pressure (quantization
noise), acting at the scale corresponding to the
minimum difference between levels at the output of
the converter. Moreover, the effect must be also
considered of the noise related to the electronics of
the acquisition apparatus before sampling. A well-
known property of noise is that its correlation
dimension is ideally equal to the embedding
dimension, because the phase space tends to be filled
uniformly by the vectors (Grassberger and
Procaccia, 1983). Even though this is rigorously true
only for an infinite time series, it has been observed
(e.g., Osorio et al., 2001) that also for finite-size data
there is an increase of the correlation dimension with
the embedding dimension. Therefore, we chose to
retain only the correlation dimension
2
ν
relative to
higher spatial scales, which is less affected by the
presence of noise. This procedure may be viewed as
a nonlinear filtering of the pressure signals, which
allows to discard their noisiness’ effect on the fractal
dimension estimation. It is evident that, in the ideal
case of a signal for which at all scales, we would
find
1
ν
=
2
ν
, hence the proposed scheme is a
generalization of the more usual single dimension
analysis. The correlation dimension technique has
already been used in (Yambe et al., 1996) to
estimate the complexity in physiological signals;
specifically, the arterial blood pressure waveform
was analysed to derive the fractal dimension during
natural and assisted blood flow. A lower dimension
was found for the assisted circulation phase, which
is in agreement with the results of the present paper
(see Figs. 3 and 4). However, it must be taken into
consideration that the results in (Yambe et al. 1996)
refer to a single fractal dimension, not allowing for
an eventual multifractal nature of the signal, as
opposed to the present study.
Besides correlation dimension, as an alternative
measure of system complexity, Approximate
Entropy was also used to characterize the evolution
of the experiments. As demonstrated in (Pincus,
1991), ApEn is capable of capturing the increasing
complexity of low-dimensional nonlinear
deterministic systems and of stochastic models,
being positively correlated with the degree of such
complexity.
The results for ApEn were in agreement with those
relative to the correlation dimension
2
ν
. In
particular, comparing the two quantities, the
variation between consecutive phases was almost
always of the same sign, for case A as well as for
case B. It must be also underlined the fact that ApEn
increased for both experiments after the return to the
unassisted circulation, with respect to the ECC
phase; the same effect was observed for
2
ν
.
The starting condition of the two experiments was
quite different, as shown by the higher blood
concentration of endogenous catecholamine in
experiment B compared to experiment A. This
difference could be related to a different response to
general anesthesia, as previously reported (Reddy et
al., 1996b).
Since the “baseline” condition is actually the state
after the delivery of anaesthesia, the comparison of
this phase in Fig. 3 and 4 shows that there is a
possible positive correlation between the fetal stress
(and the consequent release of agents capable of
increasing the ventricular contractility) and the
values of
2
ν
. Another evidence of the correlation
between fetal stress and fractal dimension may be
recognized in Figs. 3 and 4, observing that the
transition ECC – 1’ off, which is an obviously
stressful event, is in both cases related to an increse
in
2
ν
. This result was statistically significant only
for experiment A, though (see Tables I and II).
BIOSIGNALS 2011 - International Conference on Bio-inspired Systems and Signal Processing
494

A difference in fractal dimension between the
beginning and the end of the procedure was found to
be much more statistically significant in experiment
B than in case A (see basal – 90’ off ECC transitions
in Tables I and II). This may confirm that in case A
the mechanical assistance to the circulation was
followed by a favourable outcome of the
experiment, since the ventricular function 90
minutes after the return to the normal circulation
was found to be associated to a not statistically
significant difference with respect to the pre-bypass
phase, (p=0.443), whereas the p value associated to
the same transition for case B was just above
p=0.05. The values of
2
ν
were already high in the
basal condition for case B (Fig. 4), probably as a
consequence of a poor response to general
anesthesia, and the highly statistically significant
lessening of
2
ν
in the post-bypass phase with
respect to the baseline is probably closely related to
such conditions. The general trend is the same for
the two experiments, with a decrease of
2
ν
at 30’
off after a high value of
2
ν
at 1’ off, and a slight
increase found at the end of the experiment (90’ off).
The results of 1’ off ECC phase confirm that the
phase immediately following the stop of the
extracorporeal circulation is particularly critical. In
Table I the transitions ECC-1’ off and 30’ off – 90’
off for case A are statistically significant. Instead, in
case B such transitions are not significant. This
could be related to a less successful clinical outcome
of the procedure, with lower blood pH values than in
case A (Grigioni et al, 2000). In particular, the
comparison of the values related to ECC - 1’ off,
p=0.038 vs.
0.135, could indicate the loss of a clear
recovery from the withdrawal of the assistance, due
to the already compromised metabolic conditions,
for case B.
Estimation of fractal dimension can be very useful to
characterize the complexity of physiological
signals, which can be related to the state of the
cardiovascular system. Moreover, this analysis could
be used in conjunction with other, more traditional
types of analysis, such as the end-systolic pressure-
volume relationship (ESPVR), already employed in
(Grigioni et al, 2000) to evaluate the recovery of the
ventricular contractile state after steady-flow
support.
Since the methods hereby presented require the
calculation of the distances between N points in the
phase space, its complexity is O(
2
N ). A possible
real-time implementation is related to the
improvement in computing power and to the
significance of the use of data segments of
reasonable length.
5 CONCLUSIONS
The proposed generalization of the usual single-
dimension analysis, allowing for the possible
multifractal nature of the ventricular pressure signal,
proved to be effective in tracking the evolution of
the ventricular contractility in the considered
experiments.
In particular, a decrease of the fractal dimension
associated with the physiological signal of interest
was observed during the assisted circulation phase,
consistently with earlier findings (Yambe et al.,
1996). The considered method does not require very
long data segment, thus it could also be used to
monitor in real time the heart’s conditions, in
assisted conditions as well as in the normal
functionment.
REFERENCES
Andrzejak RG, Lehnertz K, Mormann F, Rieke C, David
P, Elger CE. Phys Rev E Stat Nonlin Soft Matter Phys.
2001;64(6 Pt 1):061907.
Carotti A, Emma F, Picca S, Iannace E, Albanese SB,
Grigioni M, Meo F, Sciarra M, Di Donato RM. J
Thorac Cardiovasc Surg. 2003;126(6):1839-50.
Grassberger P., Procaccia I.. Physica D, 9, pp. 189-208,
1983.
Grigioni M, Carotti A, Daniele C et al. Int J Artif Organs,
23(3), pp. 189-98, 2000.
Hanley FL. “Fetal Cardiac Surgery”, in Advances in
Cardiac Surgery , St Louis: Mosby-Year, 1994
Mandelbrot, B. B. The Fractal Geometry of Nature (W. H.
Freeman, New York, 1982).
Osorio I, Harrison MAF, Lai, Y; Frei, MG. Journal of
Clinical Neurophysiology 2001. 18(3); 269-274
Pincus SM. Approximate entropy as a measure of system
complexity. Proc Natl Acad Sci USA. 1991; 88(6):
2297-301.
Reddy VM, Liddicoat JR, Klein JR et al. Ann Thorac Surg
Vol. 62, pp. 393-400, 1996a.
Reddy VM, Liddicoat JR, Klein JR et al. J Thorac
Cardiovasc Surg, Vol. 111, pp. 536-44, 1996b.
Sakata M, Hisano K, Okada M et al. J Thorac Cardiovasc
Surg, Vol. 115, pp. 1023-31, 1998.
Schreiber T, Schmitz A. Phys Rev Lett. 1996;77(4):635-
638
Takens, F. Detecting strange attractors in turbulence. In:
Dynamical Systems and Turbulence, DA Rand and LS
Young, eds.. New York: Springer-Verlag, 1980, p.
366-381.
Theiler J. Phys Rev A. 1986; 34(3):2427-2432.
Yambe T, Sonobe T, Naganuma S, Kobayashi S, Nanka S,
Akiho H, Kakinuma Y, Mitsuoka M, Chiba S, Ohsawa
N, et al. Artif Organs. 1995 ;19(7):729-33.
FETAL CARDIAC BYPASS ANALYSIS BY MEANS OF CORRELATION DIMENSIONS
495
