
SENSECARE
Real-time Location-based Health Monitoring System
Gerardo Reveriego, Javier Tellez, Cristina Urdiales and Francisco Sandoval
Departamento de Tecnologia Electronica, Universidad de Malaga
E.T.S.I. Telecomunicacion, Campus de Teatinos S/N, Malaga, Spain
Keywords:
Telehealth, Physiological parameters, Biotelemetry, GIS.
Abstract:
This paper presents an application capable of monitoring the activity of a user in real time. Our work relies
on a mobile phone since most users already have one and usually take it with them everywhere they go. Our
system makes use of a pulse oximeter connected to the phone to register physiological parameters and sends
them to a coordination centre. Other users, such as doctors or carers, can download health data from the
coordination center. The result is a report on the route followed by the user with geo-referenced physiological
parameters shown in real time. A Geographic Information System (GIS) was used as support. This standard-
based report can be visualized with various compatible GIS. We have used Google Earth due to its public and
free accessibility.
1 INTRODUCTION
It has been estimated that just in the USA, the health
care system could reduce costs by nearly $ 200 bil-
lion during the next 25 years if remote patient mon-
itoring tools were delivered for the most prevalent
diseases, such as congestive heart failure, COPD
(Chronic Obstructive Pulmonary Disease), diabetes,
chronic wounds or skin ulcers (Litan, 2008).
In the field of telehealth, remote monitoring or
telemonitoring is a broad area that has usually in-
volved the deployment on the user’s home of one or
various kind of sensors that will measure specific vital
signs. Hitherto, many countries and health providers
have focused on applications, such as basic videocon-
ference tools or monitoring devices. Many of these
home-based telemonitoring solutions are basically a
deployment of a single or several medical devices:
spirometers, heart monitors, blood pressure cuffs and
so on. Commercial examples of home health mon-
itoring devices are: Health Buddy, Ideal LIFE Pod,
Genesis DM, Intel’s Health Guide, LifeView.
A small number of products can use a mobile de-
vice as a communication gateway, like Telestation or
HealthAnywhere. This feature, have been proposed
in (Pandian, 2008), (Romero et al., 2008), (Jones,
2006a), (Jones, 2006b). Our system comprises a wire-
less pulse oximeter and a mobile phone that collects
the data from the sensor and forwards data to the co-
ordination center. Some research was performed, in
order to find an easily wearable device while walking
or running, and able to transmit its data using Blue-
tooth to a mobile device. In that sense, it was also
of vital importance the availability of the data proto-
col from the vendor. It was necessary to connect and
decode the stream of information coming from the de-
vice’s Bluetooth interface. The selected device was a
Nonin 4100 pulse oximeter.
A mobile phone with Android Operating System
was selected because of its openness and growing ac-
ceptance. The only requirements were to include a
Bluetooth module and GPS hardware in order to geo-
graphically locate the mobile user. For that purpose,
a mid-range phone, the HTC G1 was selected.
The objectives of this approach are presented in
section 2. In order to fulfill them, the system structure
of section 3 and the functional visualization in sec-
tion 4 are proposed. Experimental results are shown
in section 5. Finally, conclusions and future work are
presented in section 6.
2 OBJECTIVES
The System’s midterm objective is to proof the viabil-
ity of a mid-highrangecellular phone in order to mon-
itor some of the user’s physiological parameters. Our
target user will be someone with a cell phone capa-
374
Reveriego G., Tellez J., Urdiales C. and Sandoval F..
SENSECARE - Real-time Location-based Health Monitoring System.
DOI: 10.5220/0003160903740377
In Proceedings of the International Conference on Biomedical Electronics and Devices (BIODEVICES-2011), pages 374-377
ISBN: 978-989-8425-37-9
Copyright
c
2011 SCITEPRESS (Science and Technology Publications, Lda.)
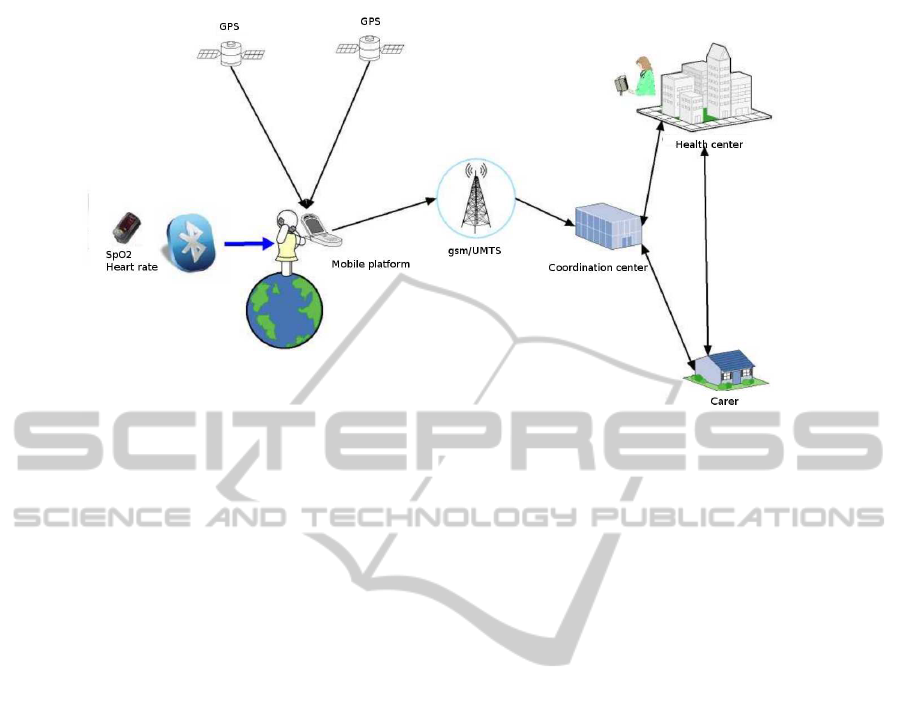
Figure 1: System global structure.
ble of interacting with the environment and be aware
of the context. This system aims to provide the cell
phone with a new dimension of awareness, so that it
is capable of interact and monitor the user’s physio-
logical parameters such as heart and respiratory rate,
oxygen saturation, etc.
The system will receive physiological data from
sensors placed on the user’s body. These sensors will
connect to the phone by Bluetooth technology. At
present, technology does not allow phones to receive
physiological information directly. Commercial off
the shell tools and hardware have been used in order
to cover the system’s requirements.
This system will use the available hardware in or-
der to allow the user and/or his/her carer real time vi-
sualization of physiological data while moving. The
carer can be described as the actor of the system who
needs to manage the user’s physiological information.
There might be some cases where the user will be
the athlete or sportsman/woman who wants to mon-
itor his/her physical progression. A more specialized
and attractive use is that given by a health centre, a
doctor o even a relative that, for medical reasons, re-
quires monitoring a person with specific needs. The
description of those needs goes far beyond the objec-
tives of this paper.
3 SYSTEM STRUCTURE
A near real-time monitoring and control system of a
moving user has been developed. Devices for cap-
turing personal physiological data are placed on the
user’s body. Those sensors connect wirelessly to the
mobile phone, that acts as a gateway to the coordi-
nation centre. For that purpose, a custom software
application has been developed on the HTC G1. The
coordination centre gathers the information captured
by the cell phone and offers it to any actor who may
require it. Vital signs coming from a moving user will
be displayed in real time through Google Earth.
Fig. 1 shows the system’s global architecture. The
following sub-systems can be distinguished:
• Mobile Platform. It gathers and manages ex-
ternal data coming from physiological sensors
placed on the user’s body by means of a Blue-
tooth technology and location information from
Geo-localization systems. The phone stores cap-
tured data in an internal database and periodically
sends the information to the coordination centre
by 3g.
• Coordination Centre. The coordination centre
can be described as the element in this system in
charge of processing and managing the data re-
ceived from the mobile platform. Its mission is
safe storage of user’s data. This centre also pro-
vides actors/carers with the required information.
• Carer. A carer can have access to the information
previously processed and managed by the coordi-
nation centre and have a graphic display of it. The
carer has access to this information, and can act
accordingly in case of emergency. On the frame-
work of this system, a graphic interface will be
provided so that the carer can see the temporal,
geographical and physiological evolution of the
user. For this purpose, Google Earth was used,
since it allows a 3 dimensional display of geo-
referenced information where monitored physio-
logical parameters can be shown.
SENSECARE - Real-time Location-based Health Monitoring System
375
4 FUNCTIONAL VISUALIZATION
Once physiological parameters are available in the co-
ordination center, these data can be used with dif-
ferent purposes. For example, it is posible to detect
abnormal patterns that may end in a serious affec-
tion and warn the user. However, our purpose is to
show the user/actor/carer the information in an easy-
to-understand way. It is advisable that the applica-
tion used to read the resulting report is free and well-
known by the user, e. g., Google Earth. The func-
tional visualization described here is based in one
designed previously for a vehicle telemetry system
(Reveriego et al., 2009). In order to show the user
(doctor, carer) someone’s activity, there are several
parameters that could be of interest such as temper-
ature, heart rate, breath rate, etc. It depends on the
application. In this experiment, the shown parameters
are the following:
1. Location;
2. Pulse rate;
3. Oxygen Saturation Level;
4. Risk Level.
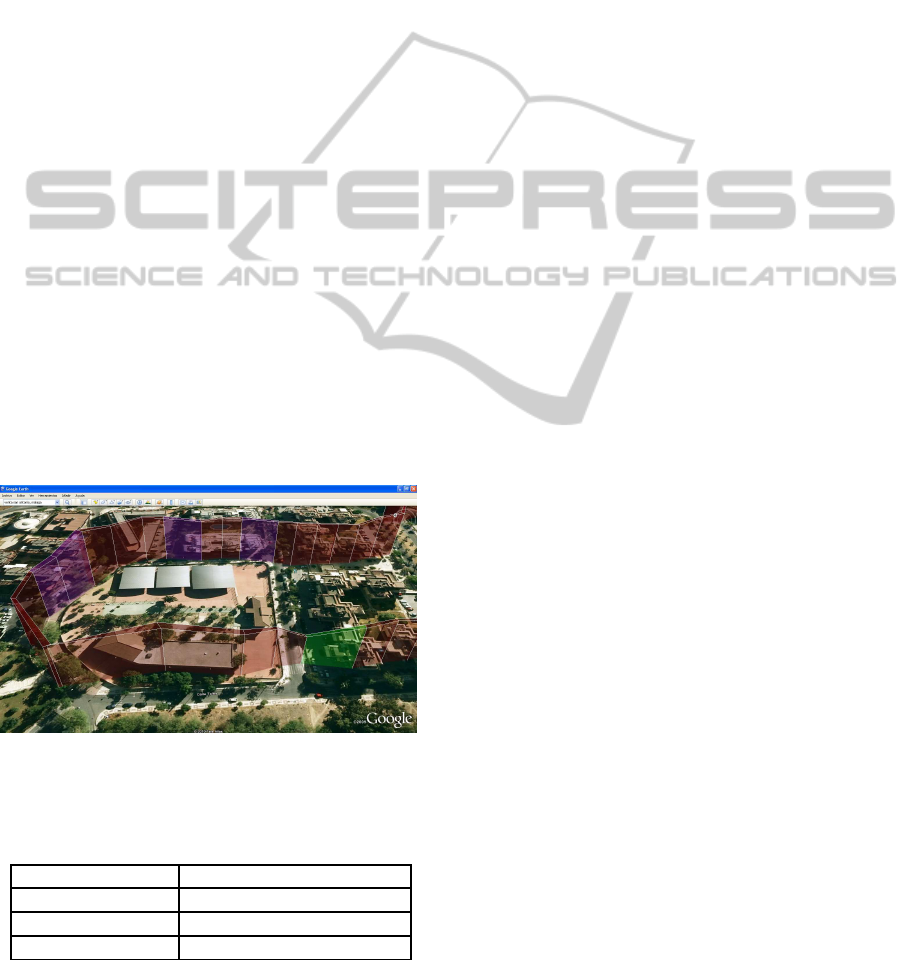
The representation proposed here consists of a 3-
dimensional graph (see Fig. 2). It is composed by
a string of prisms. Those prisms are defined using
the open standard KML and represent the information
showed in Table 1.
Figure 2: 3-dimensional representation in a middle-distance
running.
Table 1: Correspondence between Prism dimension and
representing magnitude.
Prism dimension Representing magnitude
Height Pulse rate
Width Oxygen Saturation Level
Color Risk level
The color of the prisms depends on the risk level.
The cooler the color the lower the risk level and the
warmer the color the higher the risk level. The level of
risk is calculated by simple thresholding of the mea-
sured heart rate (Fox et al., 1971). Each prism is a
Polygon
KML object.
5 EXPERIMENTAL RESULTS
Although the system is in an initial stage, positive out-
comes can be drawn from each of the three compo-
nents of the architecture described in section 3. The
design of the platform aims to be as transparent as
possible to the user, since it intends to be a gateway
between the user and the coordination centre. The ap-
plication must interact with several other systems at
the same time seamlessly:
• Visually, with the user in order to display the in-
formation sent by the sensors;
• Management of Bluetooth communications with
physiological sensor placed on the user;
• Management of user’s geo-localization;
• Sending of the information gathered to the coordi-
nation centre without the intervention of the user.
The application meets the above mentioned re-
quirements, although its main limitation lies on bat-
teries autonomy; the simultaneous use of the GPS, the
Bluetooth radio and the uploading of the data by 3g,
results in considerably high power consumption.
The operation of the coordination centre is ade-
quate and uses open source tools.
By using Google Earth API, the carer can visu-
alize on a real map a 3D representation of the user’s
physiological activity in real time. To make this pos-
sible, the coordination centre shall generate and up-
date the information to be shown on the client Google
Earth of the carer when starting. In short, when the
carer starts Google Earth, he/she will be able to vi-
sualize how the user’s physiological and geographical
information updates in real time. The carer will also
observe how some dynamic polygons of different col-
ors and shapes are drawn on the map.
Fig. 3 shows a screen capture of the carer’s inter-
face where a high speed running route made by the
monitored person is traced. At first, the the heart rate
is slow as the graph is low in height. Probably, the
user was staying quiet or just walking. Afterwards,
the graph starts to increase rapidly till a higher level
and the color of the graph pass from blue, warmer and
warmer, to red. Thus, the activity of the user grows in
intensity. This is the graph generated by a user that
start running fast from a relaxed state.
BIODEVICES 2011 - International Conference on Biomedical Electronics and Devices
376
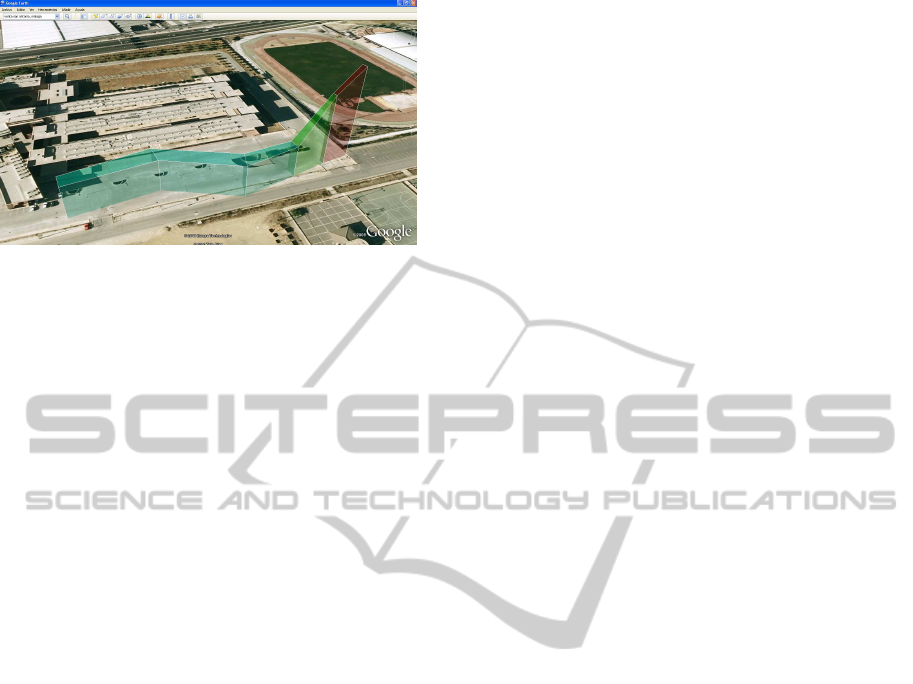
Figure 3: High speed running from relaxed state.
6 CONCLUSIONS AND FUTURE
WORKS
A system capable of monitoring physiological param-
eters in real time has been presented. It is, basically,
continuous remote monitoring system comprising:
• A sensor device placed on the user’s body that
measures physiological data (pulse, Sp02);
• A cellular phone that retrieves data from the sen-
sor device using a short range technology (blue-
tooth); it collects geographical information (GPS)
and it sends it through 3g technology to the coor-
dination centre;
• A coordination centre acting as a server that stores
physiological data coming from the cell phone.
The coordination centre also receivesthe demands
from the users that wish to visualize physiological
data.
It is concluded that the designed visualization sys-
tem is intuitive and efficient. It is, however, tedious
to do a real time monitoring of the patient for a long
time. It is very common that neither a physician nor
a carer carries out a real time continuous monitor-
ing of the patient. In this case, it seems more useful
to implement a system that allows detecting anoma-
lies through data mining, for instance, and alerts doc-
tors, carers or even the patient if abnormalities are de-
tected. This system could be more useful in situations
like some kinds of rehabilitation or tests, like stress
test for heart disease, when human supervision is ad-
visable. For this purpose, the measurement of more
specific vital signs would be a requirement.
Another problem that has to be dealt with is the
battery life time of the cell phone. Phone battery life
is relatively short (2 hours), since a continuous mon-
itoring implies the use of hardware with high power
consumption (GPS, Bluetooth, 3g radio).
Future work will focus on three main lines. First,
behavior-based preventive alarms would be interest-
ing to warn users, carers and doctors. Second, it might
also be interesting to find transparent, cheap, commer-
cial sensors that could be attached to the mobile phone
to improve risk detection and provideadditional infor-
mation. Finally, system software has to be optimized
to extend battery life.
ACKNOWLEDGEMENTS
This work has been supported by CENIT-AmIVital,
Ingenio 2010 project and by the Spanish Ministerio
de Educacion y Ciencia TEC2008-06374-C02-01.
REFERENCES
Fox, S. M., Naughton, J. P., and Haskell, W. (1971). Phys-
ical activity and the prevention of coronary heart dis-
ease. Annals of clinical research, 3(6):404–32.
Jones, V. (2006a). Mobihealth: mobile health services
based on body area networks. Centre for Telemat-
ics and Information Technology University of Twente,
Enschede.
Jones, V. (2006b). Mobihealth: mobile services for health
professionals. Centre for Telematics and Information
Technology University of Twente, Enschede.
Litan, R. E.(2008). Vital signs via broadband: Health moni-
toring transmits savings, enhances lives. Better Health
Care Together, pages 38–42.
Pandian, P. (2008). Wireless sensor network for wear-
able physiological monitoring. Journal of Networks,
3(5):21–29.
Reveriego, G., Urdiales, C., and Sandoval, F. (2009). Vehi-
cle risks assessment using a nokia n95. In Intelligent
Transportation Systems, 2009. ITSC ’09. 12th Inter-
national IEEE Conference on, pages 1–6.
Romero, E., Araujo, A., Malagon, P., Vallejo, J. C., Moya,
J. M., and Nieto-Taladriz, O. (2008). Patientsmonitor-
ing system based on a wireless sensor network adap-
tive platform. In pHealth. International Workshop
on Wearable Micro and Nanosystems for Personalised
Health, Valencia.
SENSECARE - Real-time Location-based Health Monitoring System
377
