
TOWARDS A STATISTICAL DESCRIPTION OF EXPERIMENTAL
DATA FOR DETECTION-ESTIMATION PROBLEMS IN DNA
TRANSLOCATIONS THROUGH NANOPORES
S. Michelet
1
, J-P. Barbot
1
, O. Franc¸ais
1
, P-Y. Joubert
1
, P. Larzabal
1
R. Kawano
2
, H. Sasaki
2
, T. Osaki
2
, S. Takeuchi
2
and B. Le Pioufle
1
1
SATIE, ENS Cachan, CNRS, UniverSud, 61 Avenue du Pr´esident Wilson, Cachan, France
2
KAST and IIS, University of Tokyo, Tokyo, Japan
Keywords:
Signal processing, Stochastic framework, Detection, Estimation, Characterization of DNA translocations.
Abstract:
This paper investigates the properties of DNA translocations signals in a stochastic framework. The considered
signals are relative to the translocation of single strand DNA through natural nanopores, and are obtained
using a planar patch clamp method. The stochastic signal analysis is carried out considering the statistical
distribution of DNA translocation parameters, considered as random variables including the amplitude, the
duration and the apparition of the DNA translocation events as well as the no-translocation signal features.
For each of these variables, a distribution function is proposed and assessed using a Kolmogorov-Smirnov
test, and their features are estimated. The DNA translocation signal stochastic analysis enables to characterize
the detection and/or estimation performances of existing algorithms, such as a breakdown detection algorithm,
in a stochastic framework. Moreover, it opens the way to the design of model based algorithms such as
detection tests using a likelihood ratio or joint detection-estimation algorithms using a maximum likelihood
approach, for an enhanced characterization of DNA translocations.
1 INTRODUCTION
In view of the DNA sequencing, a biochip dedicated
to the DNA translocation through natural nanopores
reconstituted on an artificial biomimetic membrane
was designed in (Osaki et al., 2009). The biochip
consists in a partition between a fluidic chamber and
a channel, made with a thin film of parylen obtained
by chemical vapor deposition, and micromachined
through oxygen plama (see figure 1).
The biomimetic artificial membrane is built up on
this partition, by the successive flow of lipids and
buffers into the channel, as described in (Osaki et al.,
2009) and the nanopore is created thanks to the in-
sertion of an α-hemolysin natural membrane protein.
The application of a voltage on both sides of the mem-
brane induces the movements of ions, and therefore
the apparition of a current through the channel. The
DNA strand crossing through the membrane induces
a current blockade, measured thanks to a patch clamp
amplifier. The amplitude and duration of this block-
ade characterizes the DNA composition and length.
The blockade current constitutes the informative sig-
nal which is sampled and digitalized by the experi-
Figure 1: Presentation of the biochip used for DNA translo-
cation detection.
mental setup. In order to avoid aliasing during the
acquisition process, a so called anti-aliasing low pass
filter is used to process the experimental data.
Getting DNA translocation signals is a delicate ex-
periment, since the obtained signals depend on many
parameters, such as temperature, humidity, sealing of
the artificial membrane or surface conditions of the
electrodes.
In this study, in order to avoid repetitive exper-
iments required to adjust the acquisition parameters
221
Michelet S., Barbot J., Francais O., Joubert P., Larzabal P., Kawano R., Sasaki H., Osaki T., Takeuchi S. and Le Pioufle B..
TOWARDS A STATISTICAL DESCRIPTION OF EXPERIMENTAL DATA FOR DETECTION-ESTIMATION PROBLEMS IN DNA TRANSLOCATIONS
THROUGH NANOPORES.
DOI: 10.5220/0003160702210226
In Proceedings of the International Conference on Bio-inspired Systems and Signal Processing (BIOSIGNALS-2011), pages 221-226
ISBN: 978-989-8425-35-5
Copyright
c
2011 SCITEPRESS (Science and Technology Publications, Lda.)
left to the users and the dedicated data processing
techniques, artificial signals are generated. The prop-
erties of these artificial signals are determined through
the statistical investigations of actual biosignals. In
section 2 the statistical properties of the signal are
estimated, including the no-translocation current, the
amplitude and duration of the DNA translocations
events, and the delay between events. In section
3, corresponding artificial signals are generated and
used to optimally design an amplitude-duration char-
acterization algorithm based on a breakdown detec-
tion approach, and used to evaluate the amplitude-
duration characterization performances. In section 4,
thanks to the proposed statistical framework, the rele-
vance of model based approachesis pointed out, in or-
der to develop i) a detection test using likelihood ratio,
and ii) a joint detection-estimation algorithm based on
a maximum likelihood method.
2 A STATISTICAL DESCRIPTION
OF THE DNA
TRANSLOCATION SIGNAL
In this study, the investigation is carried out
in a stochastic framework for the current flow-
ing through the nanopore. The considered ex-
perimental data are relative to the transloca-
tions of a 41mer ssDNA TTTTTTTTTCACTGAC-
CTGGGGGAGTATTGCGGAGGAAGGT, the con-
centration of which is 45 µM in a 1.0 M KCl, 10
mM PBS, 1 mM EDTA buffer featuring pH=7.4. The
DNA translocations are conducted thanks to a 80 mV
voltage applied between both sides of the lipid bi-
layer.
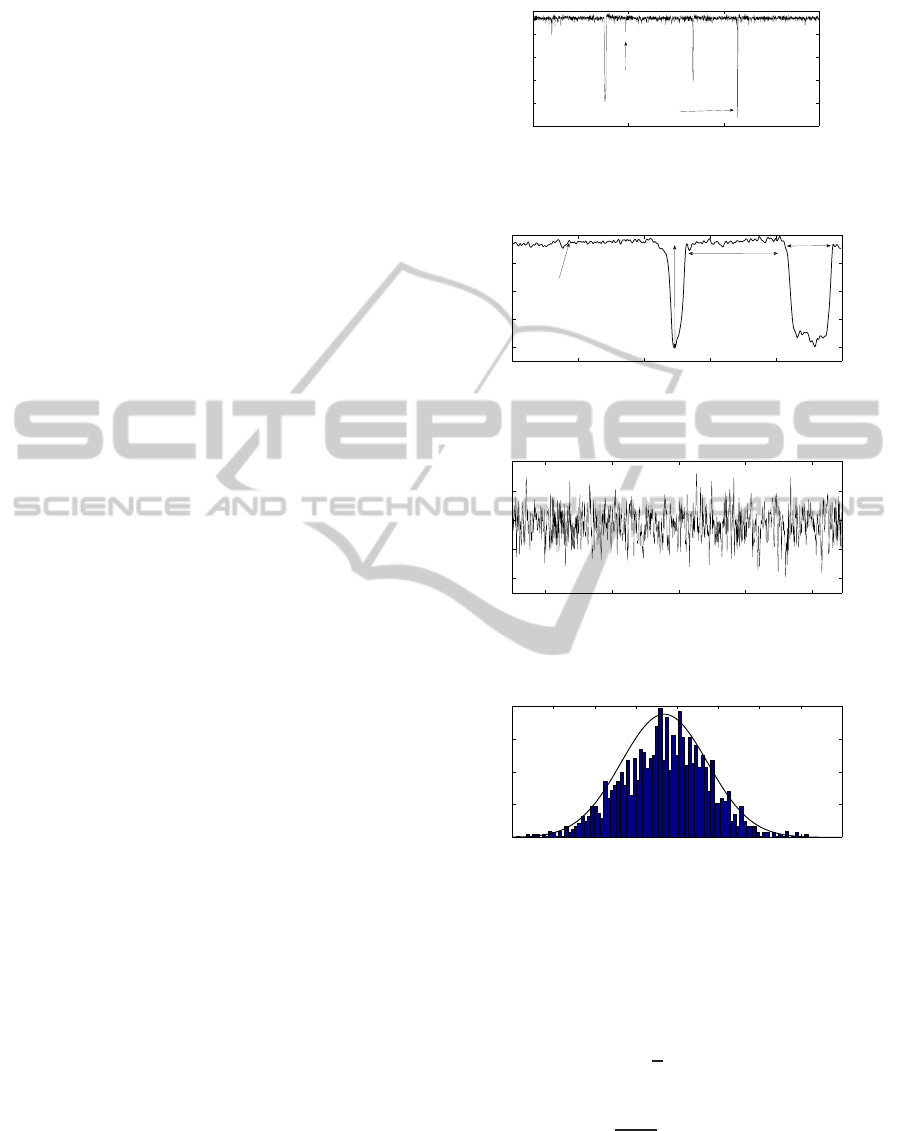
The stochastic characterization of DNA signals
consists in the evaluation of the statistical distribution
of the amplitude, denoted AMP, the duration (DUR),
the delay between translocation (DBT), and the no-
translocation signal (NTS), which are defined in fig-
ure 3.
2.1 Properties of the Current through
Nanopore in Absence of
Translocation
Firstly we examine the statistical properties of the
actual current flowing through an open α-hemolysin
channel nanopore without any DNA stand transloca-
tion. An example of the current flowing through the
nanopore is shown in figure 4.
An histogram of this no-translocation signal is
shown on figure 5, which seems to exhibit a Gaussian
205.9 205.95 206 206.05
0
20
40
60
80
100
Time (sec)
Current amplitude (pA)
Translocation
Attempt
Figure 2: Examples of current blockades relative to DNA
translocation and translocation attempts.
232.556 232.558 232.56 232.562 232.564 232.566
20
40
60
80
100
Time (sec)
Current amplutide (pA)
AMP
DBT
DUR
NTS
Figure 3: Features of the DNA translocation signal.
0.496 0.498 0.5 0.502 0.504
90
92
94
96
98
Time (sec)
Current amplitude (pA)
Figure 4: Real current variations through α-hemolysin
channel without any translocation event.
90 91 92 93 94 95 96 97 98
0
20
40
60
80
Current amplitude
Number of elements
Figure 5: Histogram of no-translocation experimental cur-
rent samples (n=1982 samples).
distribution. The mean and standard deviation param-
eters of the distribution, respectively denoted µ and σ,
are estimated using:
µ =
1
n
n
∑
k=1
x[k] (1)
σ
2
=
1
n−1
n
∑
k=1
(x[k] −µ)
2
(2)
where x is the signal and n the number of samples.
Considering the available experimental data, the esti-
mation using eq. (1) and eq. (2) leads to µ
NTS
= 93.7
pA and σ
NTS
= 1 pA.
BIOSIGNALS 2011 - International Conference on Bio-inspired Systems and Signal Processing
222

In order to attest the assumed Gaussian distribu-
tion of the no-translocation signal, a Kolmogorov-
Smirnov (KS) test was implemented. The KS test ac-
tually quantifies the distance between the cumulative
distribution function (CDF) of the considered exper-
imental data, denoted F
n
(x), and the CDF of a refer-
ence distribution denoted F(x) (Kendall and Stuart,
1979). This KS will be prefered to the Chi-2 test
which is sensitive to a lack of data in the experimental
histogram. The KS distance is expressed by:
D
n
=
√
n×sup
x
|F(x) −F
n
(x)| (3)
where n is the number of samples of the exper-
imental data. If this distance D
n
is greater than a
predefined threshold, then the hypothesis according
to which the experimental data distribution is close to
the candidate reference distribution is rejected. The
threshold is adjusted for a false reject rate of 1%.
Here, the KS test validates the normal distribution
of the no-translocation current, as shown on figure 6,
which exhibits the CDF F
n
(x) and F(x).
90 91 92 93 94 95 96 97 98
0
0.2
0.4
0.6
0.8
1
Amplitude value
Cumulative distribution function
Gaussian model
Data
Figure 6: Cumulative distribution functions F
n
(x) (Gaus-
sian) F(x) (experimental data).
2.2 Statistical Properties of
Translocations Events
In this section, we characterize the translocation
events through their duration and amplitude distribu-
tion. Indeed, the translocation event provokes a cur-
rent blockade featured by a duration and an amplitude
which give biological information on the ssDNA. The
amplitude vs time duration graph permits to deter-
mine the length of the DNA, and provides information
about its composition, such as the discrimination be-
tween polyU, polyC or polyA, (Akeson et al., 1999).
As usually admitted (Kasianowicz et al., 1996),
only translocations with a current amplitude decreas-
ing more than 80% of the initial value correspond to
complete translocations. Others are translocation at-
tempts which are not considered here.
2.2.1 Amplitude and Duration of the
Translocation Events
Thanks to equations (1) and (2) the amplitude dis-
tribution mean value and standard deviation of the
translocation amplitude AMP can be estimated: µ
AMP
= 89.2 pA and σ
AMP
= 7.33 pA.
In this study, the translocation current amplitude
AMP is assumed to be normally distributed, and a KS
test implemented has validated this assumption.
In (Meller et al., 2000), the distribution of the
translocation duration was approximated using a mix-
ture of a Gaussian law and an exponentially decaying
law. Here, for tractability purposes, a Rayleigh law
(Eq. 4) seems to be more adequate to fit the DUR
actual distribution law, and will therefore be prefered
(Figure 7). The KS test validates this distribution law.
f(DUR) =
DUR
r
2
DUR
exp
−
DUR
2
2r
2
DUR
(4)
For the duration distribution the Rayleigh param-
eter r is estimated according to equation (5).
r
DUR
=
1
2n
∑
k∈[1,n]
(DUR[k])
2
= 924 µsec (5)
0 0.5 1 1.5 2 2.5 3
x 10
−3
0
0.2
0.4
0.6
0.8
1
Duration time (s)
Cumulative distribution function
Rayleigh model
Real data
Figure 7: Cumulative distribution functions F
n
and F rela-
tive to the Rayleigh distribution of DUR.
2.2.2 Statistics of Delay between Translocations
Events
The distribution of the delay between translocations
(DBT) is considered in this section and assumed to be
a decreasing exponential, expressed by :
f(DBT) = αexp(−αDBT) (6)
where:
α =
n
n
∑
i=1
DBT(i)
(7)
α = (17.6ms)
−1
.
2.2.3 Statistical Description of the DNA
Translocation Signal
Finally, the distribution features of the random vari-
ables AMP, DUR, DBT and NTS, estimated from ex-
perimental DNA translocation signals are gathered in
table 1.
TOWARDS A STATISTICAL DESCRIPTION OF EXPERIMENTAL DATA FOR DETECTION-ESTIMATION
PROBLEMS IN DNA TRANSLOCATIONS THROUGH NANOPORES
223

Table 1: Distributions features.
Dist param. 1 param. 2
NTS Gaus. µ = 93.7 pA σ = 1 pA
AMP Gaus. µ = 89.2 pA σ = 7.33 pA
DUR Ray. r = 924 µs
DBT Exp. α = (17.6 ms)
−1
3 PERFORMANCES OF A
NO-PARAMETRIC
AMPLITUDE-DURATION
ESTIMATION ALGORITHM
In this section, the DNA translocation signal charac-
terization results are used to evaluate, in a stochas-
tic framework, the performances of an elementary
translocation characterization algorithm. The con-
sidered algorithm is based on a breakdown detec-
tion technique, presented in (Osaki et al., 2010)
which allows to estimate the amplitude and duration
of translocation events, respectively denoted
[
AMP
and
[
DUR. To evaluate the performances of this char-
acterization algorithm for various signal features, we
build up artificial biomimetic signal considering the
AMP, DUR, DBT and NTS distributions estimated in
the previous section. Moreover, in order to take the
possible experimental noise variance variations into
account relative to the experimental set-up, we elab-
orate artificial signals featured by various signal to
noise ratios (SNR), defined as:
SNR = 20log|
µ
AMP
σ
NTS
| (8)
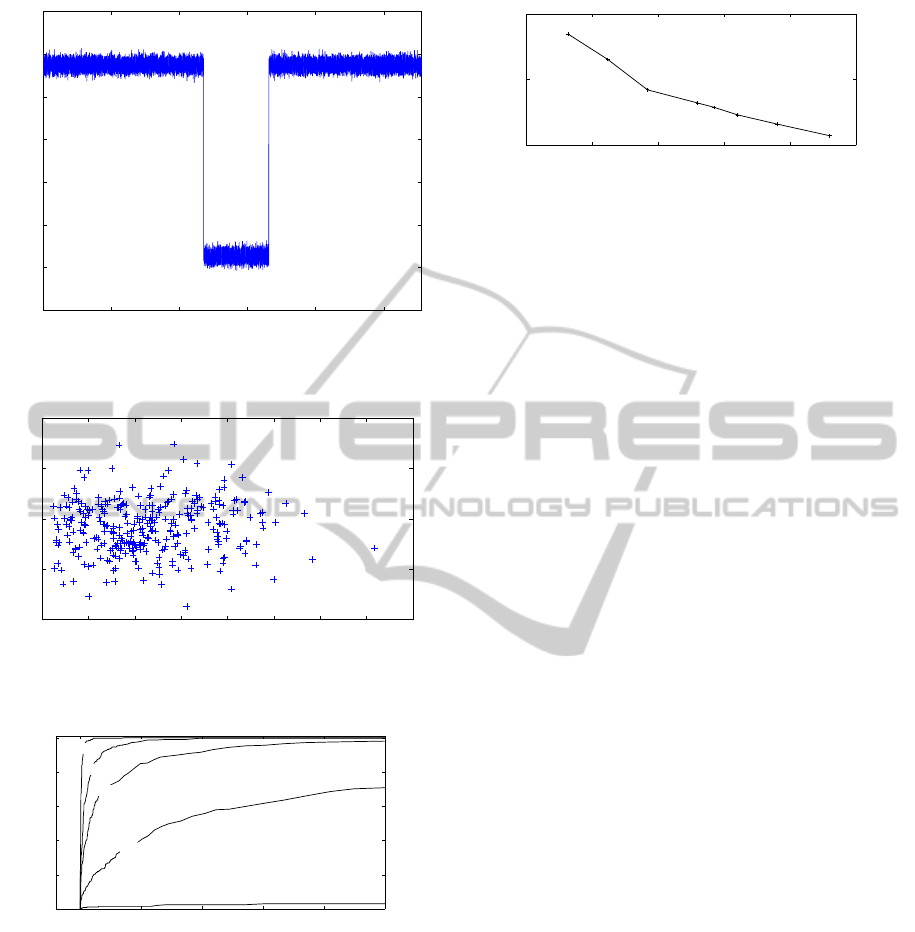
An example of a 319 translocation signal se-
quence featured by a 30 dB SNR is represented in
figure 8, and figure 9 exhibits the detail of a sin-
gle artificial translocation event. The implementation
of the breakdown detection algorithm applied to this
translocation sequence allows the AMP and DUR val-
ues of the 319 translocations to be estimated. The cor-
responding amplitude vs duration representation dia-
gram is depicted in figure 10.
In order to quantify the characterization perfor-
mances of the algorithm, we compute the true posi-
tive rate and the false positive rate of the character-
ization algorithm, considering SNRs ranging from 6
to 46 dB. The true positive rate (TPR) is computed
as the rate of the estimated AMP-DUR values of each
considered translocation event which are close to the
actual values whithin a predifined distance ν. On
the other hand, the false positive rate (FPR) is de-
fined as the rate of the estimated AMP-DUR values
which are wrongly positionned at a distance smaller
than a varying distance ν. Then, the receiver opera-
tional characteristic (ROC) which plots the TPR as a
function of FPR for various values of ν can be con-
sidered to quantify the characterization performances
(Bradley, 1997). ROC curves obtained for the con-
sidered translocations data are presented in figure 11.
One can note for example that a 90 % TPR is reached
at the cost of a 0.01 % FPR considering a transloca-
tion sequence with SNR = 28 dB, and that the same 90
% TPR is reached at the cost of a 1 % FPR when the
SNR falls down to 18 dB. An other means of quanti-
fying the performance of the amplitude-duration esti-
mation algorithm is to evaluate the mean square error
(MSE) defined in equation (9), of the characterization
as a function of the SNR of the translocation signal.
MSE =
1
n
n
∑
i=1
v
u
u
t
[
AMP
i
−AMP
i
µ
AMP
!
2
+
[
DUR
i
−DUR
i
µ
DUR
!
2
(9)
where
[
AMP and
[
DUR are the estimated values
of AMP and DUR respectively, n is the number of
translocations equal to 319, and where the contribu-
tion of the amplitude and duration errors are normal-
ized by their mean values in order to give them the
same weight in the computation of the MSE. The
MSE computed according to equation (9) and ex-
pressed in percent is represented in figure 12. One can
note that the MSE falls from 30 % to 0.02 % when the
SNR rises from 6 dB up to 46 dB, respectively.
Time (sec)
Current amplitude (pA)
0
10
20
30
40
50 60 70 80
-20
0
20
40
60
80
100
120
Figure 8: Generated artificial signal.
4 DISCUSSION
We have proposed a statistical characterization of
nanopore DNA translocation current allowing well
known methods of amplitude/duration characteriza-
tions (Basseville and Nikiforov, 1993) to be imple-
mented and evaluated using intensive computer simu-
lations.
BIOSIGNALS 2011 - International Conference on Bio-inspired Systems and Signal Processing
224
replacements
Time (sec)
Current amplitude (pA)
0.636
0.638
0.64 0.642 0.644 0.646
-20
0
20
40
60
80
100
120
Figure 9: Single translocation event in the artificial signal.
Duration (sec)
Current amplitude decreasing (pA)
0
0.5
1
1.5
2
2.5
3
3.5 4
×10
−3
80
85
90
95
100
Figure 10: Diagram duration vs amplitude for the artificial
translocations.
0 0.005 0.01 0.015 0.02 0.025
0
0.2
0.4
0.6
0.8
1
False positive rate
True positive rate
6 dB
12 dB
18 dB
32 dB
28 dB
Figure 11: ROC of the duration-amplitude characterization.
More challenging now is the use of this statis-
tical characterization to optimally build new model
based approaches to improve the characterization per-
formances. The proposed modelling of translocation
signals opens this way. As a complete statistical char-
acterisation of a steplike signal is now available, sev-
eral ways of investigation are opened. Let us briefly
point out two of them for further works:
i) a model based segmentation procedure which
detects multiple change points in a steplike signal can
be built on a generalized likelihood ratio test or on
0 10 20 30 40 50
10
−2
10
0
10
2
SNR (dB)
MSE (%)
Figure 12: MSE (eq 9) of the amplitude-duration estima-
tion.
information theoretic criterion such as Akaike infor-
mation criterion like tests. Moreover, since this seg-
mentation technique considers the DNA translocation
signal as a whole sequence, it avoids the well known
drawbacks relative to sliding window data processing
approaches.
ii) a regularized maximum likelihood method can
be built, looking for the unknown parameters θ as:
b
θ = argmin
θ
{ks∗(t) −s(θ)k
2
2
+ λk∇s(θ)k
1
} (10)
with
θ = [t
1
, t
2
...t
N
, a
1
, a
2
...a
N
]
T
where t
i
are the step
location parameters and a
i
are the step amplitude pa-
rameters.
∇s(θ) is the gradient of the solution. As we are
looking for a steplike signal, for regularization pur-
poses a l
1
norm will be used for the gradient.
s ∗(t) is the actual recorded signal and s(θ) is a
candidate signal. Recent developments in convexe
constraint optimisation open the way to an efficient
optimisation of the criterium expressed in equation
(10). λ is a parameter used to adjust the contribution
of each terms of the regularization criterion.
This provides a statistical framework for DNA
translocation characterisation.
ACKNOWLEDGEMENTS
This work was supported by grants of a joint CNRS-
JST research program.
REFERENCES
Akeson, M., Branton, D., Kasianowicz, J. J., Brandin,
E., and Deamer, D. W. (1999). Microsecond
time-scale discrimination among polycytidylic acid,
polyadenylic acid, and polyuridylic acid as homopoly-
mers or as segments within single rna molecules. Bio-
physical Journal Volume 77.
Basseville, M. and Nikiforov, I. V. (1993). Detection of
abrupt changes : theory and applications. Prentice-
Hall, Englewood Cliff, NJ.
TOWARDS A STATISTICAL DESCRIPTION OF EXPERIMENTAL DATA FOR DETECTION-ESTIMATION
PROBLEMS IN DNA TRANSLOCATIONS THROUGH NANOPORES
225

Bradley, A. P. (1997). The use of the area under the
roc curve in the evaluation of machine learning algo-
rithms. Pattern Recognition Lett 30(7):1145159.
Kasianowicz, J. J., Brandin, E., Branton, D., and Deamer,
D. W. (1996). Characterization of individual polynu-
cleotide molecules using a membrane channel. Proc.
Natl. Acad. Sci. USA 93.
Kendall, M. G. and Stuart, A. (1979). The Advanced Theory
of Statistics, volume 2. Charles Griffin, 4th edition.
Meller, A., Nivon, L., Brandin, E., Golovchenko, J., and
Branton, D. (February 2000). Rapid nanopore dis-
crimination between single polynucleotide molecules.
PNAS vol. 97.
Osaki, T., Barbot, J., Kawano, R., Sasaki, H., Francais, O.,
Pioufle, B. L., and Takeuchi, S. (September 2010).
A rupture detection algorithm for the dna transloca-
tion detection though biological nanopore. accepted
in Proc. Eurosensors XXIV.
Osaki, T., Suzuki, H., Pioufle, B. L., and Takeuchi, S.
(2009). Multichannel simultaneous measurements
of single-molecule translocation in α-hemolysin
nanopore array. Analytical Chemistry 81.
BIOSIGNALS 2011 - International Conference on Bio-inspired Systems and Signal Processing
226
