
DATA ANALYSIS OF AGE-RELATED CHANGES IN VISUAL
MOTION PERCEPTION
Nadejda Bocheva, Olga Georgieva
Institute of Neurobiology, Bulgarian Academy of Sciences, Acad. G. Bonchev str. Bl. 23, Sofia, Bulgaria
Faculty of Mathematics and Informatics, Sofia University, “St. Kl. Ohridski”, Sofia, Bulgaria
Miroslava Stefanova
Institute of Neurobiology, Bulgarian Academy of Sciences, Acad. G. Bonchev str. Bl. 23, Sofia, Bulgaria
Keywords: Mixed ANOVA, Fuzzy clustering, Psychophysical experiments, Motion discrimination, Ageing, Visual
perception, Individual, Gender and group differences.
Abstract: Many cognitive abilities decline with age, but ageing is accompanied by great variability within older
population. The aim of the present study is to explore the possibility to differentiate the age-related and the
individual differences in visual information processing. Two different analytical methods – mixed ANOVA
and fuzzy clustering, were applied to the data of psychophysical experiments on motion direction
discrimination. The results suggest that the complementary analysis based on both methods offers new
opportunities to retrieve information from the psychophysical studies and to separate the differences due to
age and gender from the individual differences of the participants. The proposed data analytic approach
allows better understanding of the factors that caused variation in performance with age and can be used as
a diagnostic tool to distinguish pathological from normal ageing.
1 INTRODUCTION
Ageing depends on a multitude of factors -
biological, genetic, social, economic, etc. The most
wide-spread approach in studying cognitive ageing
is to compare the performance of the participants
from two age groups (e.g. Habak & Faubert, 2000;
Raz, 2004; Govenlock et al., 2009; Berard et al.,
2009; Pilz, Bennett & Sekuler, 2010; Allen et al.,
2010) or to find a correlation between different
behavioural measures and age (e.g. Billino et al.,
2008). While these analyses provide valuable
information about the factors that affect the age-
related changes in the cognitive processes, the
individual differences among the subjects are greatly
undermined or are examined mainly through a
correlation analysis (e.g. Rose et al., 2010; Busey et
al., 2010). However, the variability among the
participants might include different life experiences,
genetic influences, preferred strategies and
susceptibility to neuropathology (e.g. Hedden &
Gabrielli, 2004). For this reason it is important to
evaluate the individual differences in order to
determine behavioral norms and to distinguish
normal from pathological ageing. The
psychophysical studies have the potential not only to
describe human performance but also, when
combined with other data, to be used as an indicator
for degenerative processes.
The aim of the present study is twofold: First, to
suggest new data analytic strategies for individual
differences between the participants in
psychophysical experiments; second, to determine
the most appropriate conditions for evaluation of
these differences. In order to achieve this goal we
selected four experiments from our dataset of studies
on visual perception of dynamic information. The
experiments focus on the age-related changes in the
sensitivity to motion direction of dynamic noisy
stimuli. Here we will concentrate only on the
evaluation of the different analytical techniques and
experimental conditions that will provide better
segmentation of the age-related changes from the
individual characteristics of the participants.
556
Bocheva N., Georgieva O. and Stefanova M..
DATA ANALYSIS OF AGE-RELATED CHANGES IN VISUAL MOTION PERCEPTION.
DOI: 10.5220/0003147505560561
In Proceedings of the 3rd International Conference on Agents and Artificial Intelligence (ICAART-2011), pages 556-561
ISBN: 978-989-8425-40-9
Copyright
c
2011 SCITEPRESS (Science and Technology Publications, Lda.)

2 METHODS
2.1 Subjects
Twelve younger subjects (mean age 19.5 yrs., range
16-24 yrs., six male) and 12 older subjects (mean
age 73.9 yrs., range 66-82 yrs, four male)
participated in the experiments. All of them have
normal or corrected to normal vision.
2.2 Stimuli
The stimuli consisted of 50 frame movie sequences
showing spatially band-pass elements. They moved
in circular aperture with radius of 7.0 deg,
positioned at the middle of the computer screen.
In Experiments 1 and 3 the moving elements
were 32, whereas in Experiments 2 and 4 they were
128. If any element left the aperture during its
motion, it re-appeared from the opposite side of the
aperture in order to keep the number constant. The
mean speed of motion in all experiments was 6.64
deg/s. In Experiments 3 and 4 the speed of the
individual elements deviated from the mean speed to
a by a random amount determined from a normal
distribution with spread of 1.32 deg/s. The motion
direction of each element was taken randomly from
a normal distribution of different spread. Six
different values of the spread were used: 2°, 5°, 10°,
15°, 25°, and 35°. They determined the level of
external directional noise.
2.3 Procedure
The task of the observers was to indicate whether the
mean direction of motion appeared to the left or to
the right of the vertical. In all experiments the
average direction of motion was downwards. After
each trial, an adaptive algorithm estimated the
angular deviation of the mean direction from the
vertical to be presented on the next trial.
Each subject participated in four experiments.
The experiments were divided in 3 blocks: a training
session of 60 trials and two experimental that
involved six separate adaptive QUEST (Watson &
Pelli, 1983) staircases of 40 trials for each noise
level. The subject sat at a distance of 114 cm from
the computer screen. The observation was
binocular.
2.4 Statistical Analyses
A non-parametric bootstrap procedure was applied
to the responses of each subject and experimental
condition to find a maximum-likelihood estimate of
the discrimination thresholds (tm) at which 82%
correct responses were obtained. A Weibull function
was used as a psychometric function model.
A between-within subjects ANOVA (mixed
ANOVA) with factors: age, gender and noise level
was applied to the log transformed thresholds
obtained in each experiment. A multivariate
approach (Rencher, 1995) was used to the within-
subject tests. A post-hoc Tukey HSD test was
applied to the results of ANOVA with factors: noise
and subjects to divide the participants in
homogeneous groups.
2.5 Clustering Algorithm
A fuzzy clustering technique that finds not well
separated data groups with vague and uncertain
boundaries was used. The clusters are described by
their centre. In the simplest case, this is a point in the
data space that is most representative for the cluster
in probabilistic sense. Every point of the data space
belongs to the distinct clusters with different degree
of membership – a value between 0 and 1, such that
if the data is close to the cluster centre, the
membership degree is closer to 1.
The widespread Fuzzy-C-Means (FCM)
algorithm (Bezdek, 1981) was applied. It is an
objective function-based algorithm with clustering
criteria defined as:
c
i
N
k
ik
m
ik
du
11
2
J ,
(1)
where N is the number of data points; c is the
number of clusters; u
ik
and d
ik
denote
correspondingly the membership degree and the
Euclidean distance of the data point x
k
, k=1,...,N, to
the i-th cluster centre, i=1,...,c. The coefficient
m
[1,) determines how much clusters may
overlap. Usually m=2 is taken.
As the number of data N=24 is relatively small,
meaningful partition could be expected for
clustering in no more than two or three clusters. The
appropriate c could be accessed through the cluster
validity measures that estimate the goodness of the
obtained partition (Babuska, 1998):
a) Average within-cluster distance (AWCD)
c
i
N
k
m
ik
N
k
ik
m
ik
u
du
c
1
1
1
2
1
AWCD
,
(2)
monotonically decreases with the number of
clusters.
b) Fuzzy hypervolume (Vh)
DATA ANALYSIS OF AGE-RELATED CHANGES IN VISUAL MOTION PERCEPTION
557
Ex
p
eriment 3 Ex
p
eriment 4
Experiment 1 Experiment 2
2 5 10 15 25 35
0
2
4
8
16
32
64
tm [
o
]
2 5 10 15 25 35
Older Younger
2 5 10 15 25 35
0
2
4
8
16
32
64
tm [
o
]
2 5 10 15 25 35
Older Younger
2 5 10 15 25 35
0
2
4
8
16
32
64
tm [
o
]
2 5 10 15 25 35
2 5 10 15 25 35
2
4
8
16
32
64
tm [
o
]
2 5 10 15 25 35
males
females
c
i
i
F
1
21/
)](det[Vh ,
(3)
where F
i
is a fuzzy covariance matrix of i-th cluster.
Good partitions are indicated by small values of Vh.
3 RESULTS AND DISCUSSION
3.1 Age and Gender Effects
In all experiments the mixed ANOVA results show
significant effect of age (F(1,20)=8.67; 6.60; 7.01
and 18.59 for Experiments 1-4, p<0.05) due to the
higher discrimination thresholds and thus, to the
lower sensitivity to motion direction, of the older
subjects. The gender has insignificant effect at
p=0.05 (F(1,20)=0.17; 2.58; 1.56 and 0.72 for
Experiments 1-4). The interaction between age and
gender was significant only in Experiment 2
(F(1,20)=4.91; p<0.05) due to the differences
between the male subjects from the two age groups.
The noise level had significant effect on the
performance; the thresholds increased with the
increase in the noise levels (F(5,16) = 13.37; 11.47;
19.66 and 15.66 for Experiments 1-4; p<0.05). No
significant interaction is observed between the noise
and either age or gender. The triple interaction was
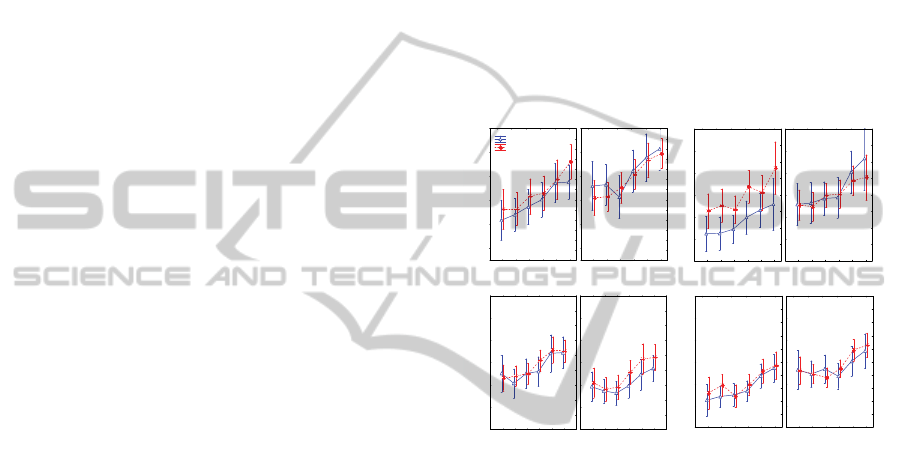
also insignificant at p=0.05. Figure 1 illustrates the
effect of the noise level on the mean thresholds in
each experiment.
An additional ANOVA was performed with age
and gender as between-group factors and dot
number, the speed variability (present or absent) and
the noise level as within-group factors. The results
show again a significant and independent of the
noise level effect of the age (F(1,20)=13.50;
p<0.05). The speed variability affects the sensitivity
to motion direction – when the speed of the
individual elements is different, the performance
improves (F(1,20)=4.55; p<0.05). This effect is
more profound for the denser displays as indicated
by the significant interaction between the dot density
and the speed variability (F(1,20)=6.62; p<0.05).
The interaction between the noise level and the
speed variability is also significant
(F(5,16)=4.99;p<0.05). This result might be an
indication for noise exclusion for a variable speed
(e.g. Lu & Dosher, 2009) due to a better match of
the spatial characteristics of the band-limited
elements to the optimal motion sensitive
mechanisms in the visual system.
To summarize, the results from the experiments
show that the sensitivity to differences in motion
direction declines with age. The lack of interaction
between the noise level and the age group indicates
that the age-related changes in performance are due
to an increase in the multiplicative noise in the
visual system i.e. the noise that depends on the
strength of the signal (e.g. Lu & Dosher, 2009). The
results suggest little effect of the gender on the
sensitivity to motion direction, implying that based
on their sensitivity to motion direction, the subjects
could be divided in two groups determined by their
age. The data do not allow distinguishing which
experimental conditions are best for evaluating the
changes in the performance due to either age or
gender.
Figure 1: Effect of the noise level (on the abscissa) on tm.
The error-bars represent one standard error.
In the mixed ANOVA each subject serves as
his/hers own control and the analysis permits
evaluating the contribution of the experimental
factors on the performance and the common trend of
the effects for the experimental groups. However, in
order to implement this analysis, we need to ensure
equal variance of the experimental groups and
therefore, independence of the variance on the size
of the noise level. In the cluster analysis such
restrictions are not obligatory and we seek for
groups based on the performance of the subjects
using the untransformed data (i.e. without the
logarithmic transformation of the thresholds).
First, the two-dimensional space determined by
the age and the individual discrimination threshold
tm for a particular noise level has been investigated.
The FCM clustering provides the trivial partition in
two clusters – the clusters of younger and of older
subjects. The cluster centres are not sensitive to the
noise level added to the stimuli and the clusters’
coordinates are at about 19.5 years and 73.5 years.
ICAART 2011 - 3rd International Conference on Agents and Artificial Intelligence
558
Experiment 1 Experiment 2
Experiment 3 Experiment 4
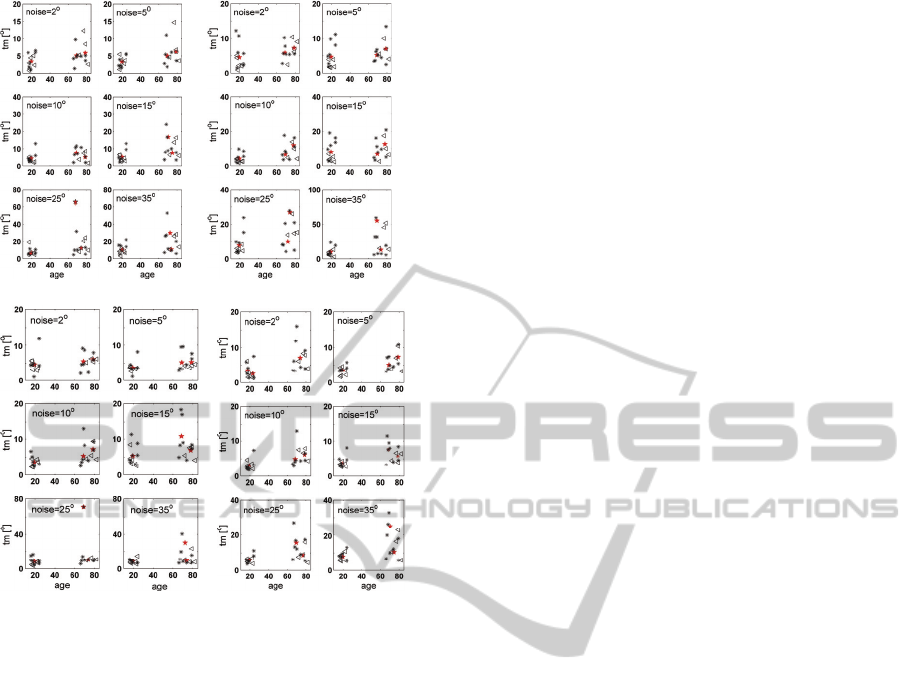
Figure 2: Clustering results for c=3. Red: cluster centre;
triangles – males; asterisks – females.
The diversity within the trivial groups could be
investigated by partition in three clusters. In this
case the clustering is not stable as it provides more
than one (local) minimum solution. Clustering, that
finds minima of the criteria (1), for different initial
partitioning was accepted. Additional assessment of
the clustering quality according to the performance
indexes (2) and (3) was done.
Except in Experiment 1 at noise level of 15º and
35º, the AWCD and Vh indexes decrease for c=3.
This means that the partitioning in three clusters is
more informative as the clusters are more compact
and well defined. The common tendency observed
is the splitting the older group (Figure 2). This
corresponds to the complexity of the ageing process
and it dependence on multitude of factors that leads
to larger individual differences at older age.
However, this fact is not equally expressed and
depends on the spatial and motion stimulus
parameters. Noise level of 15º for all data sets
provides unstable clustering for c=3 for different
initial partitioning.
How could we explain the differences between
these two analytical techniques? In the ANOVA we
have assumed that not only the age, but also the
gender of the subjects affects the performance and
we have compared the sensitivity to motion direction
of 4 groups defined by age and gender. In the
clustering, the grouping is determined by the age of
the subjects and their performance. The splitting of
the older group in two clusters does not necessarily
imply that this is due to the gender of the subjects.
Therefore, using two different methods of analysis
we have obtained complementary data about the
age-related effects in motion direction
discrimination.
3.2 Characterization of the Individual
Differences
To evaluate the individual differences in task
performance ANOVA with factors: noise and
subject (regarded as a random factor), was applied
for each experiment. We wanted to evaluate how
stable is the performance in the different
experiments and whether data from one
experimental condition could predict the
performance if the conditions are changed. For this
purpose, a post-hoc Tukey HSD test was applied and
the subjects were divided in homogeneous groups
based on their sensitivity to motion direction. The
correlation coefficients between the ordering of the
subjects based on their performance in the four
experiments suggest that among the 6 comparisons
significant correlation is obtained only between the
orderings in Experiments 1 and 4 (correlation
coefficient =0.62; p<0.05). The homogenous groups
include subjects of different age and gender
The results of the analysis are presented in a
graphic form in Figure 3. Each column corresponds
to a different subject and each colour represents a
different homogeneous group. It is clear that no
distinct groups are formed between the different age
groups. The possibility to describe the individual
differences between the subjects by applying post-
hoc tests is limited due to the fact that in these
analyses we could not ensure equality of the
variance of the individual data by any
transformation. The measurements for each subject
are few, and therefore, the violation of the ANOVA
assumptions will have greater impact. Also, in the
test we have disregarded the potential interaction
between the subjects and the noise level. We have
no good measure to affiliate each subject to a group.
In this study only 24 subjects took part in the
experiments and the minimal number of
homogeneous groups that obtained by the post-hoc
Tukey HSD test is six. If more subjects participated,
DATA ANALYSIS OF AGE-RELATED CHANGES IN VISUAL MOTION PERCEPTION
559
the grouping based on their performance may
become more complicated due to the undetermined
separation between the groups and their large
number. For this reason, we have applied cluster
analysis to the data.
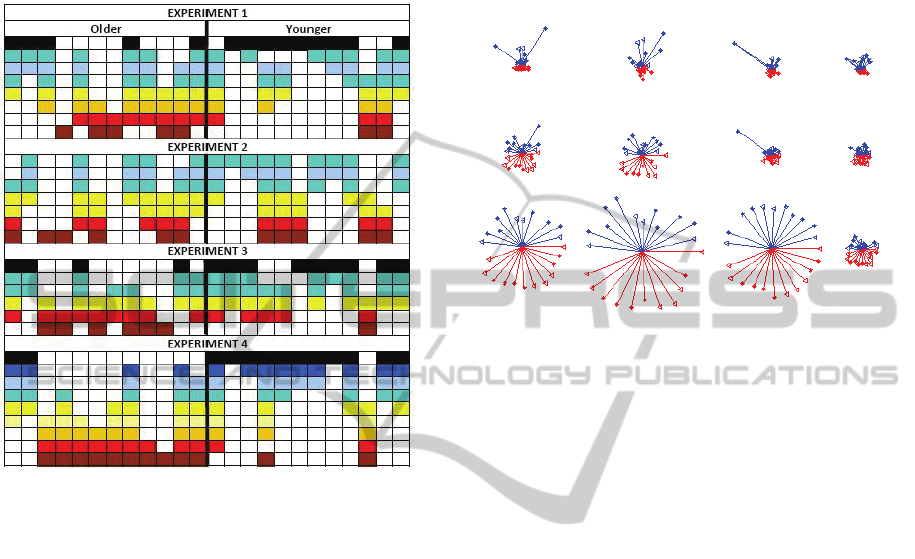
Figure 3: Representation of the homogeneous groups
defined by the post-hoc Tukey test. The first 12 columns
correspond to the older group, the second 12 – to the
younger one.
Information about the individual characteristics
of the subjects is searched by clustering in a higher
dimensional data space, defined by the noise level
values, independently of the subjects’ age and
gender. The division in three clusters is of a
particular interest as the participants are divided in a
group of high sensitivity (H) that corresponds to low
thresholds values, a group of medium (Md)
sensitivity and a low sensitivity group (L) that
corresponds to high thresholds values. The results
show that:
a) The cluster H of the low tm values contains
mainly younger people and a few older ones;
b) The medium cluster Md associates female and
male older subjects and few young females;
c) The cluster L is formed predominantly by the
older females.
The obtained fuzzy partition matrix assesses the
individual performance of a given subject to the
whole space partition. The level of association of a
person to every cluster is presented in Figure 4. It
could be seen that cluster H is more compact than
the others, which suggests small variation in the
sensitivity to motion direction of the members of
this cluster. As the others two groups predominantly
associate older people, this again confirms the
higher variability of the older group in comparison
with the younger one.
Figure 4: The distance of the individual discrimination
thresholds from the cluster centres. Each point represents
the data of a single subject. The order of the subjects in
each plot is the same. Triangles – male; asterisks – female;
blue – older participants; red – younger participants.
The general observation is that the clusters
overlap more for small noise levels as well as for
Experiments 1 and 2, whereas they are more
distinguishable for large levels of external noise.
When the external noise is low, the performance of
the subjects is limited mainly by the internal noise in
the visual system. At higher levels of external noise
the contribution of the internal noise decreases and
the performance is limited by the ability of the visual
system to “resist” to the external noise, for example,
by integrating the local motion information. The
clustering data suggest that the level of external
noise has little effect on the performance for the
participants in the high sensitivity group.
The cluster of the high thresholds depends
strongly on the external noise. In most experimental
conditions, except in Experiment 4, single subjects
belong to it, suggesting that they significantly
deviate in their performance from the rest of the
subjects. Experiment 4 allows the most distinct
separation of the subjects in different groups based
on their sensitivity to motion direction. It provides
the opportunity to classify reliably new subjects to
the existing groups and to treat the grouping as a
norm for characterizing people. The motion displays
in Experiment 4 contain a large number of moving
elements with varying speed where the different
realizations of the random samples might correspond
Medium sensitivity
Experiment 1 Experiment 2 Experiment 3 Experiment 4
Low sensitivity
High sensitivity
ICAART 2011 - 3rd International Conference on Agents and Artificial Intelligence
560

more closely to the characteristics of the
distributions associated with the noise level and the
speed of motion. In addition, the variable speed may
ensure optimal stimulation of the units in the brain,
sensitive to motion direction.
4 CONCLUSIONS
The common analytical approaches used to portray
the age-related changes in the different cognitive
processes provide a good description of the trends
associated with ageing and the experimental
conditions when differences occur. This makes them
a useful tool to characterize the process of ageing
and to seek association between the behavioural data
and the physiological changes in the brain. However,
these methods are less efficient when the individual
differences in the ageing process need to be
evaluated.
Our study is a first attempt to apply clustering
algorithms to differentiate the effects of age, gender
and individual differences on performance of a
behavioural task. The interpretation of the clustering
results allows detecting the deviation level of a
subject from the respective age group. Whether this
is related to degenerative processes or not, could not
be determined only by the results of the present
study; it requires tracking the changes in the
cognitive abilities of the participants in longitudinal
studies. However, our data analytic technique
provides opportunities to use psychophysical
methods for early diagnostics of the deterioration in
the cognitive abilities of the individual with age. The
results of the cluster analysis suggest also, that it is
easier to detect the individual deviations in
demanding tasks and difficult experimental
conditions.
ACKNOWLEDGEMENTS
This work was supported by grant TK01-200 of the
National Science Fund, Bulgaria.
REFERENCES
Habak, C., & Faubert, J., 2000. Larger effect of aging on
the perception of higher-order stimuli. Vision
Research, 40: 943–950.
Raz N., 2004. The aging brain observed in vivo:
differential changes and their modifiers. In: Cabeza R.,
Nyberg L. & Park D.C. eds. Cognitive neuroscience of
aging: linking cognitive and cerebral aging. New
York: Oxford University Press, 17-55.
Govenlock, S., Taylor, C. P., Sekuler, A. B. & Bennett , P.
J., 2009. The effect of aging on the orientation
selectivity of the human visual system. Vision
Research, 49: 2273-2284
Berard, J. R., Fung, J., McFadyen, B. J. & Lamontagne,
A., 2009. Aging affects the ability to use optic flow in
the control of heading during locomotion.
Experimental Brain Research, 194(2): 183-190.
Pilz, K. S., Bennett. P. J. & Sekuler, A. B., 2010. Effects
of aging on biological motion discrimination. Vision
Research, 50(2): 211-219
Allen, H. A., Hutchinson, C. V., Ledgeway, T., & Gayle,
P., 2010. The role of contrast sensitivity in global
motion processing deficits in the elderly. Journal of
Vision, 10: 15, 1–10,
Billino, J., Bremmer, F., & Gegenfurtner, K. R., 2008.
Differential aging of motion processing mechanisms:
Evidence against general perceptual decline. Vision
Research, 48: 1254–1261.
Rose, N. S., Rendell, P. G., McDaniel. M. A., Aberle, I., &
Kliegel, M., 2010. Age and individual differences in
prospective memory during a "Virtual Week": the
roles of working memory, vigilance, task regularity,
and cue focality. Psychology and Aging, 25: 595-605
Busey T., Craig J., Clark C. & Humes L., 2010. Age-
related changes in visual temporal order judgment
performance: Relation to sensory and cognitive
capacities. Vision Research, 50(17):1628-1640.
Hedden T. & Gabrieli, J. D., 2004. Insights into the ageing
mind: a view from cognitive neuroscience. Nature
Revues Neuroscience, 5: 87-96.
Watson, A. B. & Pelli, D. G., 1983. QUEST: a Bayesian
adaptive psychometric method. Perception &
Psychophysics, 33(2): 113-20.
Rencher, A. C., (1995). Methods of multivariate analysis.
John Wiley & Sons, Inc., New York.
Bezdek, J. C., 1981. Pattern Recognition with Fuzzy
Objective Function Algorithms. Plenum Press. New
York.
Babuska, R., 1998. Fuzzy Modeling for Control. Kluwer
Academic Publishers. Boston.
Lu, Z.-L., Dosher, B. A. 2009. Mechanisms of Perceptual
Learning. Learning and Perception, 1: 19–36.
DATA ANALYSIS OF AGE-RELATED CHANGES IN VISUAL MOTION PERCEPTION
561
