
INTELLIGENT PHONOCARDIOGRAM ANALYSIS AND
REPRESENTATION TOOL
J. P. Ramos, P. Carvalho, R. P. Paiva, L. Vale and J. Henriques
Department of Informatics Engineering, University of Coimbra, P
´
olo II, Coimbra, Portugal
Keywords:
Phonocardiogram analysis, eHealth, Intelligent stethoscope.
Abstract:
Cardiac auscultation is a highly sensitive, specific, cost effective and comfortable diagnosis technique for
many cardiovascular diseases. Unfortunately, it is observed that the art of auscultation is mastered by an in-
creasingly lower number of medical professionals. This paper presents a Matlab tool to support physicians in
performing auscultation. This application enables real time signal acquisition using off-the-shelf sensors and
performs several automatic annotation functions of heart sounds, such as noise contamination detection, seg-
mentation into S1, S2 and S3, S2-split detection, murmur detection and classification, systolic time intervals
measurement, contractility and stroke volume. These are related to the most pertinent clinical applications of
this signal. Moreover, it can also be used for auscultation training.
1 INTRODUCTION
Cardiovascular diseases (CVD) are a major health
problem in Europe, causing 42% of all deaths in the
European Union (EU). On top of that, CVD is es-
timated to cost the EU economy 192 billion a year.
Moreover, 54% of that cost can be accounted for by
the expenses of an inpatient hospital care for people
who have CVD and another 28% to drugs (Allender
et al., 2008).
To prevent such high costs in health care, a mea-
sure that can be pursued, aside from fostering a
healthy lifestyle, is to prevent and control CVDs at
an early stage. Moreover, more than just use any di-
agnostic tool available, such as an echocardiography,
which leads often to unnecessary and inefficient use
of resources, one ought to seek sources of diagno-
sis that can equally make an accurate referral decision
and, at the same time, be less expensive (Shub, 2003).
The heart sounds have been carefully studied and
related to physiological events within the heart (Wa-
trous, 2006). Either by the presence of a specific heart
sound or its acoustic properties, one is able to infer
important diagnostic analysis. Characteristics such as
timing, relative intensity and frequency, form the ba-
sis of auscultatory and phonocardiographic diagnosis
of CVDs.
However, cardiac auscultation has its disadvan-
tages. First and foremost, by having their dominant
frequencies below the threshold of hearing, the heart
sounds are barely audible; secondly, auscultation is
dependent on the physicians’ judgement, therefore the
diagnosis is subjective; last but not least, studies have
shown that medical schools have been disregarding
the teaching of auscultation (Mangione et al., 1993),
and that cardiac examination skills may decline over
the years mostly due to a lack of continuous training
(Lam et al., 2005; Vukanovic-Criley et al., 2006).
To overcome these difficulties, computer-aided
auscultation attempts to assist a general practitioner
in judging an appropriate referral. By means of sig-
nal processing techniques, algorithms have been de-
veloped for elementary processing function, such as
heart sound segmentation and murmur classification,
and more recently for systolic time measurements, i.e.
the pre-ejection period (PEP) and the left ventricle
ejection time (LVET), and cardiac function indexes
such as cardiac output, stroke volume and contractil-
ity. Although several frameworks can be found in the
literature that tackle the former (Rajan et al., 1998;
Kudriavtsev et al., 2007), none of the aforementioned
tackle the latter processing functions.
Some applications can be found in the literature.
In (Reed et al., 2009) a software application is pre-
sented that displays graphical representations of heart
sound signals and manage existing acquisitions, but
still lacks the ability to make acquisitions - recordings
are uploaded to the application - and identify heart
sound components or other information from phono-
cardiograms (PCGs), as this is currently being made
186
P. Ramos J., Carvalho P., P. Paiva R., Vale L. and Henriques J..
INTELLIGENT PHONOCARDIOGRAM ANALYSIS AND REPRESENTATION TOOL.
DOI: 10.5220/0003137401860192
In Proceedings of the International Conference on Health Informatics (HEALTHINF-2011), pages 186-192
ISBN: 978-989-8425-34-8
Copyright
c
2011 SCITEPRESS (Science and Technology Publications, Lda.)

by cardiologists that listen to and describe the sounds.
A commercially available service is briefly described
in (Watrous, 2006). Although this has more features
than the previous one, the processing module only
provides information regarding segmentation results
and murmur identification, lacking information such
as systolic time measurements and cardiac functions
assesment, which also provide rich information to a
more accurate decision by the physician.
In this paper we introduce an intelligent stetho-
scope (fig. 2) implemented with an off the shelf sen-
sor and a Matlab tool for the acquisition, analysis,
management and visualisation of cardiac signals. We
will mainly focus in the last three features of the ap-
plication (see figure 1), whereas a more detailed de-
scription of the processing module can be found in
(Carvalho et al., 2011). The goals behind this tool are
to provide not only detailed information on the heart’s
function to a physician in his/her diagnostic referral,
but also a learning tool or a skill trainer to any medical
trainee.
The paper is organised as follows: in Section 2,
the signal acquisition toolbox is described. Section 3
presents the data management module and section 4
delineates the user interface layer of the application.
Finally, conclusions and future work are discussed in
section 5.
Figure 1: Layer Architecture of the application.
2 SIGNAL ACQUISITION
TOOLBOX
The cardiac signal acquisition process plays an im-
portant role in this solution. It might not only be nec-
essary to acquire heart-sound signals but also ECG
signals in order to feed the processing layers with the
necessary data to assess a patient cardiac condition.
Furthermore, the need to integrate off-the-shelf or al-
ready available cardiac signal sensors is of absolute
importance, since the platform adoption on behalf of
the physicians depends heavily on its ability to make
use of already available equipment.
2.1 Sensor Middleware
Given the signal acquisition needs, we decided to
adopt an already available sensor middleware solution
(Brito et al., 2010) that was developed inside our re-
search group.
The main features supplied by this component are:
(i) off-the-shelf heterogeneous sensor integration; (ii)
ease of deployment, since we only have a single soft-
ware component; (iii) data relaying capabilities be-
tween middleware instances; (iv) service access trans-
parency; (v) integration of data processing routines,
such as diagnosis support algorithms; (vi) sensor dis-
covery, registry and admission features as well as
communication Quality of Service (QoS) capabilities,
such as management of communication channels per-
sistency.
Depicted on figure 3 we can see a simplified di-
agram of the Signal acquisition toolbox architecture.
This includes the native sensor middleware as well as
a Matlab API.
Under the native sensor middleware, the integra-
tion of an arbitrary number of off-the-shelf devices
is accomplished with the definition of Data-Source
and Data-Sink abstractions in the various layers of
the middleware. The data provided by the sensors is
made available to the upper layers through the use of a
service-oriented approach where a consumer can sub-
scribe and unsubscribe any given number of services
published in the middleware component. The service
subscription process requires that the consumer pro-
vides a Data-Sink to where the data will be relayed
as soon as they become available. Another function-
ality relies on the ability to associate data process-
ing schemes to available services and providing them
seamlessly to the consumer. In this way, one can ac-
cess non-existent raw sensor data through the process-
ing of existing services, i.e. given the unavailability
of ECG quality evaluation mechanisms or Heart Rate
(HR) estimation and the existence of an ECG service
it is possible to determine this missing parameter and
publish it as a service for consumption.
Data logging capabilities are also present. A con-
sumer can specify the services that should be stored.
Access to the stored data can be made by subscrib-
ing to the services published by the data logger on the
middleware service layer.
Also, given the component modularity it is pos-
sible to expand its communication capabilities since
the middleware adopts communication protocol plug-
in mechanisms. In this way, this component presents
itself as a highly expandable and flexible solution al-
lowing for the integration of an arbitrary number of
communication protocols.
INTELLIGENT PHONOCARDIOGRAM ANALYSIS AND REPRESENTATION TOOL
187
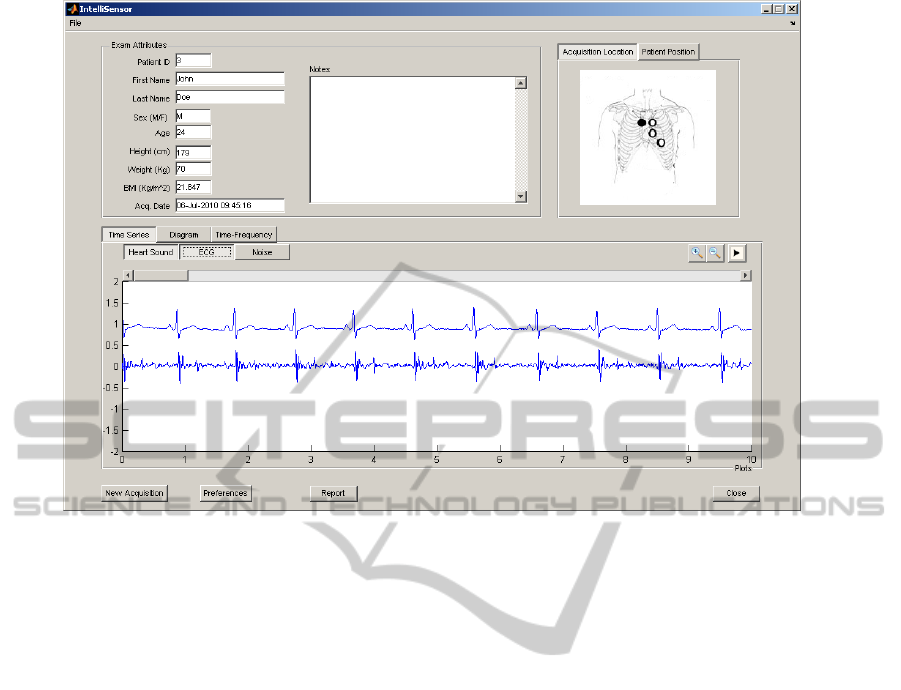
Figure 2: Main Window of the application where the user can find (i) patient information, (ii) relevant auscultation information
and (iii) graphical representations of cardiac signals.
As of now, it already provides support for TCP/IP,
UDP/IP, Bluetooth and 802.15.4 with several data ex-
change protocols, but it might also integrate the IEEE
11073 protocol in order to support medical device
systems, enabling the middleware to act as a dis-
tributed signal aggregator in a x73 network.
One of the drivers implemented was a generic au-
dio driver that acts as a Data-Source. This driver is
perfectly suited to acquire Heart-Sound signals from
available audio devices and is able to handle multi-
channel acquisition of audio up to 44100Hz.
2.2 Matlab Interface Solution
Having addressed the signal acquisition needs with
the adopted sensor middleware, which was developed
in C++ (and since the tool depicted in this paper fo-
cuses a Matlab environment), the integration of the
acquisition component was required. For this task
several integration techniques supported by Matlab
were considered.
First, the definition of a Java API that could be
accessed directly by Matlab on one side and a JNI in-
terface to access the middleware native code on the
other was a possibility. However this would intro-
duce some overhead since the data would have to be
translated from C++ to Java and from Java to Matlab.
Another problem with this approach relies on the fact
that Matlab requires the use of a specific version of
Java Virtual Machine (JVM) so future compatibility
could be an issue.
Another approach focused on the use of Matlab
Executables (MEX). This technique allows that dy-
namically linked subroutines produced from C, C++
and Fortran can be called from within Matlab. This
brings evident advantages compared with the Java ap-
proach since we will only need to define one API sim-
plifying the implementation process but also reducing
the data translation overhead. Moreover, in terms of
future compatibility as well as retro-compatibility we
would no longer need to worry about third-party soft-
ware since the MEX integration technique was cre-
ated by Mathworks itself and has had a long-lasting
support throughout Matlab releases.
So, as for this integration task, the MEX approach
was implemented.
As we stated above, the MEX approach re-
quires the definition of dynamically linked subrou-
tines (DLL). Additionally, each DLL is restricted to
only one routine. Thus, in order to provide a func-
tional API, the definition of several DLLs that ac-
cess a singleton instance of the native middleware was
needed. Also, the inability to define callback rou-
tines to push acquired data to the Matlab environment
forced us to specify an intermediate data buffering
layer. As a result, the process of subscription of a cer-
HEALTHINF 2011 - International Conference on Health Informatics
188
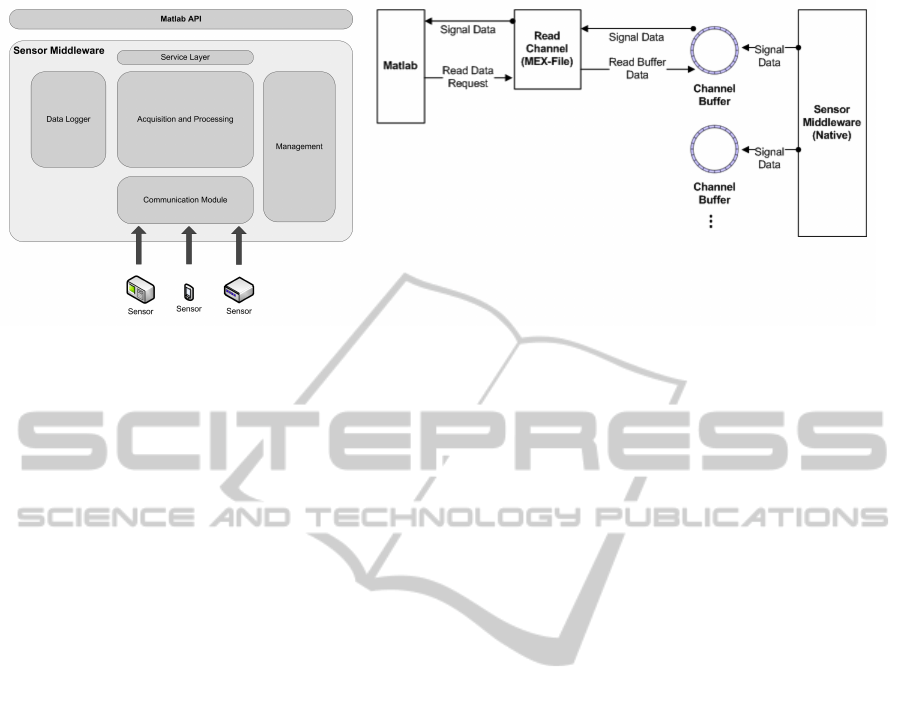
Figure 3: The left picture depicts the sensor middleware and Matlab interface architecture. The right picture shows the Matlab
access to read channel MEX routine.
tain service through this interface triggers the creation
of a ring buffer for temporary service data storage. In
order to access the subscribed service data a polling
approach is necessary. To this end, a read channel
MEX routine must be called from within Matlab (Fig.
3) that retrieves the data temporarily stored.
Further functionalities are made available at
the Matlab API level, such as the connec-
tion/disconnection as well as the detection of
available devices, service subscription management,
namely subscribe/unsubscribe routines as well as the
listing of subscribed and non-subscribed services.
Also the ability to retrieve status information on a
given subscription such as the service signal fre-
quency or the number of available temporary stored
samples are provided. Service log management rou-
tines are also present.
3 DATA MANAGEMENT
3.1 Persistent Storage
In order to keep record of past acquisitions, a persis-
tent storage must be present along with the applica-
tion. The database structure can be very simple if
one takes into account some assumptions to be true.
The assumptions are related to patient information
like age, weight, body mass index (BMI), etc., that
even though they are dynamic and change over time,
their variation is not going to be relevant. Besides the
patient information, the database also saves data from
collected acquisitions, such as the signals acquired
and their processing results, and from any pathologies
that may be found in the acquisition.
The database engine system chosen to provide
persistent storage was SQLite (SQLite, 2010). The
motivations behind this decision are that this engine
is open-source, small and quite reliable. Moreover,
it is only a single file which makes the backups op-
eration easier and the ability to accept binary large
objects (BLOBs) was mandatory.
This engine is, nonetheless, implemented in C++
and an interface between SQLite and Matlab was nec-
essary. Rather than building our own interface, we
have decided to use the one found in (mksqlite, 2010).
This interface is able to perform almost every SQL
command but lacks the ability to transfer BLOBs.
Concerning this issue, we have adapted the original
interface to accept BLOBs.
3.2 Import/Export
Another property of the data management module is
the faculty to import and export patient’s records. The
format used to carry the information is XML (eXten-
sible Markup Language) and Matlab already provides
means to parse such documents. A patient record con-
sists of not only personal information but also all the
acquisitions’ data collected and all the pathologies
information found in every single acquisition. Fig-
ure 4 provides a small extract of the respective XSD.
Among other characteristics, a XSD file gives a basic
overview of the final XML structure.
This feature enables the transfer between comput-
ers with the application so that, for instance, relevant
cases can be shared for training.
4 USER INTERFACE
The Graphical User Interface (GUI) works as the
”middleman” between the user and the rest of the ap-
plication modules. The GUI allows the user to:
INTELLIGENT PHONOCARDIOGRAM ANALYSIS AND REPRESENTATION TOOL
189

<?xml version="1.0" encoding="UTF-8"?>
<xs:schema
xmlns:xs="http://www.w3.org/2001/XMLSchema"
elementFormDefault="qualified">
(...)
<xs:element name="acquisition">
<xs:complexType>
<xs:sequence>
<xs:element ref="date"/>
<xs:element ref="location"/>
<xs:element ref="position"/>
<xs:element ref="notes"/>
<xs:element ref="prim_sound"/>
<xs:element ref="ref_sound"/>
<xs:element ref="ecg"/>
<xs:element ref="noise"/>
(...)
</xs:sequence>
<xs:attribute name="id" use="required"
type="xs:integer"/>
</xs:complexType>
</xs:element>
(...)
<xs:element name="prim_sound">
<xs:complexType>
<xs:sequence>
<xs:element ref="fs"/>
<xs:element ref="data"/>
</xs:sequence>
</xs:complexType>
</xs:element>
(...)
<xs:element name="data">
<xs:complexType>
<xs:sequence>
<xs:element
maxOccurs="unbounded" ref="sample"/>
</xs:sequence>
</xs:complexType>
</xs:element>
(...)
</xs:schema>
Figure 4: XSD schema extract for acquisition data.
• manage patient data (new patient record; save ac-
quisition, etc);
• make new acquisitions from a digital stethoscope
or load sound clips from a database or from an-
other application;
• configure processing operations to be performed;
• visualise the acquired signals;
• examine the results returned from the processing
module;
4.1 Signal Representation
Rather than viewing raw, unprocessed plots of PCG
signals which are complex to interpret, a simpler
graphical representation is favoured in order to rep-
resent the PCG. This representation (see figure 5)
seems to be acknowledged not only in the eHealth
field (Jiang and Choi, 2006; Tovar-Corona and Torry,
1997; Reed et al., 2009) but also in traditional medi-
cal field (Shaver et al., 1990; Karnath and Thornton,
2002).
Figure 5: Diagram representation of the heart sound signal.
With this representation, heart sound components
found during segmentation are graphically displayed
with their estimated start and end times, reducing the
burden that a physician would have to cope when vi-
sualising a PCG. The graphical representation scheme
adopted in this work is the one suggested by (Reed
et al., 2009; Shaver et al., 1990).
4.2 Acquisition Window
Using the aforementioned signal acquisition toolbox,
and along with a digital stethoscope, one is able to ac-
quire new signals. Beforehand, the user may provide
information such as the patient position and where the
auscultation will take place (see figure 6), by choos-
ing from a preset of possible options. These are rel-
evant since different heart sound components can be
best heard in specific positions/locations.
As soon as the acquisition ends, the signals ac-
quired are transferred to the signal processing tool-
box. By default there is an already defined analysis
workflow. Nevertheless, the user can select and pa-
rameterize a subset of processing algorithms in ad-
vance.
4.3 Report Window
After the cardiac signal is processed, the physician
has several ways to examine the acquisition and its
resulting computation values.
In the main window (figure 2) the physician (i)
can auscultate the heart sound signal, (ii) examine ei-
ther the raw cardiac signal or its respective diagram
representation and (iii) find the processing values an-
notated beat by beat.
Moreover, there is also a report (figure 7) which
summarises the complete acquisition in a single win-
dow. The report displays (i) patient information, (ii)
acquisition information and its processing results with
HEALTHINF 2011 - International Conference on Health Informatics
190
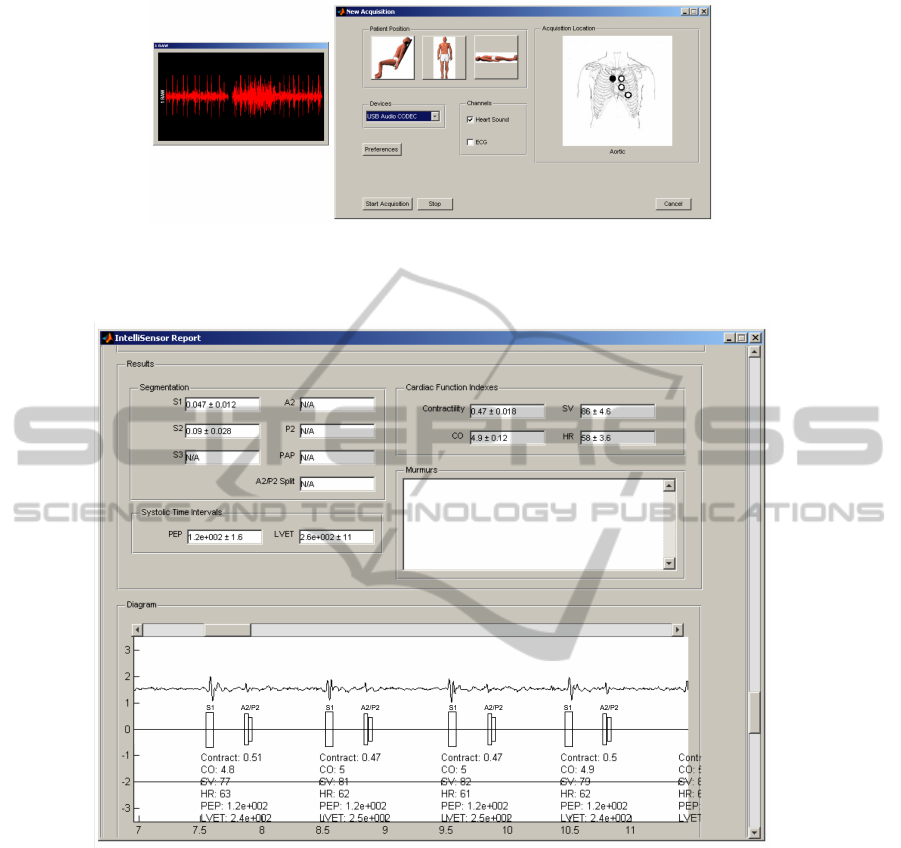
Figure 6: Real-Time visual representation of heart sound signal acquisition, is depicted on the left figure. The right figure is
the acquisition window. The user can select the (i) auscultation location, (ii) patient position, (iii) channels to acquire and (iv)
the processing workflow.
Figure 7: Report Window. Summarises an acquisition in a single window, giving both patient and auscultation information
and also, the computation results.
their mean values and respective standard deviation,
and (iii) the plot of the cardiac signal with its annota-
tions, providing an overview of the exam.
5 CONCLUSIONS AND FUTURE
WORK
Fewer and fewer physicians master the art of car-
diac auscultation. In this paper we propose a Mat-
lab tool to support physicians in performing ausculta-
tion. This application enables real time signal acqui-
sition using off-the-shelf sensors and performs sev-
eral automatic annotation functions of heart sounds,
such as noise contamination detection, segmentation
into S1, S2 and S3, S2-split detection, murmur de-
tection and classification, systolic time intervals mea-
surement, contractility and stroke volume.
Although other clinical applications exist in the
literature, they lack some important features like more
complex signal processing modules that help support-
ing the physicians decision. The proposed user inter-
face enables the physician to evaluate the auscultation
exam in several options: the physician can view the
raw signal as well as its beat-by-beat annotated ver-
sion. The later applies the graphical representation
suggested by (Reed et al., 2009). Finally, a report
functionality has been incorporated that presents an
INTELLIGENT PHONOCARDIOGRAM ANALYSIS AND REPRESENTATION TOOL
191

overall overview of the exam using numerical aver-
age values.
As future work, we expect to deploy the applica-
tion in a clinical environment for a pilot study in or-
der to evaluate its effectiveness in decision support in
daily clinical practice as well as a learning tool to im-
prove auscultation proficiency.
ACKNOWLEDGEMENTS
This work was supported in part by SoundForLife
(PTDC/EIA/68620/2006; FCOMP-01-0124-FEDER-
007243) financed by the Portuguese Foundation for
Science and Technology.
REFERENCES
Allender, S., Scarborough, P., Peto, V., and Rayner, M.
(2008). European cardiovascular disease statistics.
British Heart Foundation Health Promotion.
Brito, M., Vale, L., Carvalho, P., and Henriques, J. (2010).
A sensor middleware for integration of heterogeneous
medical devices. In Engineering in Medicine and
Biology Society, 2010. EMBC 2010. Annual Interna-
tional Conference of the IEEE.
Carvalho, P., Paiva, R. P., Kumar, D., Ramos, J. P., Santos,
S., and Henriques, J. (2011). A framework for acous-
tic cardiac signal analysis. BioStec: BioSignals 2011
(accepted).
Jiang, Z. and Choi, S. (2006). A cardiac sound characteris-
tic waveform method for in-home heart disorder mon-
itoring with electric stethoscope. Expert Systems with
Applications, 31(2):286 – 298.
Karnath, B. and Thornton, W. (2002). Auscultation of the
heart. Hospital Physician, pages 39–43.
Kudriavtsev, V., Polyshchuk, V., and Roy, D. (2007). Heart
energy signature spectrogram for cardiovascular diag-
nosis. BioMedical Engineering OnLine, 6(1):16.
Lam, M. Z. C., Lee, T. J., Boey, P. Y., Ng, W. F., Hey, H. W.,
Ho, K. Y., and Cheong, P. Y. (2005). Factors influ-
encing cardiac auscultation proficiency in physician
trainees. Singapore Med J, 46(1):11–4.
Mangione, S., Nieman, L. Z., Gracely, E., and Kaye, D.
(1993). The Teaching and Practice of Cardiac Aus-
cultation during Internal Medicine and Cardiology
Training: A Nationwide Survey. Annals of Internal
Medicine, 119(1):47–54.
mksqlite (2010). http://mksqlite.berlios.de/mksqlite eng.html/.
Rajan, S., Doraiswami, R., Stevenson, R., and Watrous,
R. (1998). Wavelet based bank of correlators ap-
proach for phonocardiogram signal classification. In
Time-Frequency and Time-Scale Analysis, 1998. Pro-
ceedings of the IEEE-SP International Symposium on,
pages 77 –80.
Reed, N., Nie, Y., and Mahnke, C. (2009). A portable
graphical representation tool for phonocardiograms.
In Engineering in Medicine and Biology Society,
2009. EMBC 2009. Annual International Conference
of the IEEE, pages 3111 –3114.
Shaver, J. A., Leonard, J. J., and Leon, D. F. (1990). Aus-
cultation of the Heart - Examination of the Heart, vol-
ume 4. American Heart Association.
Shub, C. (2003). Echocardiography or auscultation? how
to evaluate systolic murmurs. Can Fam Physician,
49:163–7.
SQLite (2010). http://www.sqlite.org/.
Tovar-Corona, B. and Torry, J. (1997). Graphical represen-
tation of heart sounds and murmurs. In Computers in
Cardiology 1997, pages 101–104.
Vukanovic-Criley, J. M., Criley, S., Warde, C. M., Boker,
J. R., Guevara-Matheus, L., Churchill, W. H., Nelson,
W. P., and Criley, J. M. (2006). Competency in car-
diac examination skills in medical students, trainees,
physicians, and faculty: a multicenter study. Arch In-
tern Med, 166(6):610–6.
Watrous, R. L. (2006). Computer-aided auscultation of the
heart: from anatomy and physiology to diagnostic de-
cision support. Conf Proc IEEE Eng Med Biol Soc,
1:140–3.
HEALTHINF 2011 - International Conference on Health Informatics
192
