
AN IMPROVED APPROACH FOR REAL-TIME DETECTION
OF SLEEP APNEA
Baile Xie, Wenxun Qiu, Hlaing Minn, Lakshman Tamil and Mehrdad Nourani
Department of Electrical Engineering EC33, University of Texas at Dallas
800 W. Campbell Road, TX 75080, Richardson, U.S.A.
Keywords:
Sleep anpea, SpO
2
, Real-time detection, Feature selection, Cost-sensitive.
Abstract:
The traditional diagnosis of sleep apnea and hypopnea syndrome (SAHS) requires an expensive and complex
overnight procedure called polysomnography (PSG). Recently, finding valid alternatives for SAHS diagno-
sis has attracted much research attention. This paper focuses on the real-time monitoring and detection of
SAHS based on the arterial oxygen saturation signal measured by pulse oximetry (SpO
2
). We develop a more
comprehensive feature set and a more appropriate annotation criterion, if compared to the existing approaches
in the literature. To enjoy competitiveness in computational complexity, we also propose a reduced feature
set which provides a higher sensitivity and better adaptivity to distinct databases. The performances of 15
commonly used classifiers with different cost matrixes are assessed on different databases, offering detailed
insights on the diagnostic abilities of these methods.
1 INTRODUCTION
Sleep apnea and hypopnea syndrome (SAHS) is a
common sleep disorder which is estimated to affect
2% of middle-aged women and 4% of middle-aged
men (Young et al., 1993). The impacts of SAHS
include daytime sleepiness, fatigue, traffic accidents
and depression. It is also blamed for linkage to is-
chemic heart disease, cardiovascular disfunction and
stroke. The clinical definition of apnea involves a
cessation of airflow for at least 10 seconds while hy-
popnea is defined as a minimum 10-second airflow
reduction with either a blood oxygen desaturation of
4% or a neurological arousal (Magalang et al., 2003).
Currently, polysomnography (PSG) is regarded as the
golden standard for SAHS diagnosis. However, PSG
requires patients to sleep overnight in a sleep labora-
tory with attended technicians. A variety of recorded
signals are then analyzed by sleep specialists for final
diagnosis. The time- and cost-consuming natures of
PSG limit its prevalence among public, which makes
a readily available, relatively inexpensive and reliable
diagnosis alternative much desirable. Existing SAHS
detection techniques have been developed based on
questionnaires (Netzer et al., 1999), ECG (McNames
and Fraser, 2000,Shinar et al., 2000, Heneghan et al.,
2008), snoring (Ng et al., 2006) and pulse oximetry
(Magalang et al., 2003,L´evy et al., 1996,Olson et al.,
1999, Zamarr´on et al., 2003, Alvarez et al., 2006,
Oliver and Flores-Mangas, 2006, Heneghan et al.,
2008,Linet al., 2008,Burgoset al., 2010), either alone
or in combination. Due to the strong reflection of ar-
terial oxygen saturation on the breathing airflow fluc-
tuation and the convenience and availability of pulse
oximetry, we focus on SpO
2
signal in this paper for
SAHS detection.
Previous studies have proposed many quantitative
indexes derived from SpO
2
signal for SAHS detec-
tion. Among the commonly used time-domain in-
dexes are the accumulative time spent below a cer-
tain saturation level (Magalang et al., 2003, Olson
et al., 1999), the oxygen desaturation index (ODI,
the number of oxyhemoglobin desaturation below a
certain threshold) (Lin et al., 2008), and the satura-
tion variability index (Delta index) (Magalang et al.,
2003, L´evy et al., 1996, Olson et al., 1999). Besides,
Zamarrn et al. (2003) exploited the periodogram of
SpO
2
signal and discovered that the period 30s to 70s
is the interval of interest (P
30−70
). The four indexes
are related to the periodogram as the total area under
periodogram, the area enclosed in the periodogram
within P
30−70
, the area ratio of that within P
30−70
with
respect to the total periodogram area, and the peak
amplitude of the periodogram in P
30−70
, respectively.
169
Xie B., Qiu W., Minn H., Tamil L. and Nourani M..
AN IMPROVED APPROACH FOR REAL-TIME DETECTION OF SLEEP APNEA.
DOI: 10.5220/0003137101690175
In Proceedings of the International Conference on Bio-inspired Systems and Signal Processing (BIOSIGNALS-2011), pages 169-175
ISBN: 978-989-8425-35-5
Copyright
c
2011 SCITEPRESS (Science and Technology Publications, Lda.)

Later on, several non-linear parameters such as ap-
proximate entropy (ApEn), central tendency measure
(CTM) and Lempel-Ziv complexity (LZC) are also
derived from the SpO
2
signal as the indexes for SAHS
detection (Alvarez et al., 2006).
However, all the methods mentioned above per-
form in the context of the overnight SpO
2
records,
rendering a delayed off-line analysis and diagnosis.
Recently, the idea of real-time SAHS monitoring and
diagnosis is proposed as a promising alternative of
PSG. The work in (Oliver and Flores-Mangas, 2006)
introduces the real-time implementation of SAHS de-
tection but lacks of a performance comparison with
the standard PSG detection. Heneghan et al. (2008)
adopt the ECG and SpO
2
signals jointly to estimate
the apnea plus hypopnea index (AHI) on an epoch
basis. Most recently, Burgos et al. (2010) imple-
ment a systematic real-time SAHS detection based on
the Apnea-ECG database (CinC, 2000) available on-
line from PhysioNet (Goldberger et al., 2000), attain-
ing a classification accuracy of 93.03%, sensitivity
of 92.35% and specificity of 93.52%, upon specified
training and testing sets. Unfortunately, this database
contains only 8 recordings with SpO
2
signal. The lim-
ited sample number casts uncertainty on the general
applicability and robustness of this approach.
In this paper, we first implemented the method in
(Burgos et al., 2010) (labeled as RT for short) on an-
other database St. Vincent’sUniversity Hospital / Uni-
versity College Dublin Sleep Apnea Database (UCD
Database) (UCD, 2000) which can also be found on
PhysioNet. Even with a weighted cost matrix, though
RT method gets a specificity of 96.12% and accu-
racy of 89.92%, the sensitivity drops dramatically to
33.63%, which is far from satisfactory. For the pur-
pose of SAHS detection, we would rather misclassify
a healthy person as SAHS positive, than let an SAHS
patient go unidentified. High sensitivity is preferable
over high specificity in this case. With this recogni-
tion, our paper offers contributions in the following
aspects: (1) Conversion of most of the existing in-
dexes into epoch-based (1-minute based) features. (2)
Forming a more comprehensive feature set of SpO
2
signal with higher sensitivity. (3) Proposal of a more
appropriate criterion of segment annotations. (4) Pro-
posal of a reduced feature set with better diagnostic
ability and computational efficiency. (5) Validation
of the performance of the proposed approach on two
distinct databases. (6) The performance assessment
of 15 classifiers with different cost-sensitivities upon
two databases.
The rest of the paper is organized as follows: In
Section 2, we introduce the two databases used and
explain the new approach in feature extraction. Sec-
tion 3 describes the experiments and discusses the re-
sults. Finally, Section 4 concludes this paper.
2 NEW INVESTIGATIONS
2.1 Database Description
PhysioNet provides a variety of physiological signals
for biomedical research. Both databases we used are
available from the web site, which offers easy valida-
tion and assessment of our approach.
• Apnea-ECG Database. This database contains
8 recordings with SpO
2
signals. Associated with
each signal is a reference annotation file cre-
ated by a sleep expert based on simultaneously
recorded respiration and oxygen saturation sig-
nals. The annotation is given on a 1-minute basis.
Each minute is labeled as ‘A’ when apnea was in
progress at the beginningof the associated minute,
otherwise this minute is label as ‘N’. We name this
annotation definition as AN for short. To make use
of this kind of annotation, the real-time monitor-
ing system is designed to give the detection result
minute by minute.
• UCD Database. This database comprises of 25
full overnight PSG recordings, each of which con-
tains an SpO
2
signal. The annotations are pre-
pared by sleep technologists who detailed the on-
set time and duration of every apnea and hypop-
nea event. In order to define the reference annota-
tion on a 1-minute basis, two labeling criteria are
used. The first one applies the same technique in
Apnea-ECG database. Considering that the ap-
nea and hypopnea associate with a minimum of
10 second airflow change, in case the events are
across two adjacent segments, the second crite-
rion marks a single minute as ‘Apnea’ if it con-
tains at least 5 consecutive seconds of apnea and
hypopnea events, otherwise this minute is labeled
as ‘No apnea’. This criterion is termed as AH5C
in the following. Note that the same annotation is
also used in (Heneghan et al., 2008) except in an
overlapped epochs scenario.
2.2 Signal Processing
The SpO
2
signals from both databases are downsam-
pled at 1 Hz and the outliers lie in [0, 50%] are re-
moved to avoid outfitting. In order to inherit the mer-
its of existing metrics of the SpO
2
, we devise to mod-
ify the indexes and incorporate them in the real-time
detection method. To begin with, the SpO
2
signals
BIOSIGNALS 2011 - International Conference on Bio-inspired Systems and Signal Processing
170
are segmented into 1-minute epochs. Then, the ex-
isting indexes are computed for each 1-minute epoch.
In particular, the ODI indexes, apart from the ones
in (Burgos et al., 2010), set the baseline as the mean
of the top 20% of the SpO
2
data within one minute,
and then sum up the number of samples which fall be-
low it. As a result, the features ODI2, ODI3, ODI4,
and ODI5 represent the ODI indexes corresponding
to 2%, 3%, 4%, and 5% below the baseline, respec-
tively. Delta index is viewed as a valid parameter for
overnight SAHS detection. To translate it into our
real-time processing, the minimal SpO
2
value in ev-
ery 12-second interval is picked and the Delta index
is derived as the sum of the absolute differences be-
tween two successive dips, dividing by the number of
intervals, i.e., 5 in one minute. The nonlinear meth-
ods such as ApEn, CTM, and LZC can also be easily
applied segment-wise. Specifically, we choose radii
of 0.25, 0.5, 0.75 and 1 for CTM corresponding to
CTM25, CTM50, CTM75, CTM100 features, respec-
tively.
Since the apnea/hypopnea event can last as long
as 120 seconds (Oliver and Flores-Mangas, 2006),
which exceeds the epoch length, we rule out the
frequency-domain indexes in our real-time process-
ing and focus on the ones derived directly from the
time-domain recordings.
Combined with the eight features used in (Burgos
et al., 2010), a more comprehensive feature set (la-
beled as ALL) is formed containing 19 features in all.
Classification experiments and further feature selec-
tion are carried out based on this feature set in the
following section.
3 EXPERIMENT AND RESULT
DISCUSSION
We use WEKA (Hall et al., 2009), an open-source
machine learning software as the major tool to as-
sess the performances of 15 classic classification al-
gorithms with their default parameter setting. Be-
sides the Bagging with ADTree suggested in (Burgos
et al., 2010), Bagging with REPTree, Support Vector
Machine (SVM), Naive Bayes, Multilayer Perceptron
(MLP), Radial Basis Function Network (RBFNet-
work), Decision Stump, J48 (C4.5) tree and so on are
all tested to find out the most appropriate candidates
for real-time SAHS detection. All the classification
performances, namely, the sensitivity, specificity and
accuracy are based on ten repetitions of 10-fold cross
validation for a more accurate evaluation.
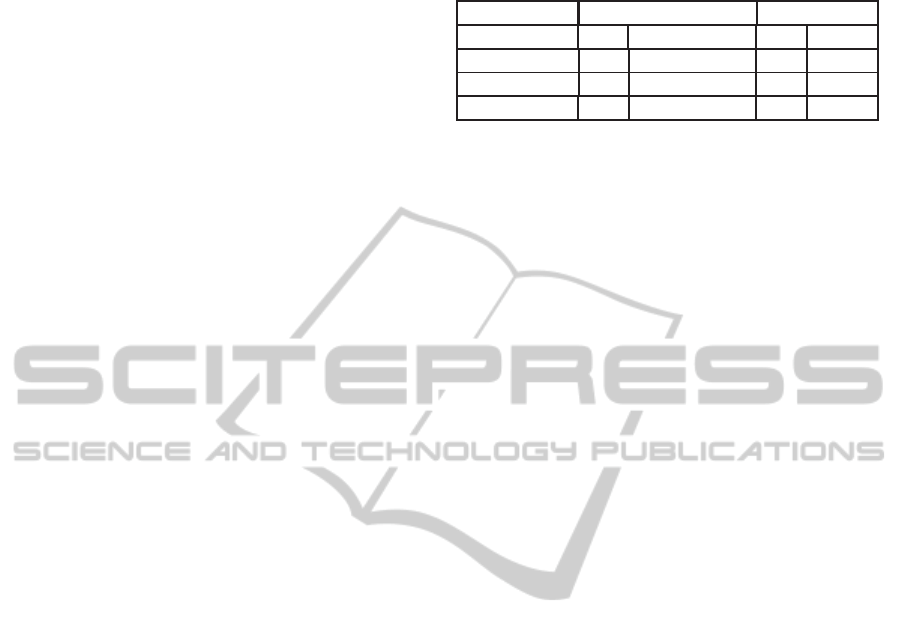
Table 1: Performance of RT and ALL feature sets using
Bagging with ADTree with AN annotation.
Apnea-ECG database UCD database
RT All RT All
Sensitivity(%) 96.08 96.95 33.63 43.07
Specificity(%) 93.85 93.53 96.12 94.39
Accuracy(%) 94.88 95.11 89.92 89.30
3.1 Comparison between Two
Databases
To begin with, we take a look at the performancecom-
parison between the two feature sets, RT and ALL,
using the Bagging with ADTree algorithm recom-
mended by Burgos et al. (2010). The annotation cri-
terion of Apnea-ECG database, i.e. AN, is applied to
UCD database as well. Table 1 lists the results indi-
cating that the ALL set achieves a slightly better per-
formance than the RT set in Apnea-ECG database.
On the other hand, for the UCD database, the sen-
sitivity of the ALL set increases about 10% over that
of the RT set, but a sensitivity of 43.07% is still not
acceptable for practical detection purpose.
3.2 Comparison between Two
Annotation Criteria
The second experimentis conducted using the two an-
notation criteria: AN and AH5C on UCD database.
The classification results of 15 classifiers are recorded
in Table 2 and 3, respectively. Comparing the two ta-
bles, it is observed that the AH5C gains an obvious
advantage in sensitivity over the AN for both feature
sets among all classifiers. In contrast to AN, the AH5C
annotation scheme is not only more physiologically
justifiable, but also more sensitive to those SpO
2
fea-
tures. Therefore, we choose this annotation criterion
for UCD database in the following.
3.3 Comparison between Two Feature
Sets ALL and RT
The results in Table 3 show that, for each classifier,
using the ALL feature set returns a higher sensitivity
than the RT feature set.
To further enhance the detection sensitivity, cost
matrixes can be used to suppress the false negative er-
rors. Two cost matrixes, which penalize the false neg-
atives twice (Cost Sensitive (2)) and five times (Cost
Sensitive (5)) as the false positives respectively, are
adopted in cost-sensitive classification experiments.
The gray area and white area of Table 4 present the
AN IMPROVED APPROACH FOR REAL-TIME DETECTION OF SLEEP APNEA
171
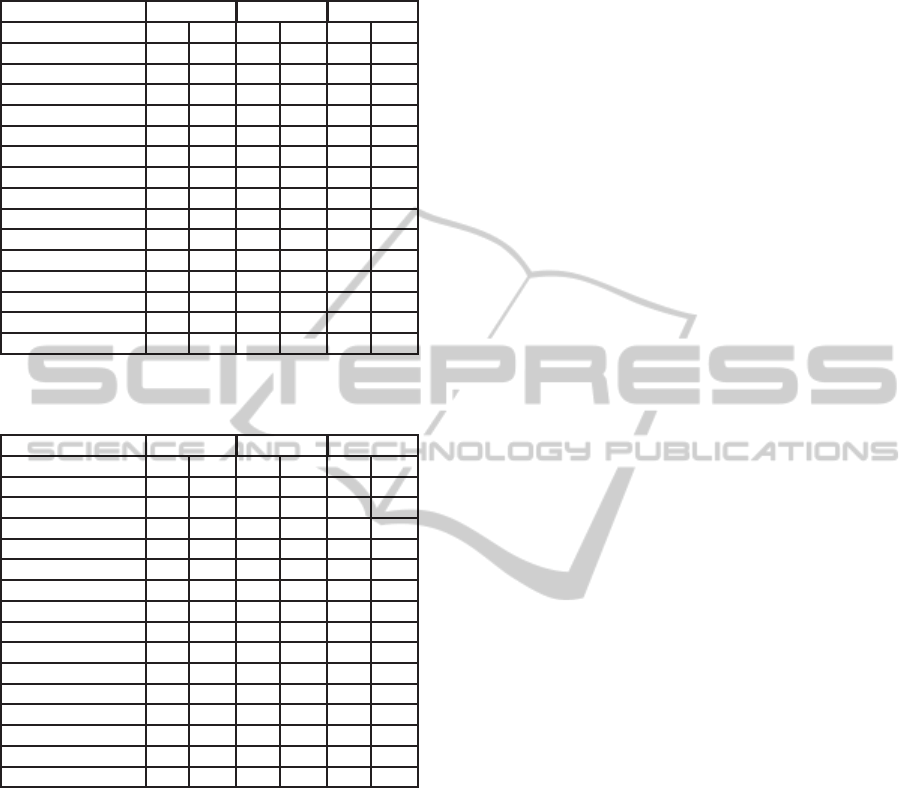
Table 2: Performance of RT and ALL feature sets using
different classifiers with AN annotation for UCD database.
Sensitivity Specificity Accuracy
Classifier RT ALL RT ALL RT ALL
SVM 0.00 0.16 1.00 0.98 0.90 0.90
RandomTree 0.21 0.31 0.96 0.92 0.89 0.86
J48 trees 0.17 0.22 0.98 0.97 0.90 0.89
NaiveBayes 0.32 0.63 0.96 0.87 0.89 0.85
Bagging.REPTree 0.18 0.22 0.98 0.98 0.90 0.90
Bagging.ADTree 0.18 0.07 0.98 0.99 0.90 0.90
MLP 0.23 0.27 0.98 0.97 0.90 0.90
FT trees 0.17 0.26 0.98 0.96 0.90 0.89
RandomForest 0.19 0.18 0.97 0.98 0.89 0.90
RBFNetwork 0.12 0.03 0.99 1.00 0.90 0.90
Decorate trees.J48 0.17 0.24 0.98 0.95 0.90 0.88
ADTree 0.24 0.10 0.97 0.99 0.90 0.90
REPTree 0.15 0.18 0.98 0.98 0.90 0.90
DecisionStump 0.00 0.00 1.00 1.00 0.90 0.90
SimpleCart 0.20 0.26 0.97 0.96 0.89 0.89
Table 3: Performance of RT and ALL feature sets using dif-
ferent classifiers with AH5C annotation for UCD database.
Sensitivity Specificity Accuracy
Classifier RT ALL RT ALL RT ALL
SVM 0.16 0.56 0.99 0.92 0.78 0.83
RandomTree 0.43 0.58 0.94 0.85 0.81 0.78
J48 trees 0.49 0.57 0.94 0.92 0.82 0.83
NaiveBayes 0.42 0.66 0.95 0.90 0.81 0.84
Bagging.REPTree 0.50 0.62 0.94 0.92 0.83 0.84
Bagging.ADTree 0.53 0.59 0.92 0.93 0.82 0.84
MLP 0.49 0.61 0.94 0.92 0.82 0.84
FT trees 0.47 0.57 0.94 0.90 0.82 0.82
RandomForest 0.46 0.55 0.94 0.92 0.81 0.83
RBFNetwork 0.45 0.53 0.93 0.94 0.81 0.83
Decorate trees.J48 0.48 0.57 0.94 0.89 0.82 0.81
ADTree 0.52 0.57 0.93 0.93 0.82 0.84
REPTree 0.49 0.60 0.94 0.91 0.82 0.83
DecisionStump 0.58 0.81 0.87 0.79 0.80 0.80
SimpleCart 0.50 0.58 0.93 0.89 0.82 0.81
experiment results of Cost Sensitive (2) and Cost Sen-
sitive (5), respectively, while the results in Table 3
correspond to the even cost. It is verified that sen-
sitivity improves as the penalties of the false nega-
tives are added. However, the specificity is compro-
mised as sensitivity goes higher. A trade-off exists
between them. The overall accuracy also depends on
the proportion of the apnea/hypopnea minutes in one
recording. Say, if a severe SAHS patient with a great
proportion of apnea/hypopnea event undergoes in the
test, the high sensitivity schemes lead to a high ac-
curacy, and vice versa. Using the ALL feature set,
among the 15 classifiers, the Decision Stump and the
RBFNetwork seem to be the best candidates which
have balanced sensitivity and accuracy around 80%
under Cost Sensitive (2). In the case of Cost Sensi-
tive (5), the SVM, J48 tree, Bagging with REPTree,
Bagging with ADTree, MLP, RBFNetwork, ADTree,
Decision Stump all obtain sensitivity higher than 83%
and accuracy higher than 75%.
3.4 Feature Selection
Previous experiments demonstrate the advantages of
the ALL set over the RT set in sensitivity; never-
theless, the ALL set incorporates the features in the
RT set, potentiating a more complicated and time-
consuming classification process, which may under-
mine the superiority of real-time monitoring. To im-
prove the computational efficiency, we evaluate the
Information Gain of each feature and the top three are
selected to form a 3-feature set (S3), which consists
of Delta index, ODI3, and CTM50. The performance
of S3 set will be assessed and compared below.
3.5 Comparison between the Reduced
Feature Set S3 and RT
To offer a more well-rounded assessment of the two
feature sets as well as different algorithms, the CPU
time (in seconds) spent for training and testing during
the 10-fold cross validations are also included. Note
that even with a smaller feature number, 3, the S3 set
obtains a higher sensitivity and a comparable or better
overall accuracy than the RT set of 8 features, as can
be seen in Table 5. In terms of computational com-
plexity, for most of the classifiers, using the S3 feature
set reduces the CPU time sometimes more than one
half of that using the RT set. However, the SVM clas-
sifier appears to be an exception. The reason of this
exception might be explained as below. The compu-
tational complexity of SVM depends on the number
of the support vectors (N
sv
). For some specific algo-
rithms, such as Bunch-Kaufman training algorithm,
the complexity ranges from O(N
3
sv
+ LN
2
sv
+ dLN
sv
) to
O(dL
2
) (Burges, 1998), where d is the number of di-
mensions, L is number of training sequences. In this
case, the S3 set may generate more support vectors
than the RT set does, resulting in the increase of the
complexity, but also provides a higher sensitivity and
better accuracy.
Additionally, the performances of the RT and S3
feature set based on the Apnea-ECG database are also
investigated. As shown in Table 6, the S3 set achieves
the same, if not better classification result than the RT
set, even if the AN annotation is used in this database.
Note that the superiority of the S3 in computational
efficiency is also well established here. This result
lends evidence to the applicability and high diagnostic
ability of the S3 feature set.
BIOSIGNALS 2011 - International Conference on Bio-inspired Systems and Signal Processing
172
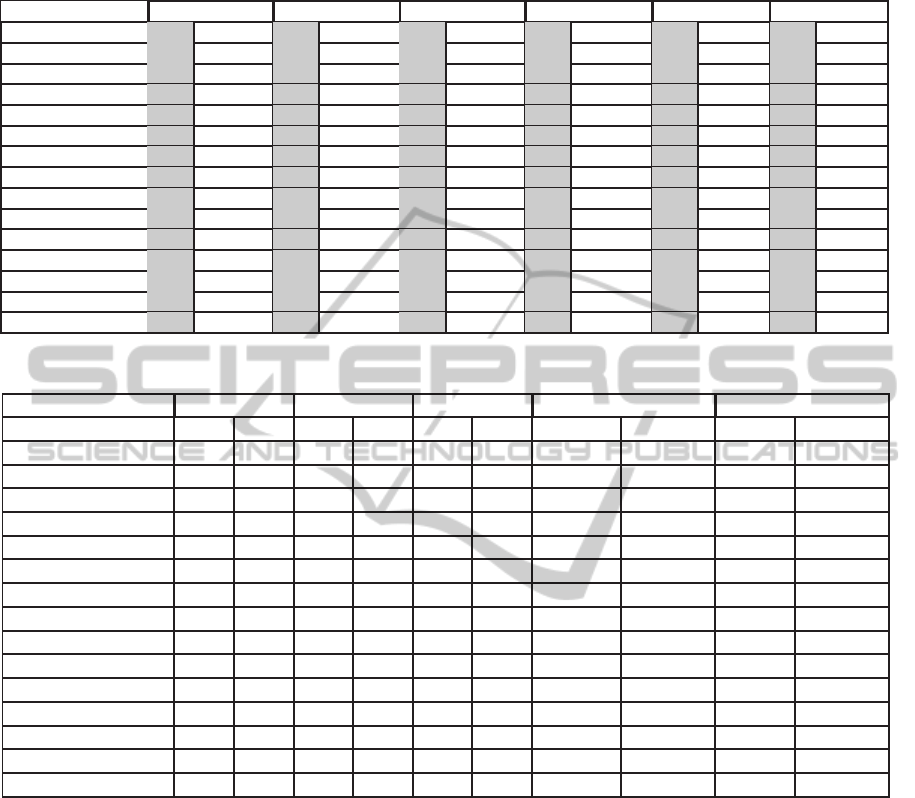
Table 4: Performance of RT and ALL feature sets using cost sensitive different classifiers with AH5C annotation for UCD
database; gray area corresponds to Cost Sensitive (2), and white area corresponds to Cost Sensitive (5).
Classifier Sensitivity(RT) Sensitivity(All) Specificity(RT) Specificity(All) Accuracy(RT) Accuracy(All)
SVM 0.52 0.69 0.72 0.87 0.88 0.75 0.85 0.71 0.79 0.73 0.81 0.75
RandomTree 0.55 0.71 0.57 0.56 0.88 0.75 0.85 0.86 0.79 0.74 0.78 0.78
J48 trees 0.61 0.83 0.69 0.83 0.88 0.69 0.85 0.72 0.81 0.72 0.81 0.75
NaiveBayes 0.42 0.43 0.66 0.68 0.95 0.95 0.90 0.89 0.81 0.81 0.84 0.84
Bagging.REPTree 0.64 0.81 0.73 0.84 0.86 0.70 0.86 0.76 0.80 0.73 0.82 0.78
Bagging.ADTree 0.60 0.82 0.76 0.88 0.89 0.71 0.84 0.71 0.82 0.73 0.82 0.75
MLP 0.62 0.81 0.74 0.87 0.87 0.68 0.86 0.72 0.80 0.71 0.82 0.76
FT trees 0.63 0.82 0.68 0.80 0.87 0.70 0.84 0.74 0.81 0.73 0.80 0.75
RandomForest 0.59 0.76 0.64 0.72 0.87 0.74 0.89 0.84 0.80 0.74 0.83 0.81
RBFNetwork 0.50 0.68 0.80 0.88 0.91 0.77 0.79 0.71 0.81 0.75 0.79 0.75
Decorate trees.J48 0.61 0.82 0.65 0.69 0.88 0.69 0.85 0.81 0.81 0.72 0.79 0.78
ADTree 0.59 0.82 0.74 0.89 0.90 0.70 0.85 0.70 0.82 0.73 0.82 0.75
REPTree 0.63 0.82 0.73 0.88 0.86 0.69 0.84 0.69 0.80 0.73 0.82 0.74
DecisionStump 0.58 0.58 0.81 0.84 0.87 0.87 0.79 0.75 0.80 0.80 0.80 0.77
SimpleCart 0.63 0.81 0.68 0.79 0.86 0.71 0.82 0.73 0.80 0.73 0.79 0.75
Table 5: Performance of RT and S3 feature sets using different classifiers with AH5C annotation for UCD database.
Sensitivity Specificity Accuracy CPU Time Training CPU Time Testing
Classifier RT S3 RT S3 RT S3 RT S3 RT S3
SVM 0.16 0.59 0.99 0.91 0.78 0.83 4.8295 7.2387 0.4396 0.4066
RandomTree 0.43 0.57 0.94 0.86 0.81 0.79 0.0577 0.0750 0.0005 0.0007
J48 0.49 0.60 0.94 0.92 0.82 0.84 0.0918 0.0489 0.0005 0.0008
NaiveBayes 0.42 0.65 0.95 0.90 0.81 0.84 0.0154 0.0077 0.0049 0.0032
Bagging.REPTree 0.50 0.60 0.94 0.91 0.83 0.84 0.4310 0.3103 0.0013 0.0022
Bagging.ADTree 0.53 0.58 0.92 0.93 0.82 0.84 4.4422 1.7258 0.0076 0.0073
MLP 0.49 0.57 0.94 0.93 0.82 0.84 11.9256 4.5718 0.0022 0.0011
FT trees 0.47 0.59 0.94 0.92 0.82 0.84 1.0506 0.8379 0.1581 0.0404
RandomForest 0.46 0.55 0.94 0.89 0.81 0.80 0.5621 0.6591 0.0033 0.0038
RBFNetwork 0.45 0.57 0.93 0.93 0.81 0.84 0.3250 0.2916 0.0056 0.0041
Decorate trees.J48 0.48 0.61 0.94 0.91 0.82 0.84 3.7413 1.9616 0.0019 0.0009
ADTree 0.52 0.58 0.93 0.93 0.82 0.84 0.4673 0.1850 0.0006 0.0011
REPTree 0.49 0.60 0.94 0.92 0.82 0.84 0.0413 0.0299 0.0002 0.0007
DecisionStump 0.58 0.81 0.87 0.79 0.80 0.80 0.0137 0.0068 0.0008 0.0005
SimpleCart 0.50 0.57 0.93 0.90 0.82 0.82 0.7726 0.9300 0.0013 0.0009
Since we are more interested in the sensitivity and
the overall accuracy, and usually the training time
plays a major role in overall classification time con-
sumption, we omit the specificity and CPU time for
testing in the following tables of the cost-sensitive
results to save space. It is observed that apply-
ing the cost matrix improves the sensitivity without
big change in computational complexity. Evaluating
the sensitivity, accuracy and complexity all together,
within the scope of UCD database, under the Cost
Sensitive (2), the Decision Stump and RBFNetwork
with the S3 set are good options both with 81% sen-
sitivity, 80% accuracy and little CPU time for train-
ing, as can be seen in Table 7. In the Cost Sensitive
(5) case, the Decision Stump, RERTree, J48, ADTree,
RBFNetwork, and Bagging with REPTree are all nice
choices if the S3 set is adopted. According to Table
8, for Apnea-ECG database, maybe due to the size
of the records and statistical properties of the data,
all classifiers work generally well in terms of accu-
racy and sensitivity. We can then choose the classifier
based on the UserCPU time accordingly.
4 CONCLUSIONS
This paper provides improvements to the existing
methods of real-time SpO
2
signal monitoring and
SAHS detection in terms of a more comprehensive
feature set and a more appropriate segment annotation
criterion with a higher classification sensitivity. Fur-
thermore, a feature selection technique is employed
AN IMPROVED APPROACH FOR REAL-TIME DETECTION OF SLEEP APNEA
173
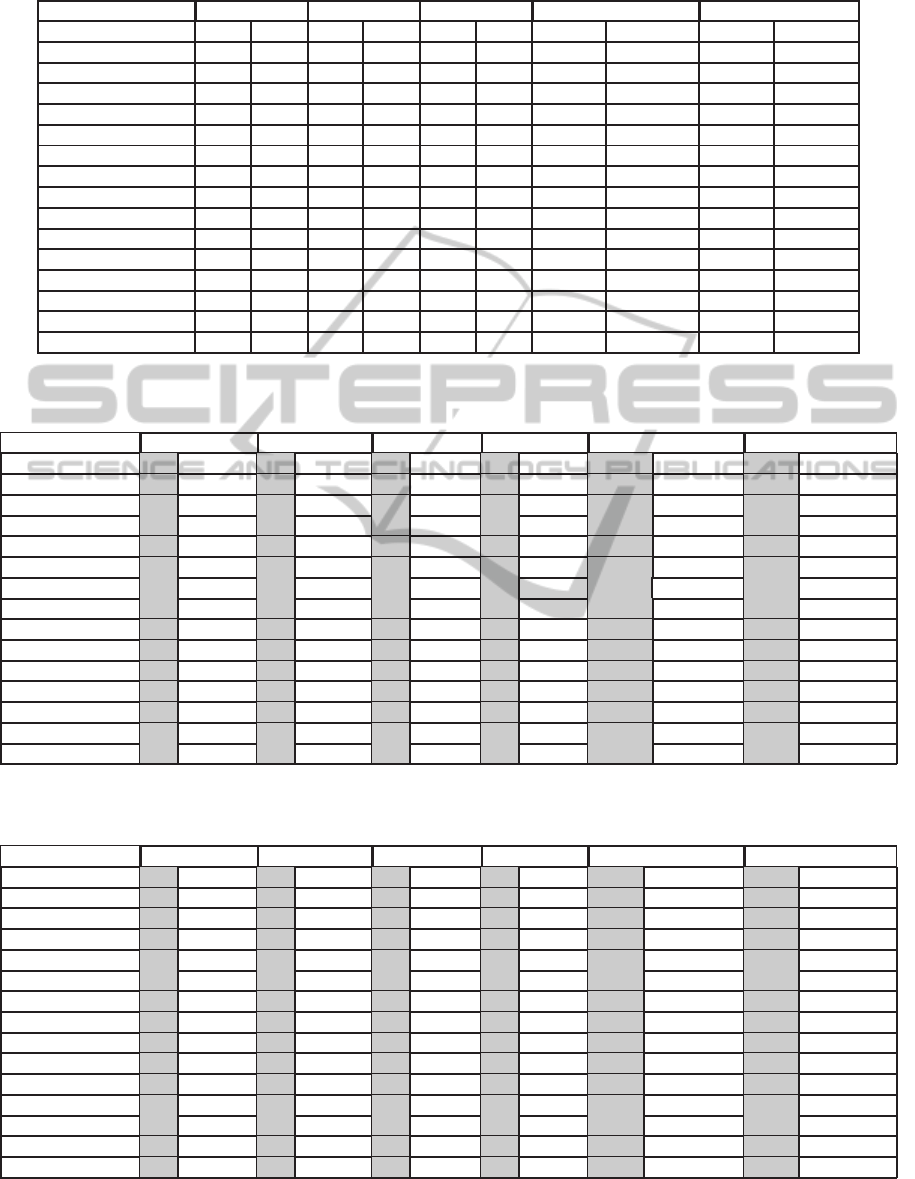
Table 6: Performance of RT and S3 feature sets using different classifiers with AN annotation for Apnea-ECG database.
Sensitivity Specificity Accuracy CPU Time Training CPU Time Testing
Classifier RT S3 RT S3 RT S3 RT S3 RT S3
SVM 0.94 0.94 0.94 0.94 0.94 0.94 0.3670 0.5009 0.0365 0.0345
RandomTree 0.92 0.90 0.94 0.94 0.93 0.92 0.0171 0.0128 0.0002 0.0003
J48 trees 0.95 0.95 0.95 0.94 0.95 0.95 0.0307 0.0111 0.0003 0.0003
NaiveBayes 0.90 0.96 0.93 0.91 0.91 0.94 0.0054 0.0025 0.0015 0.0007
Bagging.REPTree 0.95 0.95 0.95 0.94 0.95 0.94 0.1204 0.0591 0.0002 0.0006
Bagging.ADTree 0.95 0.95 0.95 0.94 0.95 0.94 1.3038 0.5981 0.0035 0.0019
MLP 0.95 0.96 0.95 0.93 0.95 0.94 4.0764 1.5718 0.0005 0.0005
FT trees 0.94 0.94 0.95 0.95 0.95 0.95 0.3584 0.223 0.0346 0.013
RandomForest 0.94 0.92 0.95 0.95 0.95 0.93 0.1486 0.1181 0.0008 0.0008
RBFNetwork 0.93 0.94 0.92 0.93 0.93 0.94 0.1303 0.0981 0.0022 0.0013
Decorate trees.J48 0.92 0.94 0.95 0.94 0.94 0.94 1.2263 0.5012 0.0008 0.0004
ADTree 0.94 0.94 0.94 0.95 0.95 0.94 0.1378 0.0606 0.0002 0.0002
REPTree 0.95 0.95 0.95 0.94 0.95 0.94 0.0126 0.0061 0.0002 0.0003
DecisionStump 0.97 0.94 0.89 0.90 0.93 0.92 0.0055 0.0018 0.0002 0.0003
SimpleCart 0.94 0.94 0.95 0.94 0.95 0.94 0.1989 0.1434 0.0002 0.0002
Table 7: Performance of RT and S3 feature sets using cost sensitive different classifiers with AH5C annotation for UCD
database; gray area corresponds to Cost Sensitive (2), and white area corresponds to Cost Sensitive (5).
Classifier Sensitivity(RT) Sensitivity(S3) Accuracy(RT) Accuracy(S3) CPUT. Training(RT) CPUT. Training(S3)
SVM 0.52 0.69 0.75 0.87 0.79 0.73 0.84 0.76 5.7517 7.0192 9.0884 9.5365
RandomTree 0.55 0.71 0.56 0.56 0.79 0.74 0.78 0.77 0.0575 0.0566 0.0755 0.0759
J48 trees 0.61 0.83 0.72 0.87 0.81 0.72 0.82 0.75 0.0917 0.0842 0.0590 0.0589
NaiveBayes 0.42 0.43 0.69 0.73 0.81 0.81 0.84 0.83 0.0159 0.0156 0.0081 0.0088
Bagging.REPTree 0.64 0.81 0.73 0.84 0.80 0.73 0.82 0.77 0.4396 0.4297 0.3321 0.3107
Bagging.ADTree 0.60 0.82 0.73 0.88 0.82 0.73 0.82 0.75 4.5216 4.4795 1.7380 1.7005
MLP 0.62 0.81 0.73 0.88 0.80 0.71 0.82 0.75 11.9846 11.9186 4.5610 4.5643
FT trees 0.63 0.82 0.72 0.88 0.81 0.73 0.83 0.75 1.0545 1.1292 0.9349 0.9794
RandomForest 0.59 0.76 0.63 0.71 0.80 0.74 0.79 0.77 0.5643 0.5560 0.6817 0.6603
RBFNetwork 0.50 0.68 0.81 0.86 0.81 0.75 0.80 0.77 0.3382 0.3401 0.3080 0.2930
Decorate trees.J48 0.61 0.82 0.72 0.84 0.81 0.72 0.82 0.76 4.3842 4.4547 1.9924 3.1778
ADTree 0.59 0.82 0.72 0.88 0.82 0.73 0.82 0.74 0.4611 0.4672 0.1817 0.1832
REPTree 0.63 0.82 0.73 0.87 0.80 0.73 0.82 0.75 0.0378 0.0370 0.0285 0.0288
DecisionStump 0.58 0.58 0.81 0.84 0.80 0.80 0.80 0.77 0.0128 0.0148 0.0065 0.0078
SimpleCart 0.63 0.81 0.68 0.80 0.80 0.73 0.79 0.74 0.7533 0.6710 1.0750 0.9569
Table 8: Performance of RT and S3 feature sets using cost sensitive different classifiers with AN annotation for Apnea-ECG
database; gray area corresponds to Cost Sensitive (2), and white area corresponds to Cost Sensitive (5).
Classifier Sensitivity(RT) Sensitivity(S3) Accuracy(RT) Accuracy(S3) CPUT. Training(RT) CPUT. Training(S3)
SVM 0.96 0.97 0.95 0.96 0.92 0.93 0.94 92.99 0.3719 0.3266 0.5186 0.4751
RandomTree 0.92 0.92 0.92 0.91 0.93 0.92 0.92 0.92 0.0158 0.0161 0.0128 0.0128
J48 trees 0.96 0.97 0.97 0.98 0.94 0.94 0.94 0.92 0.0273 0.0267 0.0111 0.0118
NaiveBayes 0.90 0.91 0.96 0.97 0.91 0.91 0.93 0.93 0.0057 0.0057 0.0025 0.0026
Bagging.REPTree 0.96 0.98 0.97 0.98 0.95 0.94 0.94 0.93 0.1154 0.1023 0.0591 0.0533
Bagging.ADTree 0.96 0.98 0.97 0.98 0.95 0.92 0.94 0.93 1.3119 1.2822 0.5981 0.6020
MLP 0.96 0.98 0.97 0.98 0.94 0.93 0.94 0.93 4.1073 4.0772 1.5718 1.5707
FT trees 0.96 0.97 0.97 0.98 0.94 0.93 0.94 0.93 0.3500 0.3267 0.2230 0.2086
RandomForest 0.95 0.97 0.95 0.97 0.95 0.94 0.93 0.93 0.1428 0.1257 0.1159 0.1068
RBFNetwork 0.95 0.96 0.96 0.98 0.93 0.92 0.93 0.91 0.1358 0.1394 0.0994 0.1010
Decorate trees.J48 0.95 0.96 0.96 0.97 0.94 0.93 0.93 0.92 1.2735 1.3409 0.5895 0.7642
ADTree 0.96 0.98 0.96 0.98 0.95 0.92 0.94 0.92 0.1378 0.1373 0.0598 0.0603
REPTree 0.96 0.98 0.97 0.98 0.94 0.93 0.94 0.93 0.0121 0.0118 0.0058 0.0059
DecisionStump 0.97 0.98 0.96 0.96 0.93 0.93 0.92 0.91 0.0047 0.0043 0.0018 0.0019
SimpleCart 0.96 0.97 0.97 0.98 0.94 0.93 0.94 0.93 0.1955 0.1723 0.1462 0.1364
BIOSIGNALS 2011 - International Conference on Bio-inspired Systems and Signal Processing
174

to find out a reduced feature set which only com-
prises of 3 indexes, namely, the Delta index, ODI3
and the CTM50. The reduced feature set not only
lowers the computational complexity, but also enjoys
a better diagnostic ability than the existing feature
sets. Moreover, cost sensitive classifications are car-
ried out among 15 popular classifiers based on two
distinct databases, which substantiate the effective-
ness and robustness of the proposed reduced feature
set and provide guidelines of classifier selections with
the associated real-time detection strategies.
REFERENCES
Alvarez, D., Hornero, R., Ab´asolo, D., Campo, F., and Za-
marr´on, C. (2006). Nonlinear characteristics of blood
oxygen saturation from nocturnal oximetry for ob-
structive sleep apnoea detection. Physiological Mea-
surement, 27:399.
Burges, C. (1998). A tutorial on support vector machines
for pattern recognition. Data mining and knowledge
discovery, 2(2):121–167.
Burgos, A., Goni, A., Illarramendi, A., and Bermudez, J.
(2010). Real-time detection of apneas on a PDA. In-
formation Technology in Biomedicine, IEEE Transac-
tions on, 14(4):995–1002.
CinC (2000). CinC Challenge 2000 data
sets: Data for development and eval-
uation of ECG-based apnea detectors.
http://www.physionet.org/physiobank/database/apnea-
ecg/.
Goldberger, A. L., Amaral, L. A. N., Glass, L., Haus-
dorff, J. M., Ivanov, P. C., Mark, R. G., Mietus,
J. E., Moody, G. B., Peng, C.-K., and Stanley, H. E.
(2000). PhysioBank, PhysioToolkit, and PhysioNet:
Components of a new research resource for com-
plex physiologic signals. Circulation, 101(23):e215–
e220. Circulation Electronic Pages: http://
circ.ahajournals.org/cgi/content/full/101/23/e215.
Hall, M., Frank, E., Holmes, G., Pfahringer, B., Reutemann,
P., and Witten, I. (2009). The WEKA data mining
software: An update. ACM SIGKDD Explorations
Newsletter, 11(1):10–18.
Heneghan, C., Chua, C., Garvey, J., De Chazal, P.,
Shouldice, R., Boyle, P., and McNicholas, W. (2008).
A portable automated assessment tool for sleep ap-
nea using a combined Holter-oximeter. Sleep,
31(10):1432.
L´evy, P., P´epin, J., Deschaux-Blanc, C., Paramelle, B., and
Brambilla, C. (1996). Accuracy of oximetry for de-
tection of respiratory disturbances in sleep apnea syn-
drome. Chest, 109(2):395.
Lin, C. L., Yeh, C., Yen, C. W., Hsu, W. H., and Hang, L. W.
(2008). Comparison of the indices of oxyhemoglobin
saturation by pulse oximetry in obstructive sleep ap-
nea hypopnea syndrome. Chest, 135(1):86–93.
Magalang, U., Dmochowski, J., Veeramachaneni, S.,
Draw, A., Mador, M., El-Solh, A., and Grant,
B. (2003). Prediction of the Apnea-Hypopnea
Index From Overnight Pulse Oximetry*. Chest,
124(5):1694.
McNames, J. and Fraser, A. (2000). Obstructive sleep ap-
nea classification based on spectrogram patterns in the
electrocardiogram. Computers in Cardiology, pages
749–752.
Netzer, N., Stoohs, R., Netzer, C., Clark, K., and Strohl,
K. (1999). Using the Berlin Questionnaire to identify
patients at risk for the sleep apnea syndrome. Annals
of Internal Medicine, 131(7):485.
Ng, A., Koh, T., Baey, E., and Puvanendran, K. (2006).
Speech-like Analysis of Snore Signals for the Detec-
tion of Obstructive Sleep Apnea. In International
Conference on Biomedical and Pharmaceutical Engi-
neering, 2006. ICBPE 2006, pages 99–103. IEEE.
Oliver, N. and Flores-Mangas, F. (2006). HealthGear: a
real-time wearable system for monitoring and analyz-
ing physiological signals. Technical report, MSR-TR-
2005-182, Microsoft Corporation.
Olson, L., Ambrogetti, A., and Gyulay, S. (1999). Pre-
diction of sleep-disordered breathing by unattended
overnight oximetry. Journal of sleep research,
8(1):51–55.
Shinar, Z., Baharav, A., and Akselrod, S. (2000). Obstruc-
tive sleep apnea detection based on electrocardiogram
analysis. In Computers in Cardiology 2000, pages
757–760. IEEE.
UCD (2000). St. Vincent’s University Hospital /
University College Dublin Sleep Apnea Database.
http://www.physionet.org/pn3/ucddb/.
Young, T., Palta, M., Dempsey, J., Skatrud, J., Weber,
S., and Badr, S. (1993). The occurrence of sleep-
disordered breathing among middle-aged adults. New
England Journal of Medicine, 328(17):1230.
Zamarr´on, C., Gude, F., Barcala, J., Rodriguez, J., and
Romero, P. (2003). Utility of Oxygen Saturation and
Heart Rate Spectral Analysis Obtained From Pulse
Oximetric Recordings in the Diagnosis of Sleep Ap-
nea Syndrome*. Chest, 123(5):1567.
AN IMPROVED APPROACH FOR REAL-TIME DETECTION OF SLEEP APNEA
175
