
NEURAL-FUZZY MODELLING OF LUNG VOLUME
USING ABSOLUTE ELECTRICAL IMPEDANCE
TOMOGRAPHY
Suzani Mohamad Samuri, George Panoutsos
Department of Automatic Control and Systems Engineering, University of Sheffield, Mappin Street, Sheffield, S1 3JD, U.K.
Mahdi Mahfouf, G. H. Mills, M. Denaï, B. H. Brown
Department of Automatic Control and Systems Engineering, University of Sheffield, Mappin Street, Sheffield, S1 3JD, U.K.
Dept. of Critical Care and Anaesthesia, Northern General Hospital, Sheffield, U.K.
School of Science and Eng., Teesside University, Middlesbrough, U.K.
Dept. of Medical Physics, Royal Hallamshire Hospital, Sheffield, U.K.
Keywords: Electrical Impedance Tomography (EIT), ANFIS, Data-driven modelling, Lung imaging,
Non-invasive monitoring.
Abstract: Electrical Impedance Tomography (EIT) has been the subject of intensive research since its development in
the early 1980s by Barber and Brown at the Department of Medical Physics and Clinical Engineering,
Hallamshire Hospital in Sheffield (UK). In particular, pulmonary measurement has been the focus of most
EIT related research. One of the relatively recent advances in EIT is the development of an absolute EIT
system (aEIT) which can estimate absolute values of lung resistivity and lung volumes. However, there is
still active research in the area of validating and improving the accuracy and consistency of the aEIT
estimation of lung volumes towards characterising the system as suitable for clinical use. In this paper we
present a new approach based on Computational Intelligence (CI) modelling to model the ‘Resistivity -
Lung Volume’ relationship that will allow more accurate lung volume predictions. Eight (8) healthy
volunteers were measured simultaneously by the Sheffield aEIT system and a Spirometer and the recorded
results were used to develop subject-specific Neural-Fuzzy models able to predict absolute values of lung
volume based only on absolute lung resistivity data. The developed models show improved accuracy in the
prediction of lung volumes, as compared with the original Sheffield aEIT system. However the inter-
individual differences observed in the subject-specific modelling behaviour of the ‘Resistivity-Lung
Volume’ curves suggest that a model extension is needed, whereby the modelling structure auto-calibrates
to account for subject (or patient-specific) inter-parameter variability.
1 INTRODUCTION
Electrical Impedance Tomography (EIT) has been a
topic of interest for researchers including clinicians
due to its ability to offer a non-invasive, radiation-
free monitoring. EIT aims to generate cross-
sectional images of the studied subjects based on
measurement of surface electrical potentials
resulting from an excitation with small alternating
currents via an array of equally-spaced electrodes
attached to the surface of the thorax at about 4-5 cm
above the xyphoid process (Barber, 1984 and
Brown, 2003).
EIT has been used to generate images of various
parts of the human body, nonetheless, the lung
ventilation measurements have always been
regarded as one of the areas which seem to have
possible benefits from the development of EIT. In
1985 Brown et al suggested the use of EIT in lung
imaging and ventilation monitoring in what was the
first summary of possible clinical applications for
this technique (Brown, 1985). For most of the recent
EIT studies, the focus has been on the changes in
impedance with time (relative/functional EIT),
instead of the absolute values. The new absolute
impedance tomography takes this a step further, by
43
Mohamad Samuri S., Panoutsos G., Mahfouf M., H. Mills G., Denaï M. and H. Brown B..
NEURAL-FUZZY MODELLING OF LUNG VOLUME USING ABSOLUTE ELECTRICAL IMPEDANCE TOMOGRAPHY.
DOI: 10.5220/0003136500430050
In Proceedings of the International Conference on Bio-inspired Systems and Signal Processing (BIOSIGNALS-2011), pages 43-50
ISBN: 978-989-8425-35-5
Copyright
c
2011 SCITEPRESS (Science and Technology Publications, Lda.)

not only looking at the changes in impedance during
the respiratory cycles, but also producing absolute
(as opposed to relative) values of impedance that can
be compared to normal or reference values. Indeed,
a multi-frequency system was developed in the mid
1990’s to calculate the absolute impedance (Brown,
1995) and subsequently calculate an absolute
volume measurement of the lung. The method of
determination of lung absolute resistivity (Brown,
2002) is based on a 3D finite difference model of the
thorax developed from CT cross sections of a
normal subject (G. Zubal, 1994) and scaled to take
into account the geometry of the chest
(circumference and ellipse ratio) of a particular
subject. The elements in the model were assigned
fixed resistivity values in the range 1-80 Ω-m
depending on their anatomical location (fat, muscle,
bone, blood or lung) in the CT images. The modeled
data are then compared with the real measurements
over a pre-determined region of interest for values of
the lung resitivities between 3 and 80 Ω-m. The
value of lung resistivity, which minimizes the mean
difference between these data sets, is returned as the
value of the absolute lung resistivity, an EIT image
is reconstructed by filtered back projection (Barber,
1987). As lung resistivity is a function of the
frequency of the applied current, at high frequency,
when the capacitive reactance of the cell membranes
are reduced virtually to zero, the lungs consist of just
two equivalent electrical components; air with
almost infinite resistivity and lung tissue with an
almost homogeneous resistivity determined by that
of the intracellular and extra-cellular fluids (Barber,
2005). If these resistivities are known, then it
becomes possible to calculate both lung density and
air volume using a Cole equation (Brown and Mills,
2006). The complexity of aEIT in the absolute lung
air volume has more or less contributes to some
problems in getting a consistent and accurate
measurement from the system.
A significant amount of research has so far been
devoted to investigating the feasibility of EIT to
assess the level of lung ventilation in comparison
with the volume of air measured with spirometer.
Harris et al. (1987) showed the proportional
relationship between the lung volume change and
lung resistivity using EIT imaging and confirmed the
system’s ability to assess the level of lung
ventilation. Their work identified a close correlation
between an impedance index computed from
dynamic resistivity images and volume of inspired
air measured by a spirometer. In 1988 research
confirmed a high correlation (r > 0.95) between the
change in lung impedance and volume of air
inspired in four healthy subjects while at rest and on
a bicycle ergo-meter (Harris, 1988). The study
demonstrated that real-time EIT ventilation
measurements of lung volume were possible to an
accuracy of +/- 10% of the spirometer values. The
posture of the subject was again an area of interest,
with data recorded in five subjects in both seated and
supine positions, showing an impedance variation of
between -3.8% and +9.5% from the former to later
posture. Nicolas et al. (2005) elicited a parametric
model of the relationship between EIT and total lung
volume with the aim at facilitating inter individual
comparisons of EIT images by providing volumetric
scale in place of the usual arbitrary units scale. The
lung volume changes predicted by the model were
compared to the volume changes measured by
spirometry. The model was able to predict the lung
volume changes with 9.3% to 12.4% accuracy.
These studies confirmedthe fact that there exists
significant correlation between the variable derived
by EIT and lung volume changes measured with
spirometer and it is possible to model associated
relationship.
In this paper, the relationship between absolute
resistivity from the aEIT system and the lung
volume measured from spirometry were studied
based on the data from 8 healthy volunteers. Two
data-driven models were developed; the first model
(AEIT) was built for the relationship between data
from aEIT to mimic the behaviour of the system in
producing the absolute lung air volume from
absolute resistivity, while the second model
(EITSPIRO) was developed for the relationship
between spirometry lung air volume and absolute
resistivity. An Adaptive Neural-Fuzzy Inference
System (ANFIS) network design (Jang, 1993) is
used in this modelling exercise. Finally, a new
hybrid model structure is proposed for selecting the
best model to predict the absolute lung air volume to
be used in the aEIT system.
2 STUDY PROTOCOL
2.1 Subjects
A total of eight (8) healthy subjects (males)
participated in this study. The subjects’ height,
weight, circumference and ellipse ratio were
measured and recorded. The studied subjects’
information is shown in Table 1.
BIOSIGNALS 2011 - International Conference on Bio-inspired Systems and Signal Processing
44
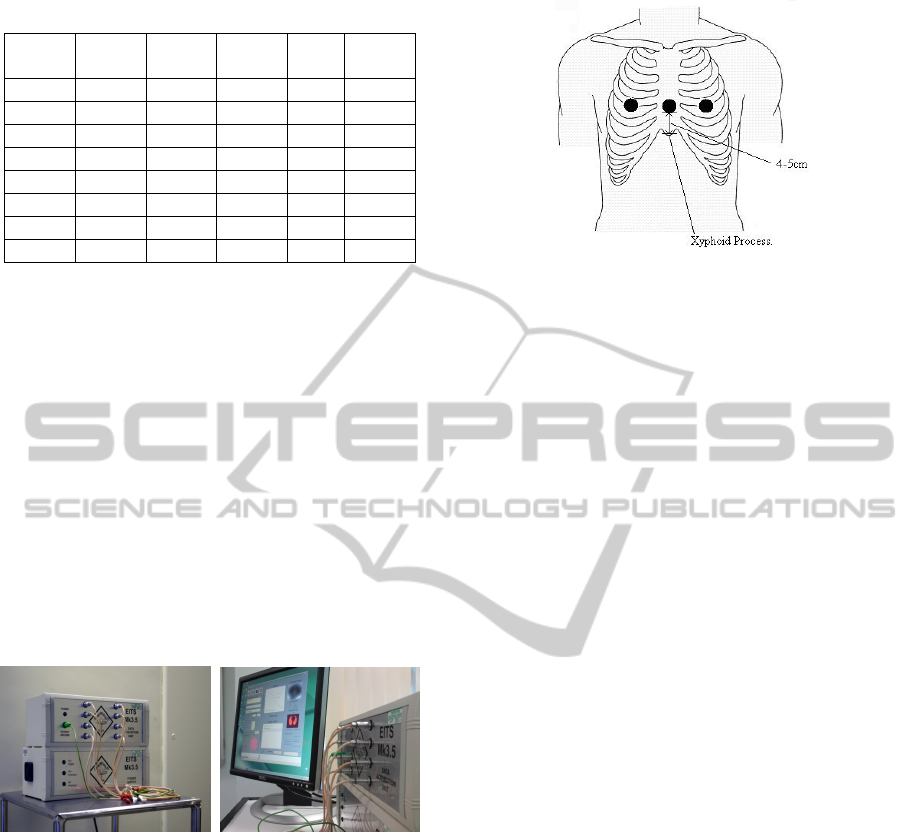
Table 1: The anthropometric information of the subjects.
Subject Gender
Height
(cm)
Weight
Circum
(cm)
Ellipse
ratio
1 M
170 80 95 1.51
2 M
170 67 88 1.38
3 M
171 60 83 1.58
4 M
186 113 109 1.39
5 M
184 93 104 1.53
6 M
191 79 95 1.53
7 M
168 66 90.5 1.36
8 M
171 62.5 88 1.45
2.2 Equipments and Tools
A disposable tape measure was used to measure the
subjects’ chest circumference. “Mitutoyo Absolute
Digmatic” callipers were used to measure the
subjects’ chest; measurements were taken of chest
width and depth in order to calculate an ellipse ratio.
The aEIT data were acquired via the Sheffield
Mk 3.5 absolute EIT system. The Mk3.5 aEIT
(Figure 1) uses eight AgCl ECG type electrodes to
inject small alternating currents at 30 frequencies
typically within the range 2 kHz to 1.6 MHz and
records the resulting potentials at a rate of 25
frames.s
-1
. The computer user interface to control the
Mk3.5 system is written in MATLAB, and is able to
display real-time images.
Figure 1: The Sheffield EIT Mk 3.5.
2.3 Data Acquisition
2.3.1 Spirometry and EIT Measurements
Eight (8) skin electrodes were attached around the
circumference of the chest, and connected to the EIT
data acquisition unit. Ideally the electrodes were
attached in a horizontal plane 5cm above the xiphoid
process, and equally spaced around the
circumference (Figure 2).
Figure 2: The level of the EIT electrode array in the
frontal plane.
The subjects were simultaneously breathing
through the spirometer tube (SensorMedics) while
attached to the Mk 3.5 aEIT system. The data were
measured using adjacent drive and receive
combinations of electrodes, connected to the data
acquisition unit. A 60 sec recording of data were
performed involving quiet breathing and maximum
inspiration and expiration manoeuvres in sitting
position. The acquired EIT data were then resampled
using MATLAB according to the spirometry
sampled data. The spirometry sampled data
represent the instantaneous changes in lung volume
(relative to residual volume).
3 DATA-DRIVEN MODELLING
USING ANFIS
Neural-Fuzzy modelling falls under the umbrella of
Computational Intelligence (CI) modelling and can
be used as a non-linear method for mapping a certain
number of inputs to a certain number of outputs.
This non-linear mapping can be learned from
process data using various algorithms. The
architecture used in this study is the Adaptive
Neural-Fuzzy Inference System (ANFIS) consisting
of a set of TSK-type fuzzy IF-THEN rules. The
TSK-type fuzzy model was proposed by Takagi,
Sugeno and Kang (Sugeno and Kang, 1988, Takagi
and Sugeno, 1985) in an effort to develop a
systematic approach to generate fuzzy rules from a
given input-output data set. A typical fuzzy rule in
Sugeno fuzzy model has the form:
IF is A and is B THEN z = (, )
Where A and B are fuzzy sets in the antecedent,
while z =
(, ) is a crisp function in the
consequent. The ANFIS architecture is used as the
facet of the modelling structure in order to map the
NEURAL-FUZZY MODELLING OF LUNG VOLUME USING ABSOLUTE ELECTRICAL IMPEDANCE
TOMOGRAPHY
45
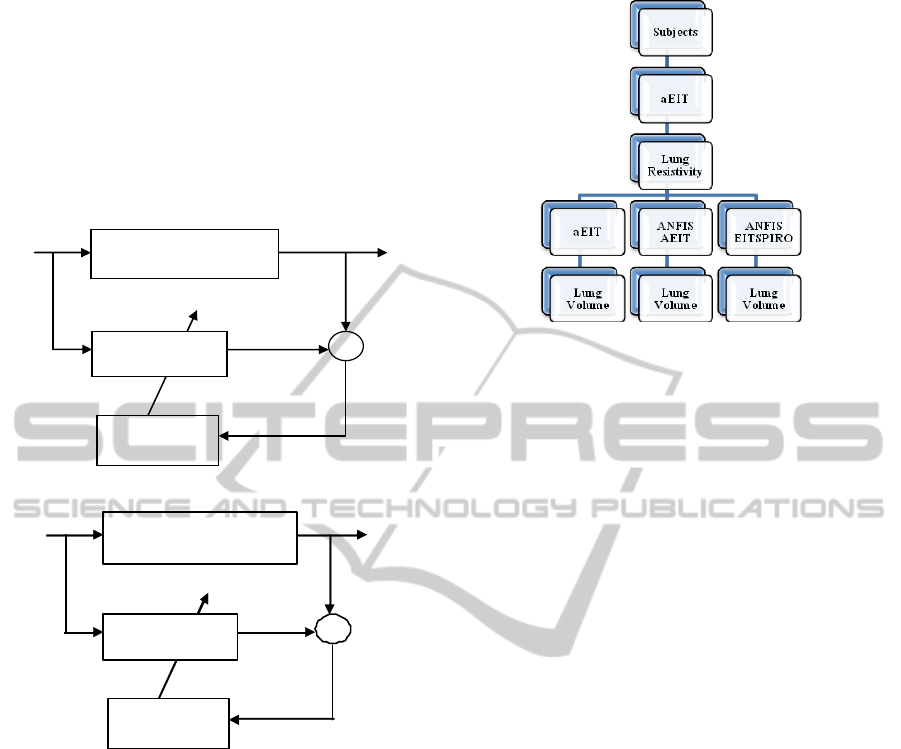
aEIT data. In the first part of the ‘Results’ section
(4.1) only the aEIT data recordings are used to
develop a data-driven model of the ‘Lung Resistivity
– Lung Volume’ (Lung R-V) relationship. This
model will map the non-linear relationship ‘Lung R-
V’ by ‘imitating’ the aEIT system’s physical
equations (Brown, 2002). This modelling structure is
shown in Figure 3a.
(a)
(b)
Figure 3: (a) Model structure for AEIT model. (b) Model
structure for EITSPIRO model. EIT absR =EIT absolute
resistivity. LV Spiro= spirometry lung volume, EIT
absLV= EIT absolute lung volume and
)(t
ε
= error
between actual and predicted lung volume.
In the second part of the ‘Results’ Section (4.2)
the Spirometry recordings are used along the aEIT
data in an effort to ‘bypass’ the aEIT system’s lung
estimations using physical equations, hence
attempting to predict directly lung volumes using the
Spirometry data for a reference. The Spirometry data
(relative lung volume) were converted to absolute
lung volume data by estimating the Residual
Volume (RV) of all eight volunteers using Body
Plethysmography in the Royal Hallamshire Hospital,
Sheffield U.K. Figure 4 shows an overview of the
various modelling structures.
Figure 4: An overview of the various modelling structures.
4 RESULTS AND DISCUSSIONS
4.1 AEIT Models
Training and Testing Results
The first type of model built in this study is the
AEIT model which is based on data of absolute EIT
resistivity and absolute lung air volume (as
measured by the aEIT system) obtained from 8
healthy subjects in a sitting position. The aEIT
mk3.5 system uses a number of non-linear equations
to infer absolute lung volumes from resistivity data.
Example of such equations include the Cole-Cole
equation (to link a frequency spectrum to resistivity
data), the Nopp model (to link lung tissue resistivity
as a function of lung volume) (Brown and Mills,
2006), and a number of population mean models of
lung weight based on gender. Most of these
equations are empirical/theoretical and introduce
uncertainties and inaccuracies in the final
estimations of lung volumes. The objective of first
modelling exercise is to mimic the behaviour of the
physical/theoretical/empirical equation based on
data from these 8 healthy subjects. The 8 subject-
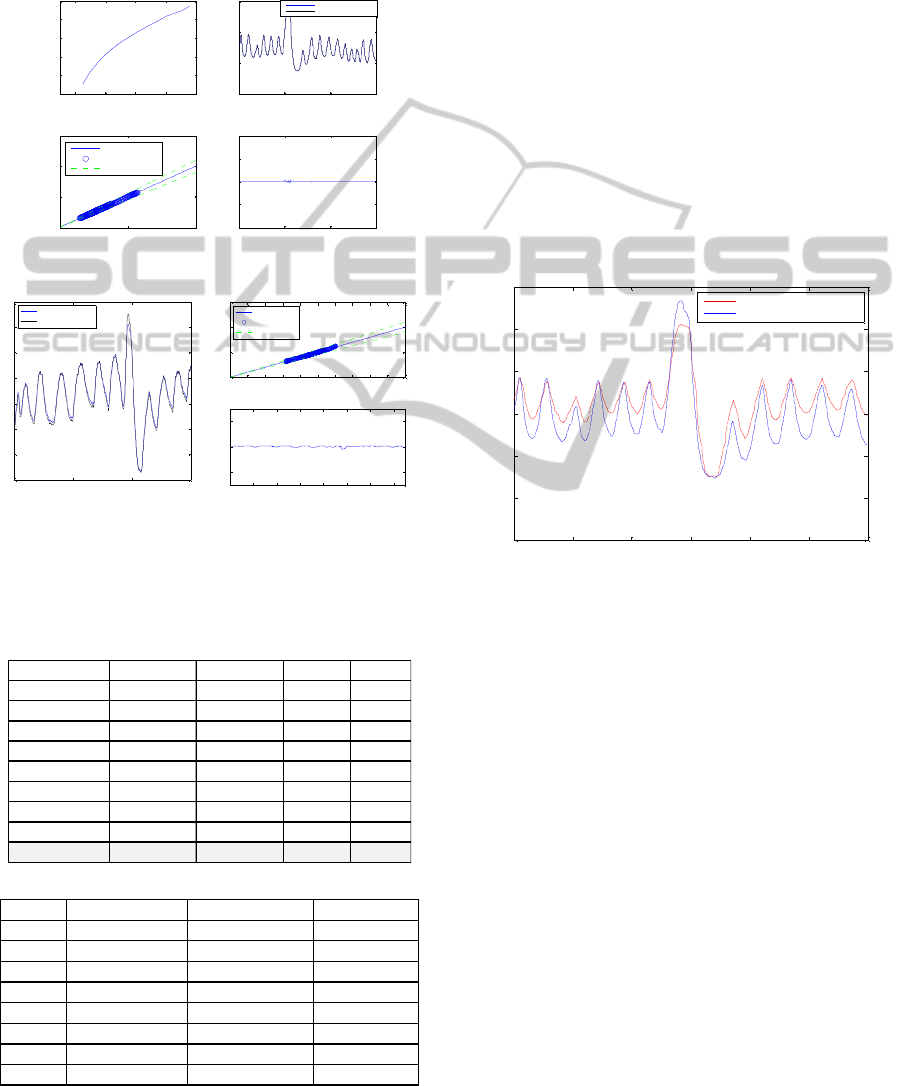
specific AEIT models results are shown in Figure 5.
Table 2 shows the modelling performance results.
Root mean square error (rmse), mean absolute error
(mae%), correlation coefficient (cor.) and standard
deviation of the error (eSD) were used as the
performance indices. As shown in Figure 5, the
AEIT model can predict the absolute lung air
volume with a good accuracy in training (99.8%)
and testing (95%). The current modelling results
show that ANFIS is a good modelling method to
learn the relationship between the absolute
resistivity and absolute lung air volume as currently
LEARNING
ALGORITHM
Predicted
EIT abs LV
)(t
ε
EIT absR
SUBJECTS WITH EIT
SYSTEM
ANFIS MODEL
EIT abs LV
+
-
∑
Predicted
LV Spiro
)(t
ε
EIT a
b
s
R
SUBJE
C
TS WITH EIT
SYSTEM AND SPIROMETER
ANFI S MODEL
LEARNING
ALGORITHM
LV Spiro
+
∑
BIOSIGNALS 2011 - International Conference on Bio-inspired Systems and Signal Processing
46
described in the aEIT system. However, such a
model would inherit all the inaccuracies of the aEIT
system in the estimation of lung volumes, as shown
in (Panoutsos, 2008 and Tunney, 2008) and detailed
in the following paragraph.
(a)
(b)
Figure 5: (a) The AEIT model training results (b) The
AEIT model testing results.
Table 2: (a) The models training fit results. (b) The models
testing fit results.
(a)
(b)
Even though that the AEIT models show good
performance, in reality the models also inherit the
errors of the aEIT system when we compare the lung
volumes with real Spirometry data. Figure 6 shows
an example of the absolute EIT lung air volume as
compared to the real lung air volume as measured by
Spirometry. As it can be seen in Figure 6, there is a
clear difference between the aEIT estimated lung
volume and the real lung volume measured using
Spirometry (20.7% average error for all eight
subjects) Hence it can be concluded that the ANFIS
model is capable of mapping such non-linear
behaviour very accurately, but some inherited
modelling errors (included in the aEIT equations) do
not allow for a very accurate lung volume
modelling. It is possible to ‘bypass’ the aEIT
equations and attempt to model the lung volume
directly from volumetric measurement data using
Spirometry as described in the next section.
Figure 6: The plot of actual absolute EIT lung volume and
actual spirometry lung air volume.
4.2 EITSPIRO Models
Training and Testing Results
The second type of model built in this study is the
EITSPIRO model which is based on data of absolute
EIT resistivity and Spirometry lung air volume
obtained from 8 healthy subjects in sitting position.
The models are designed to predict the spirometry
lung air volume directly from the absolute EIT
resistivity as obtained from the EIT Mk 3.5 system.
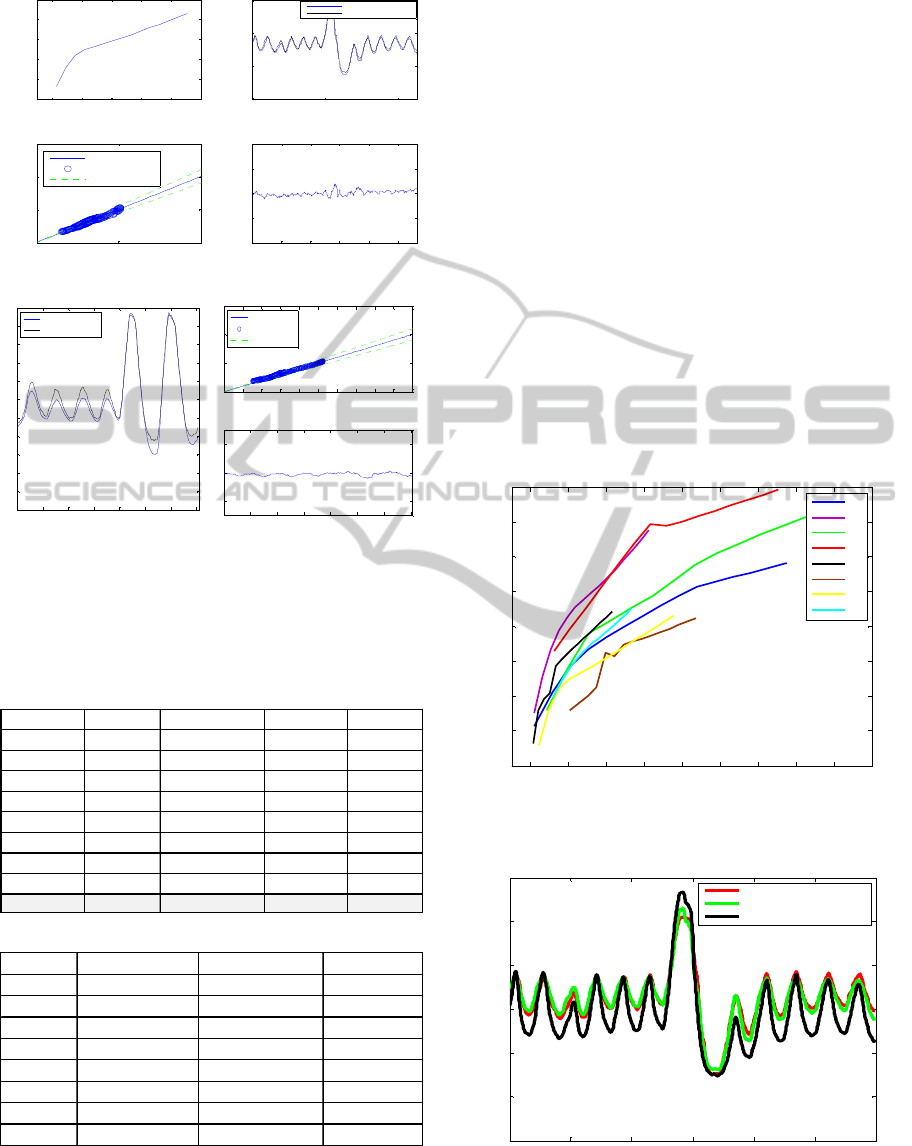
The 8 subject-specific EITSPIRO models results
summarised in Table 3 and a representative example
of one subject is shown in Figure 7. Root mean
square error (rmse), mean absolute error (mae%),
correlation coefficient (cor.) and standard deviation
of the error (eSD) were used as the performance
indices.
2 4 6 8 10
1
2
3
4
5
6
EIT absR
EIT abs lung air volume
0 500 1000 1500
0
2
4
6
Model training results
Ac tual output
ANFIS predic ted output
0 5 10
0
5
10
15
real
prediction
training results
0% Error Line
Model Predict ions
+/- 10% Error Line
500 1000 1500
-2
-1
0
1
2
MAE= 0.004631
training error
0 500 1000 1500
3
3.5
4
4.5
5
5.5
6
6.5
Model testing results
Ac tual output
ANFIS predicted output
0 1 2 3 4 5 6 7 8 9 10
0
5
10
15
real
prediction
testing results
0% Error Line
Model Predictions
+/- 10% Error Line
200 400 600 800 1000 1200 1400
-2
0
2
MAE= 0.042526
testing error
rmse mae% eSD Cor
S1 0.0026 0.0635 0.0026 1
S2 0.0081 0.149 0.0081 0.9999
S3 0.0043 0.102 0.0043 1
S4 0.0206 0.2779 0.0206 0.9999
S5 0.0152 0.4739 0.0152 0.9998
S6 0.0343 0.5429 0.0343 0.9993
S7 0.0054 0.2561 0.0054 1
S8 0.0039 0.068 0.0039 1
mean ± SD 0.012 ± 0.0 0.242 ± 0.2 0.012 ± 0.0 1.000 ± 0.0
rmse (mean ± SD) mae%(mean ± SD) cor(mean ± SD)
S1 0.487 ± 0.32 0.27 ± 0.13 0.889 ± 0.13
S2
0.244 ± 0.27
0.192 ± 0.19 0.966 ± 0.07
S3 0.159 ± 0.16 0.159 ± 0.16 1 ± 0.00
S4 0.319 ± 0.24 0.29 ± 0.24 0.990 ± 0.01
S5 0.279 ± 0.4 11.27 ± 8.1 0.996 ± 0.0
S6 0.070 ± 0.1 9.478 ± 5.3 0.999 ± 0.0
S7 0.408 ± 0.7 9.539 ± 7.5 0.769 ± 0.4
S8 0.089 ± 0.0 5.012 ± 2.8 0.997 ± 0.0
0 10 20 30 40 50 6
0
0
1
2
3
4
5
6
time
(
s
)
Lung volume (lit res
)
Spirometry lung air volume
absolute EIT lung volume
NEURAL-FUZZY MODELLING OF LUNG VOLUME USING ABSOLUTE ELECTRICAL IMPEDANCE
TOMOGRAPHY
47
(a)
(b)
Figure 7: (a) The EITSPIRO model training results (b)
The EITSPIRO model testing results.
Table 3: (a) The models training fit results. (b) The models
testing fit results.
(a)
(b)
The EITSPIRO modelling results show that this
modelling structure can predict the lung air volume
with good accuracy in training (95.3%). When
testing a subject-specific model on a different
subject the average performance deteriorates to
about 72.7% accuracy. While this is an acceptable
performance it clearly demonstrates the effect of
inter-individual difference and the need for subject-
specific models (or patient-specific in the case of
clinical use). Figure 8 shows the lung R-V
relationship for the eight subjects as predicted by the
ANFIS model. There is a common trend between the
different subjects (resembling the Nopp
model/equation), but it also shows how different this
behaviour can be between subjects. Figure 9 shows
the lung volume of one healthy subject as measured
by Spirometry, estimated by aEIT and predicted by
the ANFIS model. It is clear that the ANFIS model
best predicts the subject’s lung volume as compared
with the aEIT system. The advantage of the ANFIS
model is clear, however to be able to implement this
on a real system the model would need some type of
calibration, for every time it is used, to account for
the inter-individual differences of the subjects.
Figure 8: The plot of lung R-V relationship for the eight
subjects as predicted by the ANFIS model.
Figure 9: The plot of EITSPIRO model predicted lung air
volume, actual absolute EIT lung volume and actual
spirometry lung air volume.
2 4 6 8 10 12
1
2
3
4
5
6
EIT absR
EITSPIRO lung air volume
0 500 1000
0
2
4
6
Model training results
Actual output
ANFIS predicted output
0 5 10
0
5
10
15
real
prediction
training results
0% Error Line
Model Predictions
+/- 10% Error Line
200 400 600 800 1000
-2
-1
0
1
2
MAE= 0.08481
training error
0 100 200 300 400 500 600 700
0
0.5
1
1.5
2
2.5
3
3.5
4
4.5
5
5.5
Model testing results
Actual output
ANFIS predicted output
0 1 2 3 4 5 6 7 8 9 10
0
5
10
15
real
prediction
testing results
0% Error Line
Model Predictions
+/- 10% Error Line
100 200 300 400 500 600 700
-2
0
2
MAE= 0.13971
testing error
rmse mae% eSD Cor
S1 0.0951 1.6843 0.0952 0.9968
S2 0.2325 4.8183 0.2326 0.9718
S3 0.1025 1.1356 0.1026 0.9962
S4 0.6068 13.6506 0.607 0.9417
S5 0.1553 4.1812 0.1554 0.9867
S6 0.3583 6.4761 0.3585 0.821
S7 0.0951 2.6752 0.0952 0.9893
S8 0.1245 2.7523 0.1245 0.9714
mean ± SD 0.221 ± 0.2 4.672 ± 4.0 0.221 ± 0.2 0.959 ± 0.1
rmse (mean ± SD) mae%(mean ± SD) cor(mean ± SD)
S1 0.655 ± 0.42 14.17 ± 8.56 0.931 ± 0.09
S2 4.094 ± 3.39 51.77 ± 13.47 0.837 ± 0.13
S3 0.733 ± 0.42 16.73 ± 9.68 0.925 ± 0.08
S4 1.465 ± 0.63 36.39 ± 16.07 0.864 ± 0.10
S5 0.953 ± 0.28 20.13 ± 7.71 0.915 ± 0.09
S6 1.267 ± 0.51 28.47 ± 9.33 0.912 ± 0.04
S7 2.178 ± 1.78 25.84 ± 12.56 0.828 ± 0.13
S8 2.381 ± 2.19 24.9 ± 8.63 0.856 ± 0.12
2 4 6 8 10 12 14 16 18 20
1
2
3
4
5
6
7
8
9
EIT absR
EITSPIRO model LV
S1
S2
S3
S4
S5
S6
S7
S8
0 10 20 30 40 50 60
0
1
2
3
4
5
6
time
(
s
)
Lung volume (litres)
Spirometry LV
Model predicted spirometry LV
EIT absolute LV
BIOSIGNALS 2011 - International Conference on Bio-inspired Systems and Signal Processing
48

5 CONCLUSIONS AND FUTURE
WORK
Electrical Impedance Tomography was developed in
the early 1980s and it has since shown real potential
to being exploited for clinical use (bedside
monitoring in the Intensive Care Unit - ICU). Recent
developments in the field of absolute EIT
demonstrate how one may use it to estimate absolute
values of lung volumes which are key to any on-line
EIT based monitoring system. However, the current
system can be further improved, in particular in the
area of lung volume estimation accuracy. In this
study a Neural-Fuzzy modelling structure is used to
model the relationship between the lung absolute
resistivity and lung volume (lung R-V). Data
recordings were used from eight (8) healthy subjects
in a sitting position in order to train the models. It
was shown that the modelling structure can model
very accurately the aEIT lung volume estimation,
although this method forces the model to ‘inherit’
the inaccuracies associated with the aEIT theoretical
and empirical equations. In a different approach, it
was also shown how one can model the lung R-V by
‘bypassing’ the physical equations and directly
model the lung volume based on real volumetric
measurements using Spirometry (to record relative
volume) and Body Plethysmography (to record lung
Residual Volume). To our knowledge this is the first
data-driven model developed to describe the
behaviour of lung Resistivity-Volume in the
absolute EIT system. The developed models show a
very good agreement between the real data and the
model predictions, however high inter-individual
differences were also noted. Although, on an
individual basis, each ANFIS model (patient-
specific) outperforms the current aEIT system’s lung
volume estimations. In clinical science, inter-patient
variability is endemic; this is why it is of the opinion
of the authors that an extension to the presented
approach is needed, whereby the model auto-
calibrates to account for inter-individual differences
between patients. The new modelling structure
should be able to classify the ‘patient-type’ based on
the R-V behaviour curves and adjust the predictions
accordingly.
ACKNOWLEDGEMENTS
The authors would like to acknowledge the UK-
EPSRC for the financial support under Grant
Number EP/F02889X/1.
REFERENCES
Barber, D. C., Brown, B. H., 1984, ‘Applied potential
tomography’, Journal of Physics E: Scientific
Instruments, 17: 723-733.
Barber, D. C., Seagar, A. D., 1987, ‘Fast reconstruction of
resistance images’, Clinical Physics & Physiological
Measurement, vol. 8, Supplement A, pp. 47-54.
Barber, D. C., Borsic, A., 2005, ‘Electrical Impedance
Tomography: Methods, History and Application’,
Institute of Physics.
Brown, B. H., 2003, ‘Electrical impedance tomography
EIT: a review’, Journal of Medical Engineering &
Technology, vol. 27, no. 3: 97-108.
Brown, B. H., Barber D. C., 1985, ‘Applied potential
tomography: possible clinical applications’, Clinical
Physics & Physiological Measurement, vol. 6, no. 2:
109-21.
Brown, B. H., Leathard, A. D., 1995, ‘Measured and
expected Cole parameters from electrical impedance
tomographic spectroscopy images of the human
thorax’, Physiological Measurement, vol. 16,
Supplement 3A: A57-67.
Brown, B. H., Primhak, R. A., Smallwood, R. H., P.
Milnes, Narracott, A. J., Jackson, M. J., 2002,
‘Neonatal lungs-can absolute lung resistivity be
determined non-invasively?’, Med & Biological Eng
& Computing, 40, pp.388-394.
Brown, B. H., Mills, G. H., 2006, ‘Indirect measurement
of lung density and air volume from Electrical
Impedance Tomography EIT data’, World Congress
on Medical Physics and Biomedical Engineering,
Seoul, Korea.
Coulombe, Nicolas., Gagnon, Herve., Marquis, Francois.,
Skrobik, Yoanna., Guardo, Robert., 2005, ‘A
parametric model of the relationship between EIT and
total lung volume’, Physiological Measurement 26
401-411.
Harris, N. D., Suggett, A. J., Barber, D. C., Brown, B. H.,
1987 ‘Applications of applied potential tomography
APT in respiratory medicine’, Clin. Phys. Physiol.
Meas., vol. 8, pp. 155-165.
Harris, N. D., Suggett, A. J., 1988. ‘Applied potential
tomography: a new technique for monitoring
pulmonary function’, Clinical Physics &
Physiological Measurement vol. 9 Supplement A: 79-
85.
Jang, J., 1993, ‘ANFIS: Adaptive-Network-Based Fuzzy
Inference System’, IEEE Trans. On Systems, Man and
Cybernatic, 23, pp.665-685.
Panoutsos G, Tunney, D. R., Mills G. H., Al-Jabary, T.,
Mahfouf, M., Brown, B. H., 2008, ‘An improved
algorithm for accurate absolute EIT lung volume
estimation and localisation’, Proceedings of the
International Conference of the ATS (American
Thoracic Society), May 16-21, Toronto, Canada.
Panoutsos G, Tunney, D. R., Mills G. H., Al-Jabary, T.,
Mahfouf, M., Brown, B. H., 2008, ‘Electrical
Impedance Tomography: an evaluation of its ability to
detect changes in lung volume and expansion during
NEURAL-FUZZY MODELLING OF LUNG VOLUME USING ABSOLUTE ELECTRICAL IMPEDANCE
TOMOGRAPHY
49

single lung ventilation’, Proceedings of the ARS
Meeting Anaesthetic Research Society, British Journal
of Anaesthesia, vol. 100, no. 4: 584P, 14-15 Jan. 2008
London, UK.
Sugeno, M., Kang, G. T., 1988. ‘Structure Identification of
Fuzzy Model’, Fuzzy Sets and systems, vol. 28, no. 1,
pp. 15-33.
Takagi, T., Sugeno, M., 1985, ‘Fuzzy identification of
systems and its applications to modelling and control’,
IEEE Trans. Systems, Man., and Cybernatics, vol. 15,
no. 1, pp.166-132.
Zubal, I. G., Harrell, C. R., Smith, E. O., Rattner, Z.,
Gindi, G., Hoffer P. B., 1994, ‘Computerized three-
dimensional segmented human anatomy’, Medical
Physics, vol. 21, no. 2, pp. 299-302.
BIOSIGNALS 2011 - International Conference on Bio-inspired Systems and Signal Processing
50
