
THE C@ROLIN@ SOFTWARE
A System for Monitoring Skills Development of Children with Down Syndrome
Salvatore Cuomo, Aniello Murano and Francesco Piccialli
Faculty of Science MNF, University of Naples Federico II, Naples, Italy
Keywords:
Design and development methodologies for Healthcare IT, Assessment, Databases and datawarehousing,
Datamining, Support for clinical decision-making, Numerical Extrapolation.
Abstract:
The study of medical protocols for monitoring and analyzing the cognitive development of children with
disabilities is a fundamental research area. In this context, a well established curriculum-based assessment is
the Carolina Curriculum for Infants and Toddlers with Special Needs(CCITSN). This is a suitable curriculum
for early intervention programs, where sequenced items data collection and analysis allow for monitoring,
incremental program change, and recognition of areas of relative strength and weakness in children with mild,
moderate, or severe disabilities.
This paper describes the design and the development of an information system based on a client-server soft-
ware application, named C@rolin@, which carries out all CCITSN abilities and more, for the monitoring and
the analysis of data coming from a medical protocol for children with the Down syndrome. In particular, by
means of user-friendly graphic interfaces, the C@rolin@ software helps users to add, modify, recover, and
analyze data, to watch singular and aggregate data via customized reports, as well as to interpolate data among
children to determine or prevent specific behaviors.
1 INTRODUCTION
The study of medical protocols for monitoring and an-
alyzing the cognitive development of children with
disabilities is a very spread out research area (c.f.,
(R. S. Chapman, 2000)). Many studies in this field
are based on means-end behavior, which involves a
painful execution of a sequence of steps to achieve a
goal and occurs in situations where an obstacle pre-
venting achievement of the goal must be initially re-
moved (Piaget, 1953; Woodward, 1971). Means-end
is considered a fundamental cognitive milestone due
to its strong correlation to the field of verbal and non-
verbal intentional communication (E. Bates, 1979a;
E. Bates, 1979b) and its relationship to understanding
the intent of other actions (S. Bruce, 2009). While the
majority of means-end research on children without
disabilities focuses directly on the developmental se-
quence and the age at which means-end behaviors are
achieved, most of the research on children with se-
vere disabilities emphasizes how the development of
means-end is connected to intentional communication
and language development. In this contexts, it is well
stated the importance of creating accessible opportu-
nities for children with disabilities to observe others
solving means-end problems (that is, problems in
which one must act on an intermediary to attain a goal
object).
Means-end behaviors can be assessed using for-
mal assessment tools, informal commercial tools, or
through structured informal assessment. In the case
of young children, the assessment is often done in
the context of play, but adults can create opportu-
nities for children of any age to display means-end
skills as well. In this context, the Carolina Cur-
riculum for Infants and Toddlers with Special Needs
(CCITSN) (M. Nancy, 2004) is a well established
curriculum-based assessment that provides interven-
tion strategies appropriate for young children with
disabilities. In particular, it allows for early inter-
vention programs, where sequenced items data col-
lection and analysis allow for monitoring, incremen-
tal program change, and recognition of areas of rel-
ative strength and weakness in an individual infant
or child with mild, moderate, or severe disabilities.
The curriculum is based on normal sequences of de-
velopments but does not assume even development
across domains. The curriculum recognizes the im-
portance of teaching adaptive skills that temporar-
ily or permanently replace normal skills as neces-
180
Cuomo S., Murano A. and Piccialli F..
THE C@ROLIN@ SOFTWARE - A System for Monitoring Skills Development of Children with Down Syndrome.
DOI: 10.5220/0003135401800185
In Proceedings of the International Conference on Health Informatics (HEALTHINF-2011), pages 180-185
ISBN: 978-989-8425-34-8
Copyright
c
2011 SCITEPRESS (Science and Technology Publications, Lda.)

sary. It provides functional activities, suggestions
and suitable adaptations to address sensory/motor is-
sues and stresses the importance of family involve-
ment throughout the assessment-intervention process.
Practically, CCITSN allows to collect continuously
data on the children’s progresses along the curricu-
lum. The quantitative information are also compared
with qualitative data collected by interviewing both
children and their relatives. The interview analysis
is used to explore children’s perceptions and experi-
ences through the identification of lexical fields, key-
words and phrases. The interviews produce data to
gauge the effectiveness of the interventions, programs
and transition plans for each of the different settings.
All the acquired data will be used to check whether
a child develops the right skills in accordance to his
age. If this is not the case, the data will then help to
determine the right program to follow to recover such
skills. Finally, we report that recently in Italy the Car-
olina Curriculum has been adopted as a basic service
within several local Regional Service Systems (ASL).
Although the advantages of the Carolina Curricu-
lum are intrinsically clear and well established (see
(E. Del Giudice, 2006) for a useful recent applica-
tion), its practical application suffers from the huge
quantity of information it has to collect and handle,
which is done continuously along the specific child
program. Indeed, we recall that the curriculum is
divided into 24 logical teaching sequences covering
five development domains (i.e., cognition, communi-
cation, social adaptation, fine motor, and gross mo-
tor). Each curricular item is then divided in six ar-
eas (i.e., title, objective, materials needed, teaching
procedures, routine integration strategies, and senso-
rimotor adaptations). Each of such areas is then di-
vided in several sequences. Totally, the curriculum
allows to monitor 531 abilities and the goal here is to
ensure that each child acquires all these abilities by
the end of the monitoring process. This huge amount
of data (and thus of work) makes quite impossible to
manage the Caroline Curriculum by hands and gen-
eral commercial software tools are less appropriate to
collect and properly elaborate all these data.
The aim of this work is to design and de-
velop a full web application software system, named
C@rolin@, based on the Carolina Curriculum frame-
work. This software allows, from one side, to ef-
ficiently collect, represent, and evaluate the rela-
tive data along the curriculum and, from the other
side, to support educators, doctors, parents, volun-
teers, therapists, and the children themselves in the
assessment-intervention process of the children in-
volved, all as required by the Carolina Curriculum.
Hence, C@rolin@ fully takes care of all 531 items on
which the evaluation table of the Carolina Curricu-
lum is based. Moreover, C@rolin@ allows all peo-
ple involved in the children development skills pro-
cess to have a concurrent and real-time access to all
data, with respect to their own access privileges, and
to add, modify, elaborate, and organize them. Teach-
ers and doctors can check at any time the performance
of all children activities and use this information to
better plan the future activities. Also, they can make
data interpolation among children (also using history
data) to better organize the future programs as well
as prevent problems/failures, of any sort, in the fu-
ture. As one may expect, C@rolin@ benefits of all
positive aspects of a client-server software. Among
the others, we report that it can avoid data duplica-
tion, ensures data coherence, allows using a common
tool for monitoring results across different develop-
ment areas, allows to easily extract aggregate data to
be used in external systems, etc.
Practically, C@rolin@ is realized by means of the
following implemented modules:
• Evaluation Tables;
• Identification of emerging skills, the consolidated
ones, and those not yet acquired;
• Data analysis: score, development age, develop-
ment quotient;
• Overall Program Planning;
• Development Progress Chart (DPC).
• Working Plan: daily, weekly, and monthly tasks
description;
2 THE SOFTWARE
ARCHITECTURE
The C@rolin@ software has been implemented over
a three–tier infrastructure, that is, a client–server ar-
chitecture in which the presentation, the application
processing, and the data management are logically
separate processes. We have chosen to use a multi-
tier architecture as it allows to develop a flexible
and reusable application. Indeed, by breaking up the
C@rolin@ software into tiers, future developmentsof
the software may involve only a specific layer, rather
than to rewrite the entire application over.
Specifically, the C@rolin@ software has a client
tier, an application tier, and a data tier, working as
follows:
• Client Tier. This is the topmost level of the ap-
plication. It is composed of the front-end pages of
users (doctors, teachers, families, ecc) interfaces
THE C@ROLIN@ SOFTWARE - A System for Monitoring Skills Development of Children with Down Syndrome
181
and displays information related to these actors.
These interfaces are described in more details in
the following;
• Application Tier. This tier is composed of the
PHP (version 5) modules implementing the busi-
ness logic of the application. Most of these mod-
ules are responsible for processing the user input
from the upper tier and for loading and storing
data in the lower tier. Note that, at this level, it
is hidden the way the storage of data is imple-
mented;
• Data Tier. This tier consists of a relational
database server, deployed by using MySql as a
database management system, where all informa-
tion are stored. In particular, all relationships be-
tween the different domains with sequences and
items on which the Carolina Curriculum is base
have been implemented. This tier keeps data neu-
tral and independent from the other two tiers.
The application is fully accessible with a web
browser. The navigation is facilitated across the sim-
ple interfaces based on menus and navigation bars.
No browser plug-in installations are needed, except
for the Java runtime to run applets. It is worth not-
ing that the system has been tested on recent versions
of the most common browsers (i.e., Internet Explorer,
Mozilla Firefox and Google Chrome).
The database has the aim of recording for each
child all the evaluation data, their elaboration, and in
particular the data scores. Also, the database offers
a useful centralization of data, in such a way that ev-
ery subject involved in the Carolina Curriculum can
easily access to the children information database, ac-
cording to their access privilege, in order to add, mod-
ify or simply watch children data and programs.
In order to get a further logical separation at the
presentation level (i.e, at Client Tier level) we also use
in C@rolin@ a Model View Control (MVC) architec-
ture. Note that while the three-tier infrastructure is
mainly physical, the MVC architecture pattern estab-
lishes a division of responsibilities between compo-
nents at a use case level, without mentioning physical
boundaries (in deployment terms).
The overall software architecture allows to access
easily to clear tables and charts to fully understand
the development level reached by children, as well
as the program they have been following since their
enrollment under the Carolina Curriculum. The soft-
ware is built in such a way it can offer data analysis
as well as data comparison to determine or prevent fu-
ture events. Finally, the software is build in order to
easily support the export of aggregate data to be used
in external systems.
3 DATA ANALYSIS
As it is well known by medical expertises, the appro-
priate use of the Carolina Currriculum is based on
the following main steps: (i) Determine initial chil-
dren status, (ii) Plan the right program and implement
it, (iii) possibily, change the program according to
the ongoing collection of data. These steps are im-
plemented by using a simplified Elettoronic Patient
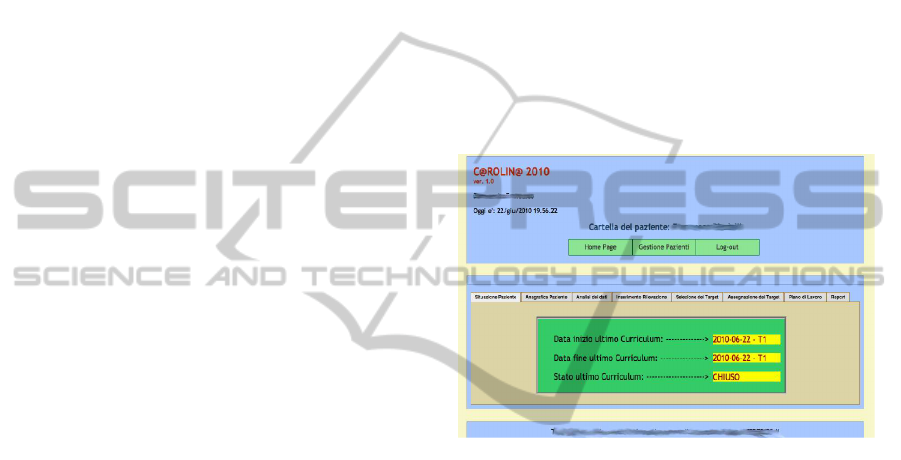
Record (ERP), as we have implemented (see Figure
1). The ERP is composed of eight panels, which al-
lows to make, in a sequential way, the following main
tasks required by the Carolina Curriculum: prelimi-
nary evaluation, data store, data analisys, program
plan.
Figure 1: The ERP along with its eight panels.
The user-friendly graphic interface allows the op-
erator to easily open a new curriculumor a child (eval-
uation table), record his data, as well as calculate and
show all relative scores. Then, by using clear data
reports built apon this information, the operator is as-
sisted to set up the most appropriate program for the
child, as well as to monitor his developments along
the time. Also, the reports help the operator to decide
wheter it is better to modify the planned program or
stay with it (see Figure 3). This guarantees that every
child will have his own program, corresponding to his
specific needs.
In Figure 3, we show the
Data Report Panel
that reports, by means of tables and development
progress charts, the following information: develop-
ment age, development rate, partial and global perfor-
mance indexes of the applied program. All these data
are calculated (and thus shown) for each domain area
and/or sequence. Also, it is possible to show current
data variations with previous evaluations. Using these
data, the operator has always in real-time the com-
plete and detailed picture of the children skills devel-
opment.
HEALTHINF 2011 - International Conference on Health Informatics
182
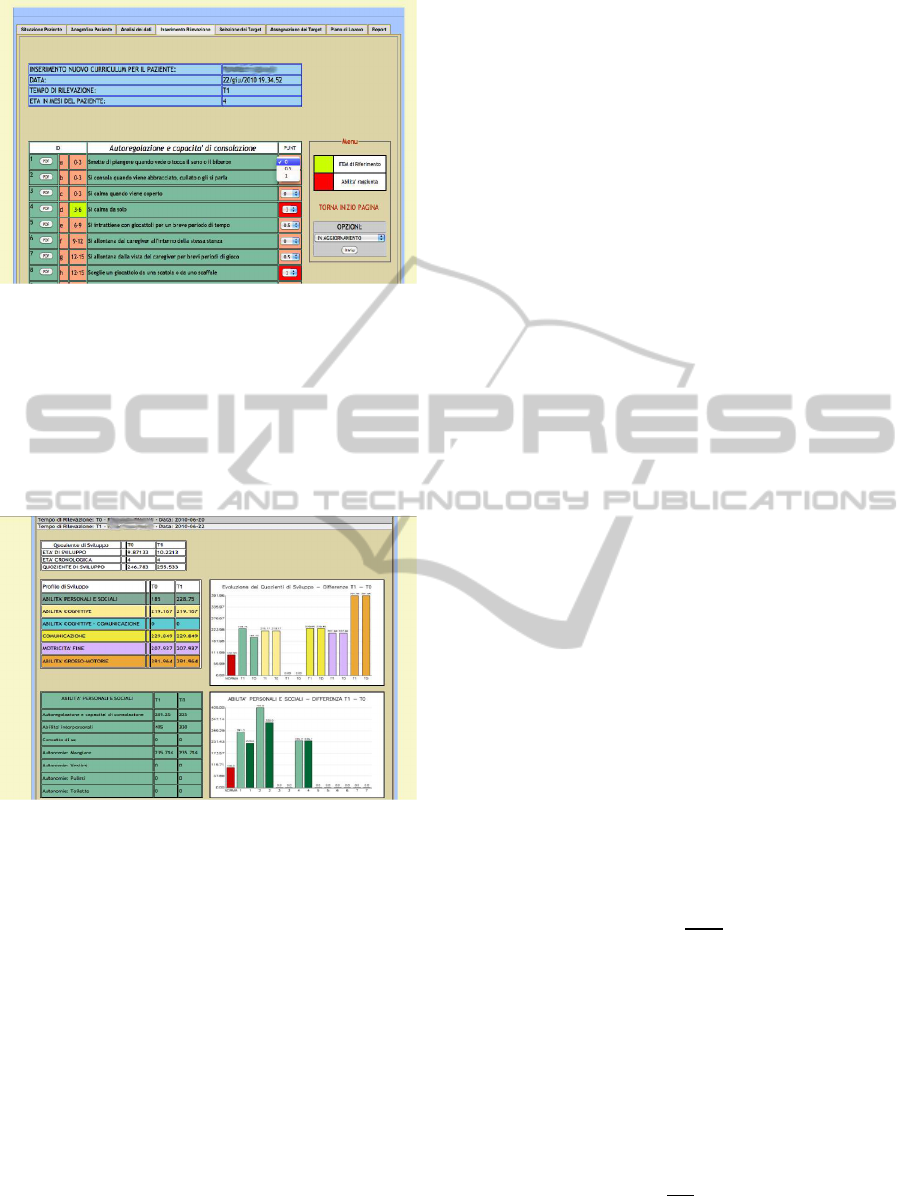
Figure 2: The new child curriculum panel.
It is worth noting that such a panel organization
is hard to reproduce by using classical software tools
such as spreadsheets, because of the huge amount of
data to be handled and the continuous adaptations of
the program to the specific needs of the children un-
rolled under the curriculum.
Figure 3: The Data Report Panel.
The modular functionality of the C@rolin@ soft-
ware (i.e., its break down in the above described pan-
els) reflects the modular architecture of the software.
The latter is very useful in the case one has to mod-
ify a module and even more in the case a new module
for a specific task has to added in the future. In this
case, indeed, it is not required to modify the entire
software, but only the part under interest.
Observe that also the Carolina Curriculum has
been efficiently thought in a modular way. This is just
because, as any medical protocol, it is characterized
by fast and deep changes along the time. The Carolina
Curriculum is now days at its third edition and, thanks
to its modularity, every new release has been obtained
by simply adding new tasks, without changing the ba-
sic structure of the curriculum. In the same way, one
can add a new domain area in the C@rolin@ soft-
ware by simply updating the database. Technically, it
is not required to touch the graphic interface as it is
a web based application. Indeed, it is automatically
generated by means of the structure of the Curricu-
lum stored in the database). So, the new domain area
is added to the graphic interface for free.
3.1 A Guided Planning Program
The C@rolin@ software is developed in order to set
up a specific program for each patient. This is done
by collecting and evaluating data along the time. At
each evaluation stage, the software select a list of 31
skills not acquired yet (corresponding to item data
scored with 0) and 31 emerging skills (corresponding
to item data scored with 0.5). The operator then se-
lects at most six specific skills among them to plan
the program. The planning consists of associating
the selected items specific daily tasks (made in rou-
tine), by means of ad-hoc strategies and specific tools.
The main children daily routines are: Eating, Sleep-
ing, Dressing, Playing with adults, Playing alone,
and Reading. The program results are stored in the
database along with the score achieved and the main
difficulties registered. By using overall information
stored in the database such as development age, de-
velopment rate, family conditions, etc. the software
suggests the right planning program for improving the
children skills.
Suppose that we want to compute some values in
the
Data Report Panel
, such as development age,
development rate, partial performance index of the
applied program, for each domain and sequence. This
is performed by applying specific formulas (defined
by the Carolina Curriculum), reported in the follow-
ing, each one developed in a specific module of our
software. For the development rate, we first have to
calculate the weight (PI) of the Item, as follows
PI =
PTA
NI
(1)
where PTA is the typical period of a skill reached and
NI is the number of items.
The development age is:
ES = PG∗ PI (2)
where PG is the row score.
The development rate is:
QS =
ES
EC
× 100 (3)
where EC is the chronological age.
THE C@ROLIN@ SOFTWARE - A System for Monitoring Skills Development of Children with Down Syndrome
183
The partial performance index of the applied pro-
gram is equal to the performance between two sub-
sequent evaluations. Formally, it is expressed by the
following formula
IE =
ES(t
n
) − ES(t
n
1
)
T
(4)
where T is therapy time.
The overall information obtained by the Carolina
Curriculum therapy are elaborated by different soft-
ware modules and for each patient the results of
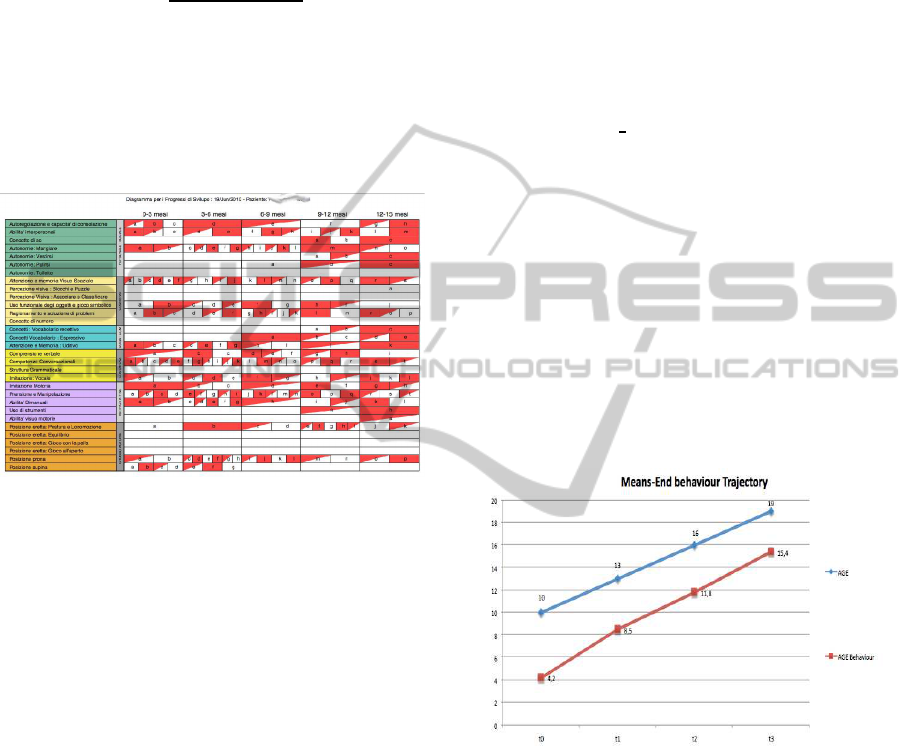
ad-hoc planning program is reported in a Develop
Progress Diagram (DPD) as showed in figure 4.
Figure 4: A Develop Progress Diagram (DPD). Blank cells
correspond to score 0, red cells correspond to score 1, the
remaining ones to score 0.5.
By means of the DPD, the operator at a glance can
immediately observe the children skills status.
4 PRACTICAL EXPERIENCES
In this section, we underline few interesting potential-
ities of the implemented software in the analysis of
data. The presence of a central database permits the
comparison of acquired skills from different patients
and the efficient monitoring of the program on each
children. The difference with a classical spreadsheet
is also in the possibility to get out information through
the opportune queries to the database and to com-
bine information through formulas seen in the previ-
ous section.
4.1 Analysis of Development Trajectory
Assume that we want to extract some medical infor-
mation from a number of patients enrolled under the
Carolina Curriculum. This can be done by means of
ad-hoc queries, which are performed by an authorized
operator. In the following, we report fews examples
of such queries and the consequent analysis on real
data.
SELECT AVG (ES) FROM CURRICULUM
WHERE AGE = 10 AND T_RILEV = 0;
SELECT AVG (ES) FROM CURRICULUM
WHERE AGE = 13 AND T_RILEV = 1;
SELECT AVG (ES) FROM CURRICULUM
WHERE AGE = 16 AND T_RILEV = 2;
SELECT AVG (ES) FROM CURRICULUM
WHERE AGE = 19 AND T_RILEV = 3;
where the field T RILEV represents the evaluation
time. In words the above queries allow to select the
following children:
• those ones having started the program at the age
of 10 months;
• those ones having started the program at the age
of 7 months;
• those ones having started the program at the age
of 4 months;
at specific evaluation times T
0
, T
1
, T
2
, T
3
. In Figure 5,
there is the comparison between the development tra-
jectory of a child without disabilities (ideal trajectory)
and the measured one.
Figure 5: A comparison between the ideal development tra-
jectory and the measured one. The ordinate axis gives the
development age.
Then, by means of the following query:
SELECT AVG (ES) FROM CURRICULUM
WHERE AGE = 10 AND T_RILEV = 1;
SELECT AVG (ES) FROM CURRICULUM
WHERE AGE = 13 AND T_RILEV = 2;
SELECT AVG (ES) FROM CURRICULUM
WHERE AGE = 16 AND T_RILEV = 3;
SELECT AVG (ES) FROM CURRICULUM
WHERE AGE = 19 AND T_RILEV = 4;
we select both children having the age of 10 months
at time T
0
or T
1
. Similarly, we select by means of a
query both children having the age of 10 months at
HEALTHINF 2011 - International Conference on Health Informatics
184
time T
0
or T
2
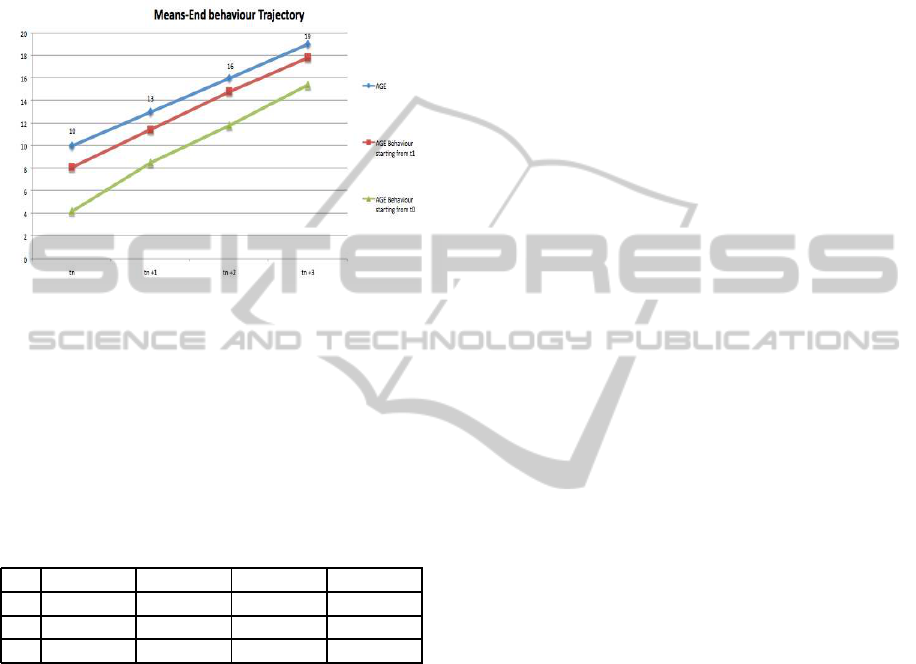
As it is shown in Figure 6, the develop-
ment trajectory of the children that have been unrolled
under the curriculum for more time, it is much more
close to that one related to those children that have
been unrolled under the curriculum from less time.
This at any fixed age.
Figure 6: Comparison between development trajectory of
children unrolled under the curriculum for different time.
The ordinate axis give the development age.
4.2 Analysis of the Development Rate
On a real sampling of 12 patients enrolled under the
Carolina Curriculum, we select information about the
developmentrate automatically calculated by the soft-
ware.
Table 1: Development Rate.
10 months 13 months 16 months 19 months
T
0
25.2 34.3 44.5 55,7
T
1
45.1 49.3 55.4 62.3
T
2
54.3 58.8 63.6 67.1
The values are normalized to 100. Observe that the
more the children are enrolled under the curriculum
the more the development rate get closer to the ideal
development rate.
5 CONCLUSIONS
In this work, we have reported a study for the design
and the development of an information system soft-
ware based on client-server application for the im-
plementation of the Carolina Curriculum for children
with special needs. This Curriculum concerns the
continuous collection of severaldishomogeneous data
and its analysis to set-up an appropriate program for
the skill development of children with special needs.
In particular these data are the bottle-neck in the prac-
tical application of the Carolina Curriculum due to the
concurrent management of evaluation tables, scores,
development indicators, etc. The software we have
implemented solves this problem by means of a user-
friendly web application in which the operator by
means of a modular structure, can add, modify, delete,
recover patient data as well as to show aggregate data
via charts. These operations are all required by the
Carolina Curriculum. Moreover, the software offers a
comparison among data that is unthinkable using Car-
olina Curriculum by hands. In particular, by means of
a clinical application, it has been possible to show in-
teresting properties over the patients treatment: “the
more the children have been unrolled under the cur-
riculum the more their behavior is closed to a stan-
dard one”. This property is important not only from
its one, but also to set-up the ability of our software to
be an useful tool for future medical research.
ACKNOWLEDGEMENTS
We thank Professor E. Del Giudice of Department of
Pediatrics for the data he gave us for testing our soft-
ware. We also thank Dott. A. Olivo for useful dis-
cussions on the Carolina Curriculum, on which she is
an expert, and for her practical advices on developing
the software.
REFERENCES
E. Bates, L. Benigni, I. B. L. C. V. V. (1979a). The emer-
gence of symbols: cognition and communication in in-
fancy. New York: Academic Press.
E. Bates, L. Benigni, I. B. L. C. V. V. (1979b). Perceptual
aspects of tool use in infancy. In Infant Behavior and
Development, 34, pages 127 – 140.
E. Del Giudice, L. Titomanlio, G. B. A. B. A. R. G. M. R.
P. O. D. M. E. T. G. A. (2006). Early intervention
for children with down syndrome in southern italy:
The role of parent-implemented developmental train-
ing. Infants and Young Children, 19:1:50–58.
M. Nancy, Johnson-Martin, S. M. A. B. J. H. (2004). The
Carolina Curriculum for Infants and Toddlers With
Special Needs. Paul H. Brookes Pub Co., 3rd edition.
Piaget, J. (1953). The origin of intelligence in the child.
London: Routledge and Kegan Paul.
R. S. Chapman, L. J. H. (2000). Behavioral phenotype of
individuals with down syndrome. Mental Retard. De-
velopm. Disabil. Res., Rev. 6:84–95.
S. Bruce, C. Campbell, M. S. (2009). Supporting chil-
dren with severe disabilities to achieve means-end.
TEACHING Exceptional Children Plus, 6:1:1–15.
Woodward, W. M. (1971). The development of behaviour.
Harmondsworth, England: Penguin.
THE C@ROLIN@ SOFTWARE - A System for Monitoring Skills Development of Children with Down Syndrome
185
