
HEART RATE VARIABILITY ANALYSIS OF CHILDREN WITH
REFRACTORY EPILEPSY BEFORE AND AFTER THE VAGUS
NERVE STIMULATION
Milica Milošević, Steven Vandeput, Sabine Van Huffel
Department of Electrical Engineering (ESAT-SCD), Katholieke Universiteit Leuven
Kasteelpark Arenberg 10 postbus 2446, B-3001 Leuven, Belgium
Katrien Jansen, Lieven Lagae
Department of Pediatrics, University Hospital Gasthuisberg, Herestraat 49, B-3000 Leuven, Belgium
Keywords: Refractory epilepsy, Heart rate variability, Nonlinear HRV parameters, Vagus nerve stimulation.
Abstract: Vagus nerve stimulation (VNS) is a well-known therapeutic option for patients with refractory epilepsy who
do not respond to adequate anti-epileptic drugs. Heart rate variability (HRV) is mediated by sympathetic
and parasympathetic efferent activities which always interact towards the heart. Our goal was to describe
the link between autonomic nervous system (ANS) and HRV. In 18 epileptic children, ECG data were
obtained before and after implantation of the VNS. HRV was measured by linear and nonlinear parameters
during 50 minute epochs during phase 2 of sleep and deep sleep. Results of the patients were compared with
those of an age and sex matched control group. We were able to confirm that vagus nerve stimulation do not
influence heart rate in children with refractory epilepsy. After the VNS implantation, there is a shift in
sympathovagal balance towards sympathetic predominance in phase 2 of sleep (p=0.177) and also during
deep sleep (p=0.035). This study suggests that left vagus nerve stimulation has little effect on heart rate
variability as measured by nonlinear parameters.
1 INTRODUCTION
The subjects with refractory epilepsy do not respond
to adequate anti-epileptic drugs (30-40%) and they
are prone to autonomic dysfunction. Stimulation of
the vagus nerve is a valuable option for these
subjects. Their heart rate (HR) and autonomic
nervous system (ANS) have been changed due to the
vagus nerve stimulation (VNS). Since the ANS
affects heart rate by continued interaction between
his two branches, sympathetic and parasympathetic,
heart rate variability (HRV) can be used as a
noninvasive tool to show information about the
functional state of the ANS (TASK FORCE, 1996).
Autonomic modulation of heart rate is often
studied by linear parameters, but nonlinear
parameters have opened a new approach for
studying and understanding the
characteristics of
cardiovascular dynamics. They give additional
information about the nonlinear dynamics in the
cardiovascular system, like the quality, scaling and
correlation properties, which cannot be reflected by
standard HRV analysis.
Changes in HR and HRV after the VNS
implementation have been studied using linear
parameters for short-term epochs (5 minutes) by
Setty et al. (1998). Nonlinear HRV analysis on long-
term epochs (50 minutes) of the ECG signals of
children with refractory epilepsy were never done to
our knowledge. Also HRV analysis was never done
in this field for two stages of sleep separately.
The aim of this study is to investigate HRV
parameters of 50 minutes ECG recordings before
and after implantation of the VNS in epileptic
children and to compare these results with the results
of the control group for both sleep stages. Emphasis
will be on how the VNS influences the autonomic
nervous system.
409
Miloševi
´
c M., Vandeput S., Van Huffel S., Jansen K. and Lagae L..
HEART RATE VARIABILITY ANALYSIS OF CHILDREN WITH REFRACTORY EPILEPSY BEFORE AND AFTER THE VAGUS NERVE STIMULATION.
DOI: 10.5220/0003132504090412
In Proceedings of the International Conference on Bio-inspired Systems and Signal Processing (BIOSIGNALS-2011), pages 409-412
ISBN: 978-989-8425-35-5
Copyright
c
2011 SCITEPRESS (Science and Technology Publications, Lda.)

2 METHODS
2.1 Subjects
Originally, 18 subjects (age 2-16 years, 13 males)
with refractory epilepsy participated in this study.
However, only data of 17 subjects could finally be
used. Each subject was measured at two different
time moments, before and long enough after the
implantation of the VNS, being sure of stabilized
conditions.
2.2 Data Collection and Preprocessing
ECG recordings were obtained using two leads with
a sample rate of 250 Hz on a PC based platform.
Two epochs of 50 minutes (one for phase 2 of sleep
and one for deep sleep) were selected manually. The
data length had to be equal in both epochs as well as
for all subjects (epileptic and control) in order to
extract consistent and reliable HRV parameters
(TASK FORCE, 1996). For each recording, a file
containing the consecutive RR intervals, derived
from the ECG signal, was exported and checked
manually before preprocessing. Extra ventricular
beats were replaced by a 20%-filter, meaning that
every RR interval that differs more than 20% of the
previous one is replaced by an average value of the 5
previous and 5 next RR intervals.
2.3 Linear HRV Parameters
All standard HRV parameters are calculated in
agreement with the standards of measurement
proposed by the Task Force of the European Society
of Cardiology and the North American Society of
Pacing and Electrophysiology (TASK FORCE,
1996). As time domain measures, we calculated
mean RR interval, SDNN, SDANN, RMSSD and
pNN50. After resampling the tachogram at 4 Hz
with the use of a cubic spline approximation, power
spectra were obtained by using the Welch method.
The direct current component was removed by
subtracting the mean value of the data set. A sliding
Hamming window of 1024 points with 50% overlap
was used. Three frequency bands were defined: a
very low frequency (VLF) band from 0 to 0.04 Hz, a
low frequency (LF) band from 0.04 to 0.15 Hz and a
high frequency (HF) band from 0.15 to 0.40 Hz.
Within each frequency band the spectral power was
expressed in absolute values (in ms
2
) as well as in
normalized units (n.u.) which represent the relative
value of each power component in proportion to the
total power minus the VLF component.
Additionally, a low-to-high frequency power ratio
(LF/HF) is calculated to reflect the sympathovagal
balance.
2.4 Nonlinear HRV Parameters
Nonlinear HRV techniques have not been
standardized as the linear ones. They give additional
information about the nonlinear dynamics in the
cardiovascular system which cannot be reflected by
standard HRV analysis. The most commonly used
nonlinear parameters are computed in this study.
The 1/f slope of the log(power) – log(frequency)
plot was obtained from the linear regression from
10
-4
to 10
-2
Hz (Kobayashi and Musha, 1982). A
slope of -1 is an indication of scaling behaviour.
Fractal dimension is based on the algorithm of
Katz (1988), which describes the planar extent of the
time series. The higher the FD, the more irregular
signal.
Detrended fluctuation analysis quantifies fractal
like correlation properties of the time series and
uncovers short-range and long-range correlations.
The root mean square fluctuation of the integrated
and detrended data are measured within observation
windows of various sizes and then plotted against
window size on a log-log scale (Peng et al., 1996).
The scaling exponent DFA α indicates the slope of
this line, which relates log(fluctuation) to
log(window size). Both the short-term (4–11 beats)
DFA α
1
and the long-term (>11 beats) DFA α
2
scaling exponents were calculated. Values of α
around 1 are an indication of scaling behaviour.
Sample entropy measures the likelihood that runs
of patterns that are close will remain close for
subsequent incremental comparisons. SampEn was
calculated according to the formula of Richman and
Moorman (2000) with fixed input variables m = 2
and r = 0.2 (m being the length of compared runs
and r the tolerance level). Higher values of SampEn
indicate a more complex structure in the time series.
Noise titration is currently the only algorithm
available that provides a sufficient test for chaotic
dynamics in noise-contaminated signals (Deng et al.,
2006). It measures chaos by controlled neutralization
with added noise. The output noise limit (NL) > 0
indicates the presence of chaos, and the value of NL
also gives an estimate of its relative intensity. We
calculated two parameters to investigate nonlinear
properties: NLmean (average of NL values
measured in 5 minute windows slid each 30 s) and
NLdr (corresponding detection rate).
BIOSIGNALS 2011 - International Conference on Bio-inspired Systems and Signal Processing
410
2.5 Statistical Analysis
To compare HRV parameters pairwise between the
different stages of sleep, the nonparametric
Wilcoxon signed rank test was used, as well as to
investigate the before-after VNS differences. For the
comparisons between epileptic and control groups,
Wilcoxon rank sum test was used.
Using those tests, p values were obtained to
examine the similarity between adequate groups for
each HRV parameter. In general, p<0.05 was
considered statistically significant.
3 RESULTS
On all 50 minute segments, during phase 2 of sleep
as well as during deep sleep, all HRV parameters
described in the previous sections were calculated.
beforeVNS afterVNS control beforeVNS afterVNS control
550
600
650
700
750
800
850
900
950
1000
1050
A
verage
RR
i
n
t
erva
l
s
PHASE 2
DEEP SLEEP
Figure 1: Boxplots for average RR intervals for phase 2
(first 3 boxes: epileptic subjects before and after the
implantation of the VNS, and their controls) and deep
sleep (last 3 boxes), respectively.
Detailed information about the mean RR
intervals is shown in Figure 1. Heart rate is
significantly lower for the control group in both
stages of sleep, phase 2 and deep sleep, compared to
the epileptic group, before (p=0.009 and p=0.008,
respectively) and after (p=0.042 and p=0.036,
respectively) implantation of the VNS. On the other
hand, VNS therapy doesn’t affect heart rate
(p=0.554 for phase 2 and p=0.795 for deep sleep).
Since standard deviations for HRV parameters in
the frequency domain are quite high, it is better to
observe values in normalized units. For phase 2 of
sleep, there is an increase of LFn.u. (p=0.209) and a
slight decrease of HFn.u. (p=0.309) due to the VNS
stimulation. There are no remarkable differences
between epileptic (both before and after the VNS)
and control groups, during phase 2. In contrast,
during deep sleep phase, these changes are
statistically significant. Again, HFn.u. (p=0.019)
decreased, and LFn.u. (p=0.019) increased after the
implantation of the VNS in epileptic subjects.
Compared to the control group, even before the
implantation of the VNS, epileptic subjects had
significantly different LFn.u. (p=0.023) and HF.n.u.
(p=0.028) parameters. After the start of the VNS, the
epileptic group is rambled further more from their
controls than before the VNS (p=0.003 for LFn.u.
and p=0.003 for HFn.u.).
beforeVNS afterVNS control beforeVNS afterVNS control
0.1
0.2
0.3
0.4
0.5
0.6
0.7
0.8
0.9
1
1.1
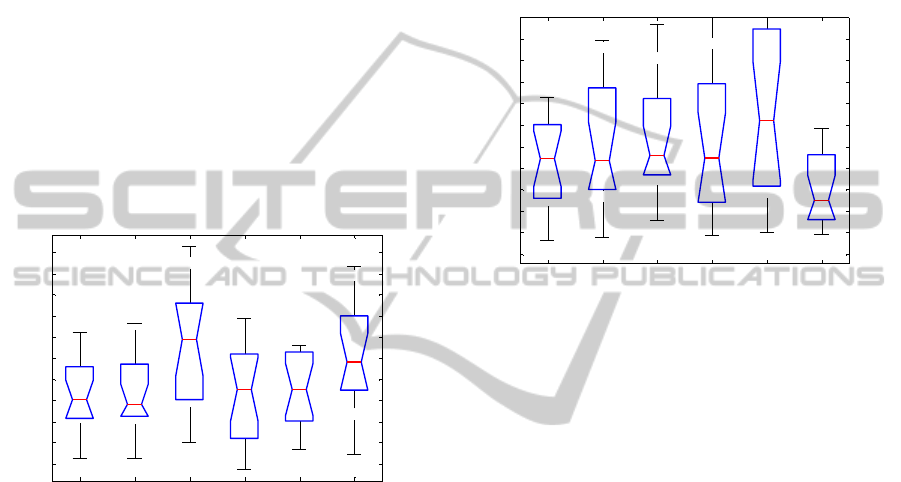
LF/HF
PHASE 2
DEEP SLEEP
Figure 2: Boxplots for LF/HF ratio for phase 2 sleep and
deep sleep, respectively.
There is an increase of LF/HF ratio in both
stages of sleep after the VNS stimulation (p=0.163
and p=0.049, for phase 2 and deep sleep,
respectively). This increase is higher during deep
sleep. For phase 2, LF/HF ratio is closer to LF/HF
ratio for the control group after VNS (p=0.654),
while for the deep sleep it is higher in both
conditions, before and after VNS (p
preVNS
=0.025 and
p
postVNS
=0.003). Figure 2 gives boxplots for all
groups for parameter LF/HF.
Coefficients α
1
and α
2
increase due to the
implantation of the VNS, especially during deep
sleep, when this increase is statistically significant.
While DFA coefficients of the epileptic group are
getting closer to their controls after the implantation
of the VNS during phase 2 of sleep (p=0.705 and
p=0.945, respectively), in deep sleep their values are
statistically different (p=0.012 and p=0.073,
respectively).
Noise titration is reported by the parameters
NLmean and NLdr. During phase 2 of sleep,
NLmean isn’t statistically different when comparing
pre-VNS versus post-VNS and compared to normal
subjects. In epileptic subjects before the
implantation of the VNS, NLdr is statistically higher
compared to the control group (p=0.046). The same
parameters, during deep sleep, don’t demonstrate
significant differences when comparing pre-VNS
HEART RATE VARIABILITY ANALYSIS OF CHILDREN WITH REFRACTORY EPILEPSY BEFORE AND AFTER
THE VAGUS NERVE STIMULATION
411

versus post-VNS and epileptic versus control
groups.
We found no significant changes in other
parameters due to the VNS, and when compared to
the control group.
4 DISCUSSION
As no remarkable difference was found between pre-
VNS and post-VNS implantation in epileptic
subjects, even when compared to the control group
for the parameters SDNN, SDANN, RMSSD, 1/f
slope, FD and SampEn, no discussion is made.
The major previous studies regarding the effects
of the VNS on HRV were performed during wake-
fulness. Setty et al. (1998) didn’t find any significant
effect of the VNS on the heart rate and heart rate
variability. This study confirmed that VNS does not
influence the heart rate in epileptic children (mean
RR interval in the Figure 1), which is significantly
higher compared to their controls. We found a
reduction of vagal tone after long-term VNS during
night-time, when autonomic control on heart rate
should be mainly sustained by vagal influence
(Pagani et al., 1997). This is however, in contrast to
the study of Kamath et al. (1992), which reported
significant increase in HF component of the power
spectrum.
LF/HF ratio after the implantation of the VNS
stimulation still remains below 1 for most of the
children with refractory epilepsy, meaning that vagal
modulation of the heart rate is still dominant. On the
group level, there are changes in cardiac
sympathovagal balance towards sympathetic
predominance in phase 2 of sleep (p=0.177) and also
during deep sleep (p=0.035) after the VNS
implantation. These findings require further
observations.
In addition, LF/HF and DFA coefficients have
similar pattern of behaviour due to the implantation
of the VNS and compared to the control group. In
other nonlinear parameters, we found no significant
changes due to the implantation of the VNS.
In conclusion, our data indicate that: (a) VNS do
not influence heart rate during phase 2 of sleep and
deep sleep; and (b) VNS affects cardiac
sympathovagal balance.
ACKNOWLEDGEMENTS
Research supported by:
Research Council KUL: GOA Ambiorics, GOA
MaNet, CoE EF/05/006 Optimization in Engineering
(OPTEC), IDO 05/010 EEG-fMRI, IDO 08/013
Autism, IOF-KP06/11 FunCopt; Flemish
Government: FWO: PhD/postdoc grants, G.0302.07
(SVM), G.0341.07 (Data fusion), G.0427.10N
(Integrated EEG-fMRI) research communities
(ICCoS, ANMMM); IWT: TBM070713-Accelero,
TBM070706-IOTA3, TBM080658-MRI (EEG-
fMRI), PhD Grants; Belgian Federal Science Policy
Office: IUAP P6/04 (DYSCO, `Dynamical systems,
control and optimization', 2007-2011); ESA
PRODEX No 90348 (sleep homeostasis); EU: FAST
(FP6-MC-RTN-035801), Neuromath (COST-
BM0601)
REFERENCES
Deng, Z. D., Poon, C. S., Arzeno, N. M., Katz, E. S.,
2006. Heart rate variability in pediatric obstructive
sleep apnea. In Ann. Int. Conf. New Jork City, USA
Kamath, M. V., Upton, A. R. M., Talalla, A., Fallen, E. L.,
1992. Neurocardiac responses to vagaoafferent
electrostimulation in humans. In Pace 15, 1581-1587
Katz, M. J., 1988. Fractals and the analysis of waveforms.
In Comput Biol Med, 18(3):145-56
Kobayashi, M., Musha, T., 1982. 1/f fluctuations of heart
beat period. In IEEE Trans Biomed Eng, 29:456-7
Pagani, M., Montano, N., Porta, A., Milliani, A., Abboud,
F. M., Birkett, C., Somers, V. K., 1997. Relationship
between spectral components of cardiovascular
variabilities and direct measures of muscle
sympathetic nerve activity in humans. In Circulation
95, 1441-1448
Peng, C. K., Havlin, S., Hausdorff, J. M., Mietus, J. M.,
Stanley, H. E., Goldberger, A. L., 1996. Fractal
mechanisms and heart rate dynamics. In J
Electrocardiol, 28(Suppl):59-64
Richman, J. S., Moorman, R. J., 2000. Physiological time-
series analysis using approximate entropy and sample
entropy. In Am J Physiol Heart Circ Physiol,
278:H2039-49
Setty, A. B., Vaughn, B. V., Quint, S. R., Robertson, K.
R., Messenheimer, J. H., 1998. Heart period variability
during vagal nerve stimulation. In Seizure
Task Force of the European Society of Cardiology and the
North American Society of Pacing and
Electrophysiology, 1996. Heart rate variability
standards of measurement, physiological
interpretation and clinical use, 71:1043-65
BIOSIGNALS 2011 - International Conference on Bio-inspired Systems and Signal Processing
412
