
MINIMUM MUTATION ALGORITHM FOR GAPLESS METABOLIC
NETWORK EVOLUTION
Esa Pitk
¨
anen, Juho Rousu
Department of Computer Science, University of Helsinki, P.O. Box 68, FI-00014 Helsingin yliopisto, Finland
Mikko Arvas
VTT Technical Research Centre of Finland, P.O. Box 1000, FI-02044 VTT, Espoo, Finland
Keywords:
Algorithms, Bioinformatics, Evolution, Fungi, Metabolism, Parsimony, Phylogeny, Systems Biology.
Abstract:
We present a method for inferring the structure of ancestral metabolic networks directly from the networks of
observed species and their phylogenetic tree. Our method aims to minimize the number of mutations on the
phylogenetic tree, whilst keeping the ancestral networks structurally feasible, i.e., free of reaction gaps.
To this end, we present a parsimony-based method that generates metabolic network phylogenies where the an-
cestral nodes are required to represent gapless metabolic networks, networks where all reactions are reachable
from external substrates. In particular, we introduce the gapless minimum mutation problem: finding phylo-
genies of gapless metabolic networks when the topology of the phylogenetic tree is given, but the content of
ancestral nodes is unknown.
The gapless minimum mutation problem is shown to be computationally hard to solve even approximatively.
We then propose an efficient dynamic programming based heuristic that combines knowledge on both the
metabolic network topology and phylogeny of species. Specifically, the reconstruction of each ancestral
network is guided by the heuristic to minimize the total phylogeny cost. We experiment by reconstructing
phylogenies generated under a simple random model and derived from KEGG for a number of fungal species.
1 INTRODUCTION
Modelling of metabolism is essential in a variety of
applications of biotechnology and medicine including
bioprocess development (Raman and Chandra, 2009),
study of metabolic diseases (Sigurdsson et al., 2009)
and drug target identification (Jamshidi and Palsson,
2007). Global characteristics of cellular metabolism
by metabolic networks have been studied intensively
by a variety of computational approaches, includ-
ing metabolic reconstruction (see (Pitk
¨
anen et al.,
2010) for a recent survey), metabolic flux analy-
sis (Palsson, 2006), 13C isotopic tracing (Rantanen
et al., 2008) and structural analysis of metabolic net-
works (Lacroix et al., 2008).
The structure of the metabolic network is a major
contributor to the phenotypes that an organism man-
ifests. Metabolic networks have been shown to be
scale free (i.e., the networks contain hub metabolites
of high connectivity) and modular (Kreimer et al.,
2008). The structure is known to constrain the phe-
notypes the network can realize (Palsson, 2006), thus
the structure is also likely to be conserved in evolu-
tion (Wagner, 2009).
Recently, the increasing number of fully se-
quenced genomes has enabled comparative genomics
analysis of metabolic network evolution (for review
see (Caetano-Anoll
´
es et al., 2009)). Many compu-
tational approaches have concentrated on deriving
rigorous measures of biological network and path-
way similarity (Sharan and Ideker, 2006), thus en-
abling construction of phylogenies of networks with
distance-based methods. Particularly methods for
metabolic network and pathway comparison have
been developed (Dandekar et al., 1999; Tohsato et al.,
2000; Clemente et al., 2007; Mano et al., 2010).
Distance-based methods do not immediately yield
predictions on the contents of ancestral networks,
however. Knowledge on ancestral networks is impor-
tant as it may shed light on the evolutionary mecha-
nisms that have generated the observed networks. An
approach complementary to distance-based methods
28
Pitkänen E., Rousu J. and Arvas M..
MINIMUM MUTATION ALGORITHM FOR GAPLESS METABOLIC NETWORK EVOLUTION.
DOI: 10.5220/0003132200280038
In Proceedings of the International Conference on Bioinformatics Models, Methods and Algorithms (BIOINFORMATICS-2011), pages 28-38
ISBN: 978-989-8425-36-2
Copyright
c
2011 SCITEPRESS (Science and Technology Publications, Lda.)

often used to give insight on ancestral node contents
in phylogenetic trees is maximum parsimony, where
one tries to find ancestral objects which minimize the
total number of evolutionary changes required to ex-
plain the observed data. The maximum parsimony
principle has been utilized in many domains, for in-
stance in the analysis of sequence data (Fitch, 1971;
Sankoff, 1975; Clemente et al., 2009; Tuller et al.,
2010) as well as gene regulatory networks (Bourque
and Sankoff, 2004).
A direct application of maximum parsimony
methods to biological network data generally results
in structurally infeasible ancestral networks. For in-
stance, consider the two metabolic networks Y and Z
with a common immediate ancestor X shown in Fig-
ure 1. A parsimonious scenario (top right) includes an
ancestral network where a metabolite is required by
the network but cannot be produced, suggesting that
the pathway m → c cannot operate and the network is
infeasible.
Graph evolution models taking into account de-
pendencies imposed by the network structure have
been proposed. For instance, Mithani et al. gave
a Markov process for simulating metabolic network
evolution under a neighbor dependency model where
appearance of a reaction depends on the fraction
of neighboring reactions already present in the net-
work (Mithani et al., 2009; Mithani et al., 2010).
However, they reported results only for relatively
small metabolic networks.
In this paper, we introduce a computational
method for reconstructing ancestral metabolic net-
works in a given phylogenetic tree. The method com-
bines the maximum parsimony principle with the re-
quirement that the resulting networks are plausible
in terms of network connectivity, thus contributing
towards bridging the gap between the structural and
phylogenetic analysis of metabolic networks. Specif-
ically, our method builds phylogenies of metabolic
networks where the ancestral nodes of the phylogeny
adhere to structural network constraints: The net-
works are required to be free of reaction gaps, that is,
reactions whose substrates cannot be produced from
external metabolites. The choice of external metabo-
lites reflects the estimated metabolic environment:
the organisms are assumed to have them available in
abundance and possess the necessary transports. To
this purpose, computational methods have been de-
veloped to identify a set of minimal nutrients, given
metabolic network structure (Handorf et al., 2008;
Borenstein et al., 2008).
In section 2, we formulate the gapless minimum
mutation problem where the topology of the phyloge-
netic tree is taken as input and the problem is to infer
the structure of the ancestral networks so that the to-
tal phylogeny cost is minimized. We show the prob-
lem to be computationally hard to even approximate
and go on to propose an efficient heuristic algorithm,
which solves the problem well in practise. In section
3, we experiment with the algorithm in two scenarios:
First, we analyze randomly generated and perturbed
data. Second, we study gapless phylogeny reconstruc-
tion for a collection of fungal species. Section 4 ends
the paper with conclusions.
2 METHODS
We are interested in metabolic networks that are func-
tional in the sense that the network is able to produce
substrates of all its reactions from some given set of
source metabolites. Such networks are termed gap-
less, with a precise definition given below.
A metabolic network can be described as a binary
string N ∈ {0,1}
m
, where each N
i
= 1 states that the
reaction r
i
, drawn from a collection of reactions R ,
is in the network. We use the shorthand r
i
∈ N when
N
i
= 1. Further we assume a set of metabolites M is
consumed and produced by the m reactions. The set
of substrate and product metabolites of a reaction r
i
are given by S(r
i
) ⊂ M and P(r
i
) ⊂ M , respectively.
To see how a string N encodes metabolic net-
work connectivity, note that N induces a directed bi-
partite graph G(N) = (V, E), with a node v
r
∈ V for
each reaction r ∈ N. Additionally each metabolite
b ∈ S(r
i
) ∪ P(r
i
) for every r
i
∈ N contributes a node
v
b
∈ V . Edges (v
r
,v
b
) ∈ E and (v
b
,v
r
) ∈ E are added
whenever reaction r produces or consumes metabo-
lite b, respectively. Figure 2 shows this graph rep-
resentation implicitly encoded by a string N for five
reactions.
We first define gaplessness in terms of reactions
that are reachable from a set of source metabolites
S (Pitk
¨
anen et al., 2005).
Definition 2.1. Let N be a metabolic network and S ⊆
M be a set of source metabolites.
• A reaction r ∈ N is reachable from S in N if all its
substrates S(r) are reachable from S in N.
• A metabolite b ∈ M is reachable from S in N if
either b ∈ S or b ∈ P(r) for some reaction r ∈ N
that is reachable from S in N.
A gapless metabolic network N under S is a metabolic
network where all reactions are reachable from S in
N.
We often omit an explicit mention of the source
set S if it is clear in the context, saying only that a
metabolic network is gapless. If a reaction r ∈ N is
MINIMUM MUTATION ALGORITHM FOR GAPLESS METABOLIC NETWORK EVOLUTION
29

X
Y Z
a
m
Y
b
Z
c
X,Y,Z
a
m
X,Y
b
X,Z
c
X,Y,Z
Figure 1: Left: a small example phylogeny for three metabolic networks X,Y,Z. Right: two parsimonious scenarios involving
metabolic pathways a → m, b → m and m → c. Metabolites and pathways are shown as circles and arrows, respectively.
Pathways are labeled with organisms which have the pathway. In upper scenario, only pathway m → c is assigned to ancestor
X, thus leaving metabolite m without a producing pathway. In lower scenario, both pathways from Y and Z are assigned to X.
not reachable from S, we say that r is a reaction gap
(under S). In addition, we say that a metabolic net-
work is gapped, if it contains at least one reaction gap.
Figure 2 illustrates these concepts.
2.1 Gapless Minimum Mutation
Problem
We next introduce the computational problem of find-
ing a gapless phylogeny when the tree topology and
input taxa are given.
Problem 2.2. Gapless Minimum Mutation problem
(GMM). Given a reaction collection R , m = |R |, a
rooted binary tree T = (V, E), labeling L(u) ∈ {0,1}
m
specifying a metabolic network for each leaf node and
source metabolites S, find a labeling for each internal
node of T such that
(1) c =
∑
(u,v)∈E
d(L(u),L(v)) is minimized and
(2) L(u) is a gapless metabolic network under S for
each internal node u ∈ V ,
where d is Hamming distance.
The equivalent problem defined for binary strings
without the gapless constraint (2), Minimum Muta-
tion problem, can be solved in polynomial time with
the Fitch algorithm because each character position
can be solved independently of each other (Fitch,
1971; Gusfield, 1997). However, in contrast to the
Minimum Mutation problem, the character positions
in GMM are not necessarily independent of each
other: setting a certain L
i
(u) ∈ {0, 1} may impose
constraints on other positions j 6= i due to the gapless
constraint. Note that the taxa contained in the leaves
may or may not correspond to gapless metabolic net-
works.
Theorem 2.3. Deciding whether a solution with cost
c ≤ k to Gapless Minimum Mutation problem exists
given k ∈ N is NP-complete.
Proof. Given a solution to GMM, we can both com-
pute the cost c and check that each network L(u) is
gapless in polynomial time (Pitk
¨
anen et al., 2005),
hence the problem is in NP.
To show that the problem is NP-hard, we reduce
the well-known NP-complete Minimum Set Cover
problem (Garey and Johnson, 1979) to Gapless Min-
imum Mutation problem. Let X be a finite set and C
be a collection of subsets of the set X. In the Mini-
mum Set Cover problem, we ask for the smallest sub-
set C
0
⊆ C such that every element of X belongs to
at least one member of C
0
. To create an instance of
GMM, we first set up a reaction collection R with two
groups of reactions, one group for items in X, another
for sets in C. Specifically, let R to contain a reaction
r
i
for each x
i
∈ X with S(r
i
) = {b
i
} and P(r
i
) = {c
i
},
and a reaction q
j
for each c
j
∈ C with S(q
j
) = {a
j
}
and P(q
j
) = {b
i
|x
i
∈ c
j
}. In addition, let R contain a
reaction x with S(x) = {c
i
|x
i
∈ X} and P(x) = {m}.
To set up a phylogenetic tree, let T = (V, E)
be a binary rooted tree with V = {v
1
,v
2
,v
3
}, E =
{(v
3
,v
1
),(v
3
,v
2
)} and root v
3
. Finally, let input
metabolic networks at leaves be L(v
1
) = L(v
2
) =
{r
i
|x
i
∈ X} ∪ {x} and the set of source metabolites
BIOINFORMATICS 2011 - International Conference on Bioinformatics Models, Methods and Algorithms
30

r
4
r
5
r
1
r
2
r
3
m
10
m
5
m
4
m
7
m
6
m
1
m
3
m
2
m
9
m
8
Figure 2: Example metabolic network with reactions N = {r
1
,. .. ,r
5
} and metabolites {m
1
,. .. ,m
10
}. When S = {m
1
,m
2
}
(double circles), reactions r
4
and r
5
(dotted rectangles) are reaction gaps in N. However, the network N under S
0
=
{m
1
,m
2
,m
6
} would be gapless, because then reaction r
4
would be reachable. On the other hand, N
0
= {r
1
,r
2
,r
3
} is gap-
less under S = {m
1
,m
2
}.
be S = {a
j
|c
j
∈ C}.
A minimal solution to GMM will contain at node
v
3
a network with r
i
and x, and a minimal number of
reactions q
j
to make L(v
3
) gapless. Existence of x
will ensure that L(v
3
) 6=
/
0 when |C| = |X|. To trans-
form a solution to GMM back to a solution to Min-
imum Set Cover, let set C
0
contain c
i
for each q
i
as-
signed to node v
3
. The reduction can be done in poly-
nomial time. In reduction, each reaction q
i
is assigned
to v
3
if and only if c
i
appears in the optimal solution,
assuming without loss of generality a unique set cover
solution. If there is no solution to the set cover in-
stance, also GMM is unsolvable as it is not possible to
fix L(v
3
) to be gapless. Figure 3 shows the reduction
from an example set cover instance X = {x
1
,.. .,x
5
}
and c
1
= {x
1
,x
2
,x
3
},c
2
= {x
1
,x
2
,x
4
},c
3
= {x
3
,x
5
}.
Since the problem is both in NP and NP-hard, the
claim follows.
Theorem 2.4. Gapless Minimum Mutation cannot be
efficiently α-approximated unless P = NP.
Proof. We show next that the reduction described
above is actually an approximation-ratio preserving
reduction and we can thus exploit the inapproxima-
bility of the set cover problem. Set cover problem has
been shown to be hard to approximate within a log-
arithmic factor unless P = NP (Raz and Safra, 1997;
Alon et al., 2006).
Assume that there is an α-approximation algo-
rithm for GMM for some α > 1. We can thus obtain
a solution of cost ≤ αOPT where OPT is an opti-
mal solution cost of GMM. Given a set cover instance
with optimal size k, we obtain a GMM instance of
optimal cost 2k in polynomial time with the above re-
duction. Solving the instance approximatively we get
a solution of cost at most 2αk. This yields an approx-
imative solution
ˆ
k ≤ αk to the set cover problem, thus
contradicting the assumption.
Often we have gapped metabolic networks as taxa
to begin with. For instance, initial networks may be a
result of function assignment by annotation transfer,
where the resulting structure of the draft metabolic
network is not of concern. However, these networks
should also be functional and therefore we can at-
tempt to fix them gapless while finding ancestral
nodes. To do this, we can extend the tree T such
that for each leaf u we add an edge (u, u
0
) and as-
sign L(u
0
) ← L(u). Solving GMM in the modified tree
thus finds a solution where nodes u
0
retain the origi-
nal input networks but gaps in internal nodes u are
fixed. We provide an example of such situation in ex-
periments, where we utilize gapped networks derived
from a metabolic database.
2.2 Local Adjustment Algorithm
To overcome the computational complexity, we next
propose an algorithm that solves the Gapless Mini-
mum Mutation problem in two phases. In the first
phase, the assignments corresponding to the mini-
mum mutation cost are computed with the Fitch al-
gorithm (Fitch, 1971; Gusfield, 1997). In the second
phase, the tree is traversed top-down and a gapless
metabolic network is assigned at each node by fill-
ing the gaps remaining after the Fitch pass. The al-
gorithm relies on estimates on how much filling each
gap would increase the total phylogeny cost, and at-
tempts to choose gap-filling reactions which increase
the cost as little as possible. The cost increase esti-
mates are computed by the algorithm for each ances-
tral network.
MINIMUM MUTATION ALGORITHM FOR GAPLESS METABOLIC NETWORK EVOLUTION
31

b
4
b
5
b
2
b
3
b
1
c
4
c
5
c
2
c
3
c
1
a
3
a
2
a
1
m
r
1
r
3
r
2
r
5
r
4
x
q
1
q
2
q
3
v
1
v
2
v
3
Figure 3: Example reduction of a Minimum Set Cover instance with X = {x
1
,. .. ,x
5
} and c
1
= {x
1
,x
2
,x
3
},c
2
= {x
1
,x
2
,x
4
}
and c
3
= {x
3
,x
5
} to Gapless Minimum Mutation problem. Left: reactions in R . Right: tree T .
Algorithm 1: GaplessMinimumMutation: Local adjust-
ment algorithm for gapless minimum mutation.
1: Input: tree T , taxa L
2: F ← Fitch(T, L)
3: for all internal nodes v in top-down order do
4: if v is root then
5: for all i ∈ {1,... , m} do
6: L
i
(v) ← 0 if 0 ∈ F
i
(v); otherwise L
i
(v) ←
1
7: else
8: for all i ∈ {1,... , m} do
9: if F
i
(v) = {0,1} then
10: L
i
(v) ← L
i
(pa(v))
11: else
12: L
i
(v) ← 0 if 0 ∈ F
i
(v); otherwise
L
i
(v) ← 1
13: (D,M) ← MinDist(v,S)
14: L(v) ← L(v) ∪MinFill(v,S,D,M)
In Algorithm 1 at line 2, we first compute equal-
ity sets F
i
(v) ⊆ {0,1} for each internal node v and
position i with the Fitch algorithm. In a binary tree,
equality set F
i
(v) is defined for each position i as
F
i
(v) =
{L
i
(v)} iff v is leaf
F
i
(x) ∩ F
i
(y) iff v isnot leaf and F
i
(x) ∩ F
i
(y) 6=
/
0
F
i
(x) ∪ F
i
(y) iff v isnot leaf and F
i
(x) ∩ F
i
(y) =
/
0
,
where x and y are the children of an internal node
v (Gusfield, 1997).
The tree is traversed in a top-down pass and an
initial labeling L(v) is decided according to the Fitch
top-down phase (Algorithm 1, lines 3–12). Each ini-
tial labeling is then adjusted so that it satisfies the gap-
lessness constraint.
For each internal node v, the algorithm calls the
subroutine MinFill, which returns a gapless network
containing L(v) and gapfill reactions (Algorithm 2).
Particularly, if L(v) is already gapless, it is returned as
such. MinFill attempts to satisfy the gaplessness cri-
terion by backtracking from each reaction not reach-
able from sources S in network L(v) and iteratively
adding reactions to the fill set Γ. Subprocedure termi-
nates when either all reactions have been reached or
the algorithm notices that all gaps cannot be filled.
A heuristic is used to guide the backtracking phase
by considering reaction assignments in the parent and
child nodes. In particular, the algorithm attempts to
choose reactions to the fill set Γ such that the par-
simony cost increase is minimized. To do this, we
first compute distances d
f
that provide an estimate
for each reaction how much the parsimony cost will
increase compared to the optimal Minimum Mutation
solution, if the reaction is added to the network. For-
mally, the distance d
f
is a lower bound to the increase
in parsimony cost that is the result of adding reaction
r
i
and other reactions required to make r reachable to
v:
d
f
(v,r
i
) = max
m∈S(r
i
)
min
q∈Pr(m)
d
f
(v,q) + d
δ
(v,r
i
)
where S(r
i
) are the substrates of reaction r
i
and Pr(m)
are the reactions producing m. To introduce some
notation, let G
i
(w,v) = {L
i
(w)} iff pa(v) = w and
BIOINFORMATICS 2011 - International Conference on Bioinformatics Models, Methods and Algorithms
32

G
i
(w,v) = F
i
(w) iff w ∈ ch(v), where the parent and
children of v are denoted by pa(v) and ch(v), re-
spectively. Cost function d
δ
(v,r
i
) specifies the in-
crease in parsimony cost when adding reaction r
i
only and is defined as d
δ
(v,r
i
) = δ(v, pa(v),r
i
) +
∑
c∈ch(v)
δ(v,c,r
i
) with
δ(v,w,r
i
) =
1 ifG
i
(w,v) = {0} and L
i
(v) = 0
−1 if G
i
(w,v) = {1} and L
i
(v) = 0
0 ifG
i
(w,v) = {0, 1} and L
i
(v) = 0
0 ifL
i
(v) = 1
Note that at root v, we set δ(v, pa(v)) = 0.
Parsimony cost increase d
δ
at each reaction is al-
ways non-negative. To see this, we can enumerate the
values for d
δ
at an internal node given G
i
at parent and
children (Table 1). Symmetric cases are omitted from
the table, where a boldface 0 signifies that this combi-
nation would yield L
i
(v) = 1 in the bottom-up phase
of the algorithm and thus the reaction would already
be in the network.
Subroutine MinDist is called from Algorithm 1 to
compute distances d
f
for all r with dynamic program-
ming (Algorithm 3). If for some required substrate
there are only producers r
i
that have d
f
(v,r
i
) = ∞,
the algorithm fails as the required substrate cannot
be reached from S. In such cases, source set S needs
to be expanded or reaction collection R revised. To
avoid loops, ε > 0 is added to distances d
f
, ensur-
ing that distances strictly increase when traversing the
network.
Algorithm 2: MinFill.
1: Input: v,S,D,M
2: Γ ←
/
0; Q ← {r ∈ v |D(r) = ∞}
3: while |Q| > 0 do
4: r ← pop(Q)
5: for all o ∈ S(r) do
6: if o /∈ M then
7: q ← argmin
q∈Pr(o)
D(q)
8: if D(q) = ∞ then
9: return “Impossible to find gapfilling
set”
10: if q /∈ Γ and q /∈ v then
11: push(Q,q)
12: Γ ← Γ ∪{r}
13: Return Γ
Theorem 2.5. Local adjustment algorithm returns
gapless metabolic networks L(u) for each internal
node u or reports failure in O(nmlog m) time, where
n is the number of species and m = |R | is the number
of reactions.
Proof. As each reaction is inserted at most once to
the heap, Algorithm 3 takes O(m log m) time to com-
pute distances d
f
assuming that both heap operations
Algorithm 3: MinDist: compute distances d
f
(v,S).
1: Input: v,S
2: M ← S; Q ← min-heap
3: for all r ∈ {r ∈ R |S(r) ⊆ S} do
4: insert(Q,r,0)
5: for all r ∈ R do
6: D(r) ← 0 if r ∈ Q; D(r) ← ∞ otherwise
7: while |Q| > 0 do
8: r ← extract-min(Q)
9: for all o ∈ P(r) do
10: if o /∈ M then
11: M ← M ∪ {o}
12: for all q ∈ {q ∈ R | D(q) = ∞∧S(q) ⊆ M}
do
13: D(q) ← D(r) + δ
f
(v,q) + ε
14: insert(Q, q, D(q))
15: return (D,M)
insert and extract-min take O(logm) time. Fur-
ther we assume that |P(r)| is bound by a constant,
which is reasonable as typically in enzymatic reac-
tions |P(r)| = 1,.. .,3. In Algorithm 2 each reaction
is inserted at most once to the queue Q, hence the
subroutine takes O(m) time. Algorithm 1 makes a
single call to subroutine Fitch which takes O(nm)
time. Loop at line 11 is executed also O(nm) times.
The time complexity of the algorithm is dominated
by the O(n) calls to Algorithm 2, resulting in total
O(nmlogm) time. Figure 4 illustrates the operation
of the algorithm.
Note that it is possible to have an instance of
GMM where the algorithm fails to find a gapless so-
lution although such solution exists. As an example,
consider two networks with a single reaction L(v
1
) =
L(v
2
) = {r}, where S(r) = {m
1
},P(r) = {m
2
} and
S =
/
0, and the tree of Figure 3. Then, the optimal
solution is L(v
3
) =
/
0. However, as the algorithm does
not attempt to remove reactions from the initial Fitch
solution L(v
3
) = {r}, the network remains gapless.
Such cases are avoided by carefully selecting the re-
action collection and source metabolites. In practice,
one must ensure that the source metabolite set is large
enough for each reaction to be reachable in network
L(u) = R .
3 EXPERIMENTS
We experimented with two datasets. First, we
generated random phylogenies consisting of gap-
less metabolic networks under a simple model of
metabolic network evolution. Second, we derived
MINIMUM MUTATION ALGORITHM FOR GAPLESS METABOLIC NETWORK EVOLUTION
33
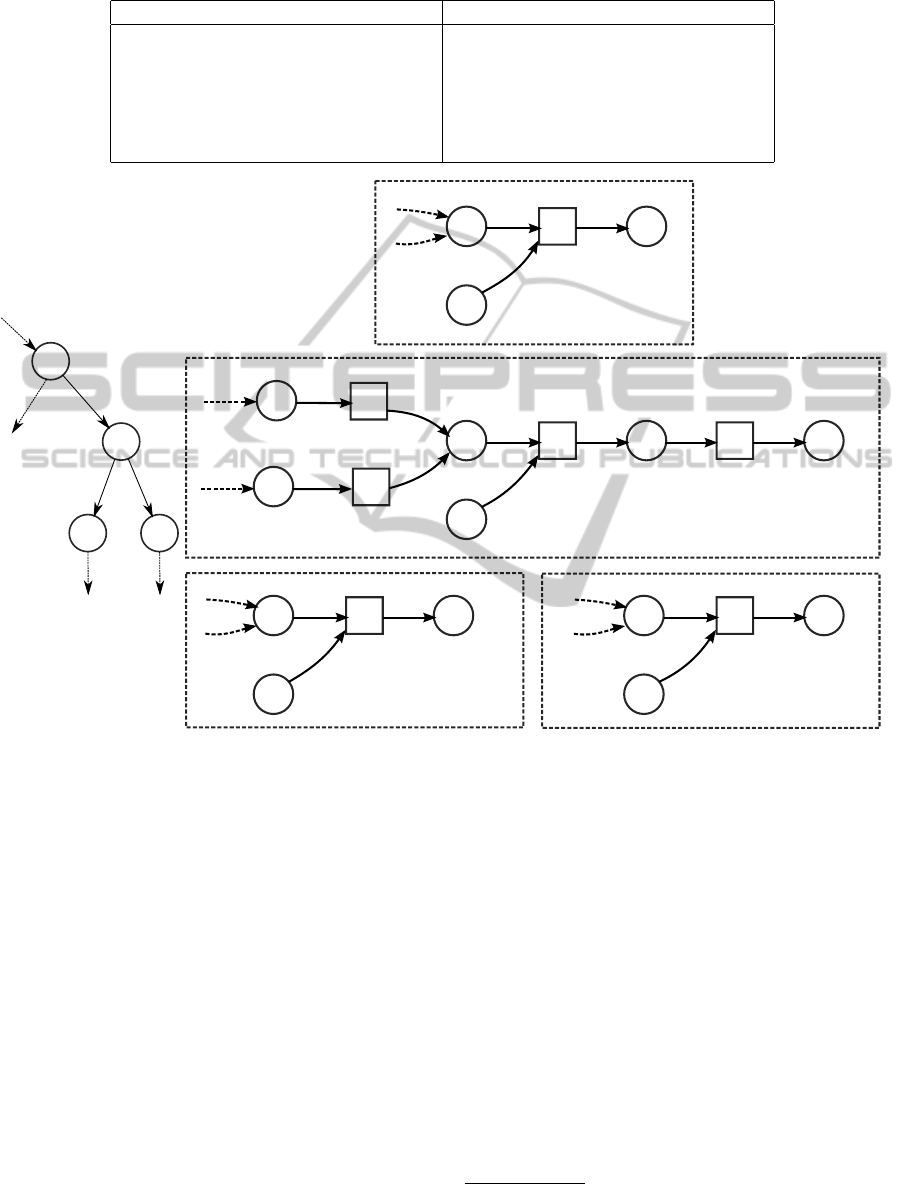
Table 1: Values of heuristic d
δ
for different parent and children assignments.
Parent Left child Right child d
δ
Parent Left child Right child d
δ
0 0 0 3 1 0 0 1
0 0 1 1 1 0 1 0
0 0 0,1 2 1 0 0,1 0
0 1 1 0 1 1 1 0
0 1 0,1 0 1 1 0,1 0
0 0,1 0,1 1 1 0,1 0,1 0
u
v
x
y
r
1
r
2
r
4
m
1
m
2
r
3
m
3
m
4
m
5
m
6
r
3
m
3
m
4
m
5
r
3
m
3
m
4
m
5
r
3
m
3
m
4
m
5
x
y
v
u
0,1
0
1
0
1
0
0
2
4
3 3
Figure 4: Operation of Algorithm 1 to solve the Gapless Minimum Mutation problem. Left: A part of a phylogenetic tree.
Right: Subnetworks of nodes u,v,x, y. State at node v after a call to MinDist: example values of d
f
and reaction assignments
shown at bottom right corner and on top of each reaction of v, respectively. Metabolite m
4
assumed to be a source. Dashed
edges indicate parts of networks not shown. Distances for r
3
: d
δ
(r
3
,v) = d
δ
(r
3
,u) + d
δ
(r
3
,x) +d
δ
(r
3
,y) = 1 − 1 + 1 = 1 and
thus d
f
(r
3
,v) = max(min(d
f
(r
1
,v), d
f
(r
2
,v)), 0) + d
δ
(r
3
,v) = max(min(2,4), 0) + 1 = 2 + 1 = 3.
metabolic networks for 16 fungal species from the
KEGG database (Kanehisa et al., 2008). We then
solved the Gapless Minimum Mutation problem for
both datasets.
3.1 Random Phylogenies
To generate a phylogenetic tree, we first started with
a gapless network containing 300 random reactions
from KEGG and then simulated evolution by ran-
domly adding or removing one reaction at time. Only
additions and deletions, or reaction flips, that pre-
served gaplessness were allowed. Probability of both
the addition and deletion was 0.5. The reaction to be
added or deleted was chosen uniformly from the set of
reactions whose addition or deletion preserved gap-
lessness. After each flip, a speciation event occured
at a fixed probability 0.005 resulting in a new branch
in the phylogenetic tree. The process was terminated
after a tree of 30 nodes was generated resulting in net-
works of 249 ± 22 reactions at each node
1
.
The generated taxa were reconstructed by the
Fitch algorithm and Algorithm 1. Prior to recon-
struction, the input taxa were randomly perturbed to
simulate effects of annotation errors. Specifically,
each reaction present in the taxa was deleted with
the probability p
d
= 0,0.01, 0.02, 0.05,0.1. Table 2
1
We use the ± notation to indicate standard deviations.
BIOINFORMATICS 2011 - International Conference on Bioinformatics Models, Methods and Algorithms
34

Table 2: Reconstructing random phylogenies when errors were introduced to data by deleting reactions from taxa with a
fixed probability p
d
. Columns FitchError and GaplessError give the reconstruction error measured as the average Hamming
distance between reconstructed network and generating taxa at an internal node. Columns Gaps and Fills show the average
number of gapped reactions and gapfill reactions added by our algorithm. Results are averages over 25 repeats. Standard
deviations given in parentheses.
p
d
FitchError GaplessError Gaps Fills
0.0 52.3 (4.12) 50.3 (3.80) 0.18 (0.11) 0.15 (0.09)
0.005 53.3 (3.49) 51.2 (3.47) 0.35 (0.22) 0.24 (0.14)
0.01 54.8 (3.93) 52.4 (4.09) 0.55 (0.21) 0.35 (0.13)
0.02 57.3 (4.84) 54.9 (4.60) 0.94 (0.35) 0.59 (0.20)
0.05 63.3 (4.06) 60.3 (4.04) 1.82 (0.60) 1.11 (0.27)
0.1 76.5 (4.14) 73.2 (4.00) 3.65 (1.00) 2.37 (0.53)
Table 3: Species in fungal dataset. Columns Reactions, Gaps and Fills give the number of all reactions and gapped reactions
in the initial networks, and reactions added by the algorithm to fill gaps, respectively.
Abbr Species Reactions Gaps Fills
ago Ashbya gossypii 272 64 (23.5%) 37 (+13.6%)
afm Aspergillus fumigatus 468 80 (17.1%) 50 (+10.7%)
ani Aspergillus nidulans 382 74 (19.4%) 42 (+11.0%)
aor Aspergillus oryzae 396 70 (17.7%) 42 (+10.6%)
cgr Candida glabrata 270 70 (25.9%) 35 (+13.0%)
cne Cryptococcus neoformans 336 68 (20.2%) 35 (+10.4%)
dha Debaryomyces hansenii 326 66 (20.2%) 34 (+10.4%)
fgr Fusarium graminearum 474 86 (18.1%) 43 (+9.1%)
kla Kluyveromyces lactis 292 68 (23.3%) 36 (+12.3%)
mgr Magnaporthe grisea 390 74 (19.0%) 41 (+10.5%)
ncr Neurospora crassa 416 74 (17.8%) 38 (+9.1%)
dpch Phanerochaete chrysosporium 410 90 (22.0%) 44 (+10.7%)
sce Saccharomyces cerevisiae 332 80 (24.1%) 36 (+10.8%)
spo Schizosaccharomyces pombe 278 68 (24.5%) 35 (+12.6%)
uma Ustilago maydis 296 76 (25.7%) 47 (+15.9%)
yli Yarrowia lipolytica 362 92 (25.4%) 43 (+11.9%)
shows the reconstruction error measured as the av-
erage Hamming distance between node labels in re-
construction and generating taxa. Further, the aver-
age number of gapped and gapfill reactions at each
node are shown. For instance, with random deletion
probability p
d
= 0.1, the reconstruction errors mea-
sured, 76.5 and 73.2 for Fitch’s and our algorithm, re-
spectively, were statistically different from each other
(paired t(48) = 2.87, p = 0.006). Moreover, the simu-
lated trees contained on the average 3.65 gaps in each
network. Our algorithm added 2.37 gap-filling reac-
tions to each network on the average. Regardless of
parameter p
d
, gapless reconstruction of each instance
took about 27 seconds on a standard desktop com-
puter running a Python implementation our algorithm.
3.2 Fungal Phylogenies
To experiment with a more real-world scenario, we
constructed metabolic networks for 16 fungal species
corresponding to 17 carbohydrate metabolism path-
ways (Kanehisa et al., 2008) from KEGG gene-
reaction links. As shown in Table 3, the process re-
sulted in a high number of gapped reactions in these
initial networks largely due to incomplete annotations
and stoichiometry in KEGG enzymes and reactions.
As input, we provided our algorithm with the
initial networks and a phylogenetic tree of the
species ((Fitzpatrick et al., 2006), Figure 5). Because
we had gapped networks to begin with, we added a
new internal node for each species and an edge to the
node as described earlier.
Many microorganisms and free living fungi in par-
ticular can synthesize all their cellular components
from inorganic sources, given a source of energy and
MINIMUM MUTATION ALGORITHM FOR GAPLESS METABOLIC NETWORK EVOLUTION
35
afm
ani
uma
dpch
cne
spo
aor
dha
ncr
mgr
yli
sce
cgr
fgr
ago
kla
N22
N1
N4
N5
N7
N8
N11
N13
N25
N14
N15
N17
N18
N20
N21
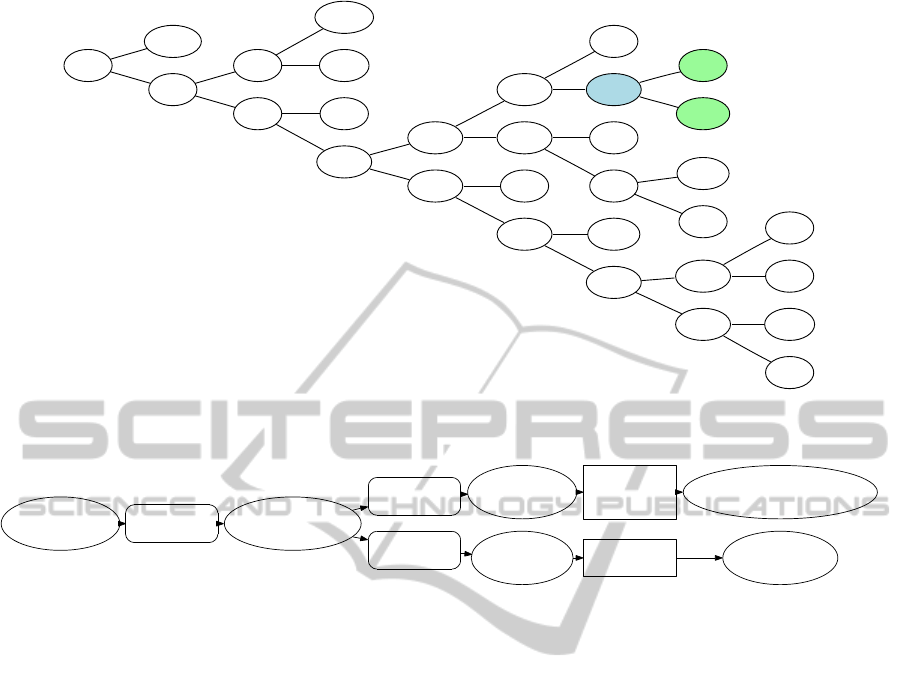
Figure 5: A phylogeny tree for the 16 fungal species rooted at node N4. Shaded nodes indicate the two species and their
immediate ancestor N22 highlighted in Figure 6.
C00137
myo-Inositol
R01184 (d=1)
EC 1.3.99.1
C00191
D-Glucuronate
R01481 (d=2)
EC 1.1.1.19
R01483 (d=2)
EC 3.1.1.19
C00800
L-Gulonate
R02933 (d=2)
EC 3.1.1.17
EC 3.1.1.25
C02670
Glucurone
R02957 (d=2)
EC 1.2.1.3
C01040
L-Gulono-1,4-lactone
C00818
D-Glucarate
Figure 6: A subnetwork of the metabolic network reconstructed at node N22 of the phylogenetic tree shown in Figure 5.
Reactions and metabolites are drawn as rectangles and ellipses, respectively. Rounded rectangles show the three reactions
added by the algorithm to fill the gapped reactions R02933 and R02957. Distances d
f
given in parentheses as d.
carbon such as glucose (Deacon, 2006). However,
many fungi require one or more vitamins such as thi-
amine or biotin. To model the fungal metabolic envi-
ronment, a fixed set of 1518 source metabolites were
used containing fungal energy and carbon sources, co-
factors such as ATP and NAD and metabolites needed
to account for the large number of otherwise isolated
subgraphs in the KEGG universal metabolic network.
Table 3 lists the number of reactions added to fill
gaps in the internal nodes corresponding to species.
On the average, 39.4 ± 3.9 reactions were used to fill
72.5 ± 7.0 gaps divided into 7.2 ± 0.9 graph compo-
nents at each node. The optimal minimum mutation
cost was 1082; our algorithm achieved gapless mini-
mum mutation cost of 1789.
To give an example of how the GMM result can
provide insight into metabolic network evolution and
aid reconstruction curation efforts, Figure 6 shows
five reactions from the internal node N22 that is the
parent of species nodes mgr and ncr (Figure 5). Two
reactions (KEGG ids R02933 and R02957) remained
gapped after the first pass. Three reactions were pre-
dicted by the algorithm to fill these particular gaps
(R01184, R01481, R01483). All filling reactions
were used in parent but were absent from children,
thus addition of each reaction increased the parsi-
mony cost by one.
Even though KEGG reaction-gene links were
missing for reactions R01184 and R01481, algo-
rithm predictions were supported by homologous
genes (Arvas et al., 2007) found for both reactions
in M. grisea. Further, a homologous gene was found
also in N. crassa for reaction R01184. No gene was
found to support the predicted existence of reaction
R01483, warranting further study. For the two gapped
reactions, homologues were found in both organisms,
supporting KEGG data.
4 CONCLUSIONS
In this paper, we introduced a maximum parsi-
mony algorithm for reconstructing gapless ancestral
metabolic networks for a given phylogenetic tree.
Furthermore, the method can be used to suggest gap-
less variants of draft metabolic networks of observed
species given as input. The algorithm minimizes the
number of mutations in the phylogenetic tree while
BIOINFORMATICS 2011 - International Conference on Bioinformatics Models, Methods and Algorithms
36

maintaining the gaplessness of the ancestral networks.
Thus, the algorithm can be used both to elucidate net-
work structures in ancestral nodes and to fill in gaps
in draft metabolic networks in a evolutionarily plausi-
ble manner.
We argue that such approach, where the recon-
struction networks are required to be gapless, im-
proves prediction performance over the unconstrained
case. This work extends the method of (Pitk
¨
anen
et al., 2008), where gapless reconstructions of in-
dividual metabolic networks were inferred from se-
quence data, to take into account the phylogenetic
context of the reconstructed network.
The proposed algorithm was found to perform
well in practice despite the computational complexity
of the underlying problem. In experiments with ran-
dom data, the algorithm was able to recover the orig-
inal data from perturbed input more accurately than
the baseline method that did not enforce gaplessness
in reconstructed networks. Moreover, the algorithm
yielded explanations to the question why a given re-
action (enzyme) appears in an ancestral network by
suggesting the required reactions that render the reac-
tion gapless. This is especially important when we at-
tempt to uncover the evolutionary history leading into
observed networks.
While we experimented only with a simple ran-
dom model of evolution, the framework introduced
here lends itself to more realistic models.
Exploring this direction is left as future work,
though we note the importance of incorporat-
ing sequence data with the joint metabolic net-
work/phylogenetic tree topology driven approach pre-
sented here. To this end, dealing with inaccuracies
and omissions in the underlying metabolic reaction
databases presents an additional challenge.
ACKNOWLEDGEMENTS
We would like to thank Pasi Rastas and Esko Ukko-
nen for insightful discussions. This work was finan-
cially supported by Academy of Finland grant 118653
(ALGODAN), in part by the IST Programme of the
European Community, under the PASCAL2 Network
of Excellence, ICT-216886-PASCAL2, and by the
Academy of Finland postdoctoral researcher’s fellow-
ship 127715 (as part of the Finnish Centre of Ex-
cellence in White Biotechnology - Green Chemistry,
Project No. 118573). This publication only reflects
the authors’ views.
REFERENCES
Alon, N., Moshkovitz, D., and Safra, S. (2006). Algorith-
mic construction of sets for k-restrictions. ACM Trans.
Algorithms, 2(2):153–177.
Arvas, M., Kivioja, T., Mitchell, A., Saloheimo, M., Ussery,
D., Penttil
¨
a, M., and Oliver, S. (2007). Comparison of
protein coding gene contents of the fungal phyla Pez-
izomycotina and Saccharomycotina. BMC Genomics,
8(1):325.
Borenstein, E., Kupiec, M., Feldman, M. W., and Rup-
pin, E. (2008). Large-scale reconstruction and phy-
logenetic analysis of metabolic environments. PNAS,
105(38):14482–14487.
Bourque, G. and Sankoff, D. (2004). Improving gene net-
work inference by comparing expression time-series
across species, developmental stages or tissues. J
Bioinform Comput Biol, 2(4):765–783.
Caetano-Anoll
´
es, G., Yafremava, L., Gee, H., Caetano-
Anoll
´
es, D., Kim, H., and Mittenthal, J. (2009). The
origin and evolution of modern metabolism. The In-
ternational Journal of Biochemistry & Cell Biology,
41(2):285–297.
Clemente, J., Satou, K., and Valiente, G. (2007). Phyloge-
netic reconstruction from non-genomic data. Bioin-
formatics, 23(2):e110.
Clemente, J. C., Ikeo, K., Valiente, G., and Gojobori, T.
(2009). Optimized ancestral state reconstruction using
sankoff parsimony. BMC Bioinformatics, 10(51).
Dandekar, T., Schuster, S., Snel, B., Huynen, M., and Bork,
P. (1999). Pathway alignment: application to the com-
parative analysis of glycolytic enzymes. Biochem J.,
343(Pt 1):115–124.
Deacon, J. (2006). Fungal biology. Wiley-Blackwell.
Fitch, W. M. (1971). Toward defining the course of evo-
lution: minimum change for a specific tree topology.
Syst. Zool., 20:406–416.
Fitzpatrick, D., Logue, M., Stajich, J., and Butler, G.
(2006). A fungal phylogeny based on 42 complete
genomes derived from supertree and combined gene
analysis. BMC Evolutionary Biology, 6(1):99.
Garey, M. R. and Johnson, D. S. (1979). Computers
and Intractability: A Guide to the Theory of NP-
Completeness. W. H. Freeman.
Gusfield, D. (1997). Algorithms on Strings, Trees, and Se-
quences. Cambridge University Press.
Handorf, T., Christian, N., Ebenh
¨
oh, O., and Kahn, D.
(2008). An environmental perspective on metabolism.
Journal of Theoretical Biology, 252(3):530–537.
Jamshidi, N. and Palsson, B. O. (2007). Investigating the
metabolic capabilities of Mycobacterium tuberculosis
H37Rv using the in silico strain iNJ661 and proposing
alternative drug targets. BMC Systems Biology, 1(26).
Kanehisa, M., Araki, M., Goto, S., Hattori, M., Hirakawa,
M., Itoh, M., Katayama, T., Kawashima, S., Okuda,
S., Tokimatsu, T., and Yamanishi, Y. (2008). Kegg for
linking genomes to life and the environment. Nucleic
Acids Res., 36:D480–D484.
MINIMUM MUTATION ALGORITHM FOR GAPLESS METABOLIC NETWORK EVOLUTION
37

Kreimer, A., Borenstein, E., Gophna, U., and Ruppin,
E. (2008). The evolution of modularity in bacte-
rial metabolic networks. Proceedings of the National
Academy of Sciences, 105(19):6976.
Lacroix, V., Cottret, L., Thebault, P., and Sagot, M.-F.
(2008). An introduction to metabolic networks and
their structural analysis. IEEE Transactions on Com-
putational Biology and Bioinformatics, 5(4):594–617.
Mano, A., Tuller, T., Bj, O., and Pinter, R. Y. (2010). Com-
parative classification of species and the study of path-
way evolution based on the alignment of metabolic
pathways. BMC Bioinformatics, 11(Suppl 1):S38.
Mithani, A., Preston, G., and Hein, J. (2010). A bayesian
approach to the evolution of metabolic networks on a
phylogeny. PLoS Computational Biology, 6(8).
Mithani, A., Preston, G. M., and Hein, J. (2009). A stochas-
tic model for the evolution of metabolic networks with
neighbor dependence. Bioinformatics, 25(12):1528–
1535.
Palsson, B. (2006). Systems biology: properties of recon-
structed networks. Cambridge University Press Cam-
bridge.
Pitk
¨
anen, E., Rantanen, A., Rousu, J., and Ukkonen, E.
(2005). Finding feasible pathways in metabolic net-
works. In Advances in Informatics: 10th Panhellenic
Conference on Informatics (PCI 2005). Lecture Notes
in Computer Science 3746, pages 123–133.
Pitk
¨
anen, E., Rantanen, A., Rousu, J., and Ukkonen, E.
(2008). A computational method for reconstructing
gapless metabolic networks. In Proceedings of the
2nd International Conference on Bioinformatics Re-
search and Development (BIRD’08), volume 13 of
Communications in Computer and Information Sci-
ence. Springer.
Pitk
¨
anen, E., Rousu, J., and Ukkonen, E. (2010). Computa-
tional methods for metabolic reconstruction. Current
Opinion in Biotechnology, 21(1):70–77.
Raman, K. and Chandra, N. (2009). Flux balance analy-
sis of biological systems: applications and challenges.
Briefings in Bioinformatics, 10(4):435–449.
Rantanen, A., Rousu, J., Jouhten, P., Zamboni, N., Maa-
heimo, H., and Ukkonen, E. (2008). An analytic and
systematic framework for estimating metabolic flux
ratios from 13 C tracer experiments. BMC Bioinfor-
matics, 9(1):266.
Raz, R. and Safra, S. (1997). A sub-constant error-
probability low-degree test, and a sub-constant error-
probability PCP characterization of NP. In Proceed-
ings of the Twenty-Ninth Annual ACM Symposium on
Theory of Computing, pages 475–484.
Sankoff, D. (1975). Minimal mutation trees of sequences.
SIAM J. Appl, 28:35–42.
Sharan, R. and Ideker, T. (2006). Modeling cellular machin-
ery through biological network comparison. Nature
Biotechnology, 24:427–433.
Sigurdsson, M. I., Jamshidi, N., Jonsson, J. J., and Palsson,
B. O. (2009). Genome-scale network analysis of im-
printed human metabolic genes. Epigenetics, 4(1):43–
46.
Tohsato, Y., Matsuda, H., and Hashimoto, A. (2000). A
multiple alignment algorithm for metabolic pathway
analysis using enzyme hierarchy. In Proceedings
of the Eighth International Conference on Intelligent
Systems for Molecular Biology, pages 376–383.
Tuller, T., Birin, H., Gophna, U., Kupiec, M., and Ruppin,
E. (2010). Reconstructing ancestral gene content by
coevolution. Genome Res., 20(1):122–132.
Wagner, A. (2009). Evolutionary constraints permeate
large metabolic networks. BMC Evolutionary Biol-
ogy, 9(1):231.
BIOINFORMATICS 2011 - International Conference on Bioinformatics Models, Methods and Algorithms
38
