
METABOLIC MODELING OF CONVERGING METABOLIC
PATHWAYS
Analysis of Non-steady State Stable Isotope-resolve Metabolism
of UDP-GlcNAc and UDP-GalNAc
Hunter N. B. Moseley, Richard M. Higashi, Teresa W-M. Fan
Department of Chemistry, University of Louisville, 2320 S Brook Street, Louisville, KY 40292, U.S.A.
Structural Biology Program, JG Brown Cancer Center, University of Louisville, Louisville, KY 40202, U.S.A.
Andrew N. Lane
Department of Chemistry, University of Louisville, 2320 S Brook Street, Louisville, KY 40292, U.S.A.
Structural Biology Program, JG Brown Cancer Center, University of Louisville, Louisville, KY 40202, U.S.A.
Department of Medicine, Clinical Translational Research Building, 505 S. Hancock St., Louisville KY 40202, U.S.A.
Keywords: Metabolic modelling, Systems biochemistry, Model optimization, Model selection, Non-steady state,
Stable isotope-resolved metabolomics, SIRM, GAIMS, Mass spectrometry, UDP-GlcNAc, UDP-GalNAc.
Abstract: We have developed a novel metabolic modeling methodology that traces the flow of functional moieties
(chemical substructures) through metabolic pathways via the deconvolution of mass isotopologue data of
specific metabolites. We have implemented a general simulated annealing/genetic algorithm for parameter
optimization called Genetic Algorithm for Isotopologues in Metabolic Systems (GAIMS), with a model
selection method developed from the Akaike information criterion. GAIMS is tailored for analysis of ultra-
high resolution, high mass-accuracy isotopologue data from Fourier transform-ion cyclotron resonance mass
spectrometry (FT-ICR-MS) for interpretation of non-steady state stable isotope-resolved metabolomics
(SIRM) experiments. We applied GAIMS to a time-course of uridine diphospho-N-acetylglucosamine
(UDP-GlcNAc) and uridine diphospho-N-acetylgalactosamine (UDP-GalNAc) isotopologue data obtained
from LNCaP-LN3 prostate cancer cells grown in [U-
13
C]-glucose. The best metabolic model was identified,
which revealed the relative contribution of specific metabolic pathways to
13
C incorporation from glucose
into individual functional moieties of UDP-GlcNAc and UDP-GalNAc. Furthermore, this analysis allows
direct comparison of MS isotopologue data with NMR positional isotopomer data for independent
experimental cross-verification.
1 INTRODUCTION
Modeling of cellular metabolism is a well-
established technique for studying the flow of matter
and energy through cells for a variety of purposes
including: i) understanding cellular growth (Edwards
et al., 2001), ii) determining the effects of gene and
signalling pathways on cellular metabolism (Sauer,
1999); and iii) detection of biomarkers (Harrigan
and Goodacre, 2003). Several common and related
modeling techniques such as metabolic balance
analysis (Fell, 1984; Savinell and Palsson, 1992;
Kaufman et al., 2003) and metabolic control analysis
(Fell, 1997; Stephanopoulos, 1999; Hellerstein,
2003; Sauer, 2006) have been developed which use a
series of differential equations to model the flux of
metabolites. These techniques typically require
steady-state conditions that allow the application of
standard numerical methods to solve a system of
differential equations in the form of an eigensystem.
While steady-state conditions are often assumed, in
reality they are quite hard to establish, maintain, and
verify for actual experiments involving mammalian
cells. For multicellular organisms, steady state
conditions for all metabolites are practically
impossible to establish. Also, most applications of
108
N. B. Moseley H., M. Higashi R., W-M. Fan T. and N. Lane A..
METABOLIC MODELING OF CONVERGING METABOLIC PATHWAYS - Analysis of Non-steady State Stable Isotope-resolve Metabolism of
UDP-GlcNAc and UDP-GalNAc.
DOI: 10.5220/0003129401080115
In Proceedings of the International Conference on Bioinformatics Models, Methods and Algorithms (BIOINFORMATICS-2011), pages 108-115
ISBN: 978-989-8425-36-2
Copyright
c
2011 SCITEPRESS (Science and Technology Publications, Lda.)
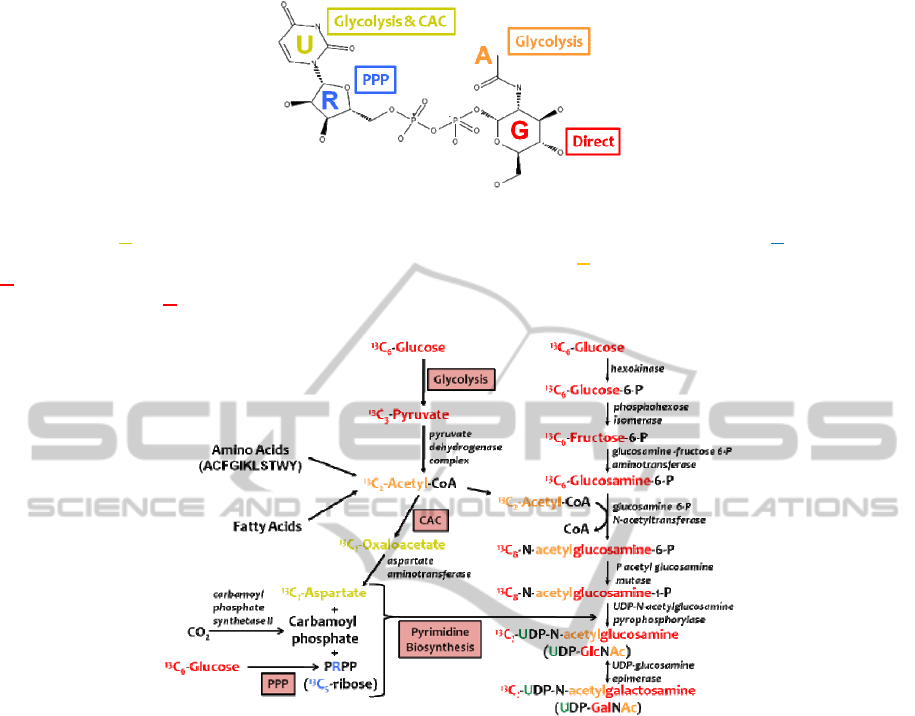
Figure 1: Structure of UDP-GlcNAc labeled by its functional moieties and their biosynthetic pathways from a [U-
13
C]-
glucose source. Uracil moiety is derived from glycolysis, citric acid cycle and pyrimidine biosynthesis. Ribose moiety is
derived from the pentose phosphate pathway and pyrimidine biosynthesis. A
cetyl moiety is derived from glycolysis.
G
lucose moiety is directly incorporated. UDP-GalNAc has an identical structure and pathway derivation with glucose
replaced by its isomer G
alactose.
Figure 2: Converging metabolic pathways leading from [U-
13
C]-glucose to UDP-GlcNAc and UDP-GalNAc.
13
C-labeled
glucose is incorporated into the nucleotide sugars via four routes: i) direct incorporation via the right UDP-hexose
biosynthetic pathway; ii) via glycolysis; iii) via glycolysis, citric acid acid cycle, and pyrimidine biosynthesis; and iv) via
the pentose phosphate pathway and pyrimidine biosynthesis.
these modelling techniques rely on total metabolite
concentrations or isotopic ratios derived from
experiment, which creates an underdetermined
system of equations where there are more variables
than independent data. Thus, unique meaningful
solutions to these numerical systems are not always
possible (Schellenberger and Palsson, 2009) and
their use in testing model validity is therefore
limited.
Using stable isotope resolved metabolomics
(SIRM) to determine individual isotopomers and
isotopologues detected by NMR and mass
spectrometry, respectively, can greatly increase the
ratio of experimental data to equation variables
(Lane et al., 2009). Supplying [U-
13
C]-glucose to
cells in culture allows each carbon in a detected
metabolite to be a separate sensor for
13
C
incorporation. However, detection, resolution, and
unique identification of individual isotopologues
requires the ultra-high mass accuracy provided by
FT-ICR-MS (Lane et al., 2008; Lane et al., 2009;
Moseley, 2010). Moreover, steady-state conditions
are even harder to establish with isotopomer and
isotopologue data (Lane et al., 2009), and may be
undesirable when one seeks to maximize the
information content of the data (Wahl et al., 2008).
Since steady-state conditions for SIRM
experiments are neither achievable, nor desirable in
mammalian cells, we have developed a novel
metabolic modeling methodology that interprets
isotopologue data of detected metabolites as flows of
functional moieties through metabolic pathways.
Such moieties correspond to actual, individual
biochemical entities, rather than sums of species.
These moiety models are optimized using a
combined simulated annealing genetic algorithm
METABOLIC MODELING OF CONVERGING METABOLIC PATHWAYS - Analysis of Non-steady State Stable
Isotope-resolve Metabolism of UDP-GlcNAc and UDP-GalNAc
109

called Genetic Algorithm for Isotopologues in
Metabolic Systems (GAIMS). GAIMS optimizes
model variables to fit a given moiety model to
isotopologue data of specific metabolites obtained
from non-steady state SIRM experiments.
We used GAIMS to optimize moiety models
against time-course isotopologue data for UDP-
GlcNAc and UDP-GalNAc obtained from LNCaP-
LN3 prostate cancer cells grown in [U-
13
C]-glucose.
Metabolic control of UDP-GlcNAc and UDP-
GalNAc underlies the regulation of many biological
processes via O-linked glycosylation of proteins,
including nutrient sensing, protein degradation, gene
expression (Hart et al., 2007), and embryogenesis
(Gambetta et al., 2009). UDP-GlcNAc and UDP-
GalNAc are composed of four functional moieties as
shown in Figure 1: glucose or galactose, ribose,
acetyl, and UDP. These four functional moieties
represent the convergence of several major
metabolic pathways that lead from [U-
13
C]-glucose
to UDP-GlcNAc and UDP-GalNAc biosynthesis as
shown in Figure 2. These pathways include
glycolysis, the citric acid cycle, the pentose
phosphate pathway, pyrimidine biosynthesis, and the
UDP-hexose biosynthetic pathway referred to as the
“direct” pathway. Furthermore, other carbon sources
can contribute to the synthesis of the uracil and
acetyl moieties, to an extent that is cell and
condition dependent. The moiety modeling seeks to
determine the relative contributions for each
pathway segment.
UDP-GlcNAc and UDP-GalNAc are handled
together in this analysis because as these two
metabolites have identical mass-to-charge ratios, the
isotopologue peak intensities are the sum of both
metabolites. However, from NMR isotopomer
analysis (data not shown), UDP-GlcNAc is the
major contributor to the isotopologue intensities and
that this contribution is proportional across the set of
isotopologue peaks. This makes logical sense
because UDP-GlcNAc and UDP-GalNAc are
separated by a single reversible enzymatic reaction
catalyzed by the UDP-glucosamine epimerase.
2 METHODS
2.1 Data Acquisition and Natural
Abundance Correction
LNCaP-LN3 prostate cancer cells (donated from
Roswell Park) were grown to 70% confluence at 37º
C in RPMI 1640 medium supplemented with: 10%
FBS, 100 units/mL penicillin, 100 µg/mL
streptomycin, 0.2% glucose, and 5% CO
2
. Next,
medium was replaced with a similar RPMI 1640
medium containing 0.2% [U-
13
C] glucose. Cells
were harvested at different time points, centrifuged,
extracted with 10% trichloroacetic acid, lyophilized,
and dissolved in H
2
O. These samples were then
analyzed via direct infusion nanoelectrospray FT-
ICR-MS in negative ion mode using a Thermo 7T
LTQ FT-MS. Isotopologue peaks were assigned
using the software PREMISE (Lane et al., 2009) and
each peak intensity was measured and normalized to
the sum of the isotopologue intensities:
I
n
,
obs
= I
n
,
raw
/Σ I
i
,
raw
(1)
Finally, the set of UDP-GlcNAc and UDP-
GalNAc isotopologue intensities were corrected for
13
C natural abundance using the following three
equations implemented in an iterative algorithm
(Moseley, 2010).
(2)
(3)
(4)
2.2 Moiety Modeling
As is shown in Figure 1, UDP-GlcNAc is composed
of four functional moieties, glucose, ribose, acetyl,
and uracil, representing convergence of several
metabolic pathways. We can represent each moiety
as a set of state variables reflecting the probabilities
of
13
C incorporation into each moiety. The state
variables g0,r0,a0,u0 represent the probability of no
13
C incorporation in glucose, ribose, acetyl, and
uracil, respectively. From Figure 2, it seems
reasonable to restrict
13
C incorporation for glucose,
ribose, and acetyl to the fully labelled state variables
g6, r5, and a2, respectively. This is experimentally
corroborated by the absence of partially labelled
isotopomers of glucose, ribose, and acetate.
Naturally, then the following relationships hold for
the state variables of glucose, ribose, and acetyl:
g6 = 1 – g0
r5 = 1 - r0
a2 = 1 – a0
(5)
However, the biosynthesis of uracil mixes
13
C
from labelled glucose via
13
C
2
-acetyl-CoA with
12
C
from other (unlabeled) sources during the citric acid
BIOINFORMATICS 2011 - International Conference on Bioinformatics Models, Methods and Algorithms
110

cycle. Thus, multiple state variables u1,u2, and u3
must be used to represent the partial labelling of
uracil. There is no u4 state variable since one carbon
of uracil is derived from unlabeled CO
2
. These state
variables have the following relationship:
u0 + u1 + u2 + u3 = 1 (6)
The state variables for all four moieties can
describe the probabilities for 32 different
isotopomers of UDP-GlcNAc and the intensities for
18 isotopologues via the following set of equations:
I
0
= g0r0a0u0
I
1
= g0r0a0u1
I
2
= g0r0a0u2 + g0r0a2u0
I
3
= g0r0a0u3 + g0r0a2u1
I
4
= g0r0a2u2
I
5
= g0r5a0u0 + g0r0a2u3
I
6
= g6r0a0u0 + g0r5a0u1
I
7
= g6r0a0u1 + g0r5a2u0 + g0r5a0u2
I
8
= g6r0a2u0 + g6r0a0u2 + g0r5a0u3 + g0r5a2u1
I
9
= g6r0a0u3 + g6r0a2u1 + g0r5a2u2
I
10
= g6r0a2u2 + g0r5a2u3
I
11
= g6r5a0u0 + g6r0a2u3
I
12
= g6r5a0u1
I
13
= g6r5a0u2 + g6r5a2u0
I
14
= g6r5a0u3 + g6r5a2u1
I
15
= g6r5a2u2
I
16
= g6r5a2u3
I
17
= NA contribution only
(7)
In addition, these state variables and their
constraining relationships provide six optimizable
parameters (g6, r5, a2, u1, u2, u3), one each for
glucose, ribose, and acetyl and three for uracil.
These variables are time dependent, and constitute
the starting point for detailed flux analysis of the
specific metabolic network that described the
synthesis of the observed product.
2.3 GAIMS
To extract the variables from the data, we have
developed a combined simulated annealing and
genetic algorithm called Genetic Algorithm for
Isotopologues in Metabolic Systems (GAIMS) to
optimize moiety model parameters. GAIMS uses a
description of the moiety model to calculate
isotopologue intensities (Equations 7). The program
then uses these calculated isotopologue intensities
(I
n,calc
) with the observed experimental isotopologue
intensities (I
n,obs
) to create a target function that
compares calculated isotopologue intensities to their
experimentally observed counterparts:
target_function = Σabs(I
n
,
obs
– I
n
,
calc
)
(8)
Other target functions were tested including the
commonly used sum of squared differences;
however, that function tended to fit stronger
isotopologue intensities at the expense of weaker
isotopologue intensities. Also, target functions
normalized by intensity demonstrated poorer
convergence, probably due to the higher fractional
error in the weaker isotopologue intensities. Overall,
the target function represented by Equation 8
provided the best behaviour.
For each parameter optimization, GAIMS used a
linear annealing scheme over 1,000,000 steps.
Genetic algorithm settings included a population
size of 20 with a cross-over versus mutation rate
ratio of 1:20. Mutation steps changed three
parameters at a time to compensate for any
dependencies between parameters. Each
optimization was performed 50 times to verify
robustness (i.e. avoidance of local minima) and to
provide meaningful statistics of convergence.
2.4 Model Selection using AIC
We developed a model selection method using the
following form of the Akaike information criterion
or AIC (Akaike, 1974):
≈ 2 + log
∑
,
,
(9)
In Equation 9, k is the number of moiety model
parameters being optimized. The log of the average
sum of squares of differences approximates the log
likelihood of a given model. The calculated
isotopologue intensities I
i,calc
are derived from
average moiety model parameters for all 50
optimizations. With this equation, we can compare
models with a different number of optimizable
parameters. This model selection method was
developed as a part of GAIMS.
3 RESULTS
3.1 Fit of Expert-derived
Moiety Model
Figure 3 shows the fit of calculated isotopologue
intensities from the expert-derived moiety model
(Equations 7) to the 72-hour time point of
experimental isotopologue intensities representing
METABOLIC MODELING OF CONVERGING METABOLIC PATHWAYS - Analysis of Non-steady State Stable
Isotope-resolve Metabolism of UDP-GlcNAc and UDP-GalNAc
111
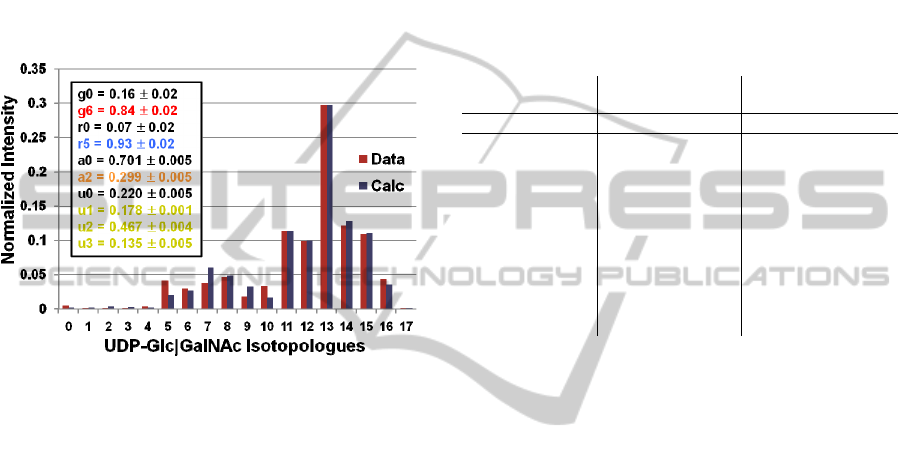
both UDP-GlcNAc and UDP-GalNAc. From this fit,
we obtain values for each functional moiety state
variable. All fifty optimizations converged quite
well as indicated by the standard deviations in state
variables. Interestingly, the fit of high intensity
isotopologues appears better than low intensity
isotopologues. In addition, we repeated this analysis
with 50 optimizations using 10,000,000 steps and 50
optimizations using 100,000 steps and obtained very
similar results in both parameter values and standard
deviations (data not shown), further demonstrating
the robustness of the parameter optimization.
Figure 3: Fit of optimized expert-derived moiety model to
FT-ICR-MS isotopologue data of UDP-GlcNAc and UDP-
GalNAc from tissue culture sample after 72 hours of
labeling with uniformly
13
C-labeled glucose.
3.2 Comparison of Models
using a Target Function
To explore reasons why some of the low intensity
isotopologues did not fit as well, we examined
alternative moiety models that tested assumptions of
our original model. From the pathway diagram in
Figure 2, there is the possibility that scrambling of
13
C incorporation in the acetyl moiety might be
occurring via amino acid biosynthetic and catabolic
pathways on the time-scale of 72 hours. So we
created an extended acetyl model with additional
terms (i.e., I
1
= g0r0a0u1 + g0r0a1u0) in Equations
7 using the acetyl moiety state variable a1 along
with the following relationship:
a0 + a1 + a2 = 1 (10)
In a similar manner, we created another
alternative moiety model with the addition of the u4
state variable for the uracil moiety. This CO
2
-
inclusive model tested the hypothesis that all CO
2
used in uracil biosynthesis is unlabeled. Likewise,
the relationship between uracil state variables was
expanded in the following manner:
u0 + u1 + u2 + u3 + u4 = 1 (11)
Table 1 shows the comparison between the three
moiety models. The value indicated for the target
function is the average across all 50 optimizations
for each model. Equation 8 clearly indicates that this
is a minimizing target function and thus lower
values are better.
Table 1: Comparison between three moiety models using
the average value of the target function.
CO
2
-Inclusive
(7_G1R1A1U4)
Expert-Derived
(6_G1R1A1U3)
Extended Acetyl
(7_G1R1A2U3)
TF = 0.1103 TF = 0.1096 TF = 0.0913
g0 = 0.15
g6 = 0.85
r0 = 0.08
r5 = 0.92
a0 = 0.70
a2 = 0.30
u0 = 0.22
u1 = 0.18
u2 = 0.47
u3 = 0.14
u4 = 0.001
g0 = 0.16
g6 = 0.84
r0 = 0.07
r5 = 0.93
a0 = 0.70
a2 = 0.30
u0 = 0.22
u1 = 0.18
u2 = 0.47
u3 = 0.14
g0 = 0.15
g6 = 0.85
r0 = 0.08
r5 = 0.92
a0 = 0.28
a1 = 0.15
a2 = 0.57
u0 = 0.54
u1 = 0.15
u2 = 0.22
u3 = 0.09
The results in Table 1 clearly indicate that the
CO
2
-inclusive model is worse than the expert-
derived model. Moreover, the extended acetyl model
appears to be the best model. However, the extended
acetyl model has one additional optimizable
parameter, which might afford the improvements
observed in the target function.
We also optimized an additional CO
2
-inclusive
model where the
13
C incorporation via CO
2
was
modelled as its own state variables c0 and c1. This
moiety model gave very similar results to those for
the original CO
2
-inclusive model, indicating that the
specific implementation of a model is not critical
(data not shown).
3.3 Comparison of Models using AIC
We used the form of the AIC in Equation 9 to
address the issue of model comparison involving
different number of optimizable parameters. The
AIC is calculated for each model using the average
parameter values across the 50 GAIMS
optimizations. But instead of just comparing three
possible models, we created a set of over 40 moiety
models to compare, ranging from plausible to
completely nonsense models. The expert-derived
model is represented by the identifier 6_G1R1A1U3,
where the first number indicates the number of
optimizable parameters in the model and
BIOINFORMATICS 2011 - International Conference on Bioinformatics Models, Methods and Algorithms
112

G1R1A1U3 represents one parameter in the glucose
moiety, one parameter in the ribose moiety, one
parameter in the acetyl moiety, and three parameters
in the uracil moiety, respectively. Deviations from
the expert-derived model are indicated by state
variables that are modified or added.
Table 2: Comparison of 40 moiety models using the AIC
and the experimental FT-ICR-MS isotopologue data of
UDP-GlcNAc and UDP-GalNAc at the 72-hour time
point.
AIC Moiety Model
-157.43
-109.64
-136.29
-154.32
-137.17
-133.12
-159.00
-72.52
-72.52
-151.40
-153.52
-156.29
-158.25
-153.65
-159.24
-147.55
-163.39
-153.95
-153.64
-158.87
-151.21
-160.84
-154.17
-156.58
-158.22
-154.14
-159.10
-157.39
-148.47
-161.97
-153.91
-154.09
-158.85
-151.36
-159.52
-155.89
-154.77
-156.24
-152.79
-156.13
-155.50
6_G0R2A1U3_g3r2r3_g6r5
6_G1R1A1U3_a1
6_G1R1A1U3_g5
6_G1R1A1U3
6_G1R1A1U3_r4
6_G1R1A1U3_u4
7_G0R2A2U3_g3r2r3_g6r5
7_G0R3A1U3_g3r2r3_g6r5_g5r4
7_G0R3A1U3_g3r2r3_g6r5_r4
7_G1R1A1U3C1
7_G1R1A1U4
7_G1R1A2U3
7_G1R2A1U3_g3r2r3
7_G1R2A1U3_r1
7_G1R2A1U3_r2
7_G1R2A1U3_r3
7_G1R2A1U3_r4
7_G2R1A1U3_g1
7_G2R1A1U3_g2
7_G2R1A1U3_g3
7_G2R1A1U3_g4
7_G2R1A1U3_g5
8_G1R1A2U3C1
8_G1R2A2U3_g3r2r3_g6r5_g5
8_G1R2A2U3_g3r2r3
8_G1R2A2U3_r1
8_G1R2A2U3_r2
8_G1R2A2U3_r2r3
8_G1R2A2U3_r3
8_G1R2A2U3_r4
8_G2R1A2U3_g1
8_G2R1A2U3_g2
8_G2R1A2U3_g3
8_G2R1A2U3_g4
8_G2R1A2U3_g5
9_G2R2A2U3_r2r3_g1
9_G2R2A2U3_r2r3_g2
9_G2R2A2U3_r2r3_g3
9_G2R2A2U3_r2r3_g4
9_G2R2A2U3_r2r3_g5
9_G2R2A2U3_r2r3_g6r5_g3_g5
Table 2 shows the AIC for all these models
based on the 72-hour time point of experimental
isotopologue intensities. The models in red all
indicate AICs that are better than the expert-derived
model. However, the 7_G1R2A1U3_r4 model gave
the best (lowest) AIC even though this model with
ribose state variables r5, r4, and r0 makes no
biochemical sense given the known information
about the pentose phosphate pathway in human
cells. In fact, many nonsense models gave better
results than the expert-derived model, indicating a
significant problem with overfitting.
3.4 Model Selection using AIC
with Multiple Time Points
Table 3: Comparison of 40 moiety models using the AIC
and the experimental FT-ICR-MS isotopologue data of
UDP-GlcNAc and UDP-GalNAc at the 34-hour, 48-hour,
and 72-hour time points.
AIC Moiety Model
-321.81
-355.87
-326.98
-428.98
-332.69
-308.16
-291.31
-287.32
-290.16
-306.58
-293.12
-299.86
-294.52
-308.59
-288.94
-277.44
-244.47
-318.01
-317.89
-286.93
-277.12
-252.21
-288.84
-296.01
-288.88
-290.93
-296.67
-296.18
-251.87
-239.25
-303.97
-293.45
-288.32
-260.59
-236.42
-293.74
-279.33
-291.46
-241.63
-227.58
-276.84
6_G0R2A1U3_g3r2r3_g6r5
6_G1R1A1U3_a1
6_G1R1A1U3_g5
6_G1R1A1U3
6_G1R1A1U3_r4
6_G1R1A1U3_u4
7_G0R2A2U3_g3r2r3_g6r5
7_G0R3A1U3_g3r2r3_g6r5_g5r4
7_G0R3A1U3_g3r2r3_g6r5_r4
7_G1R1A1U3C1
7_G1R1A1U4
7_G1R1A2U3
7_G1R2A1U3_g3r2r3
7_G1R2A1U3_r1
7_G1R2A1U3_r2
7_G1R2A1U3_r3
7_G1R2A1U3_r4
7_G2R1A1U3_g1
7_G2R1A1U3_g2
7_G2R1A1U3_g3
7_G2R1A1U3_g4
7_G2R1A1U3_g5
8_G1R1A2U3C1
8_G1R2A2U3_g3r2r3_g6r5_g5
8_G1R2A2U3_g3r2r3
8_G1R2A2U3_r1
8_G1R2A2U3_r2
8_G1R2A2U3_r2r3
8_G1R2A2U3_r3
8_G1R2A2U3_r4
8_G2R1A2U3_g1
8_G2R1A2U3_g2
8_G2R1A2U3_g3
8_G2R1A2U3_g4
8_G2R1A2U3_g5
9_G2R2A2U3_r2r3_g1
9_G2R2A2U3_r2r3_g2
9_G2R2A2U3_r2r3_g3
9_G2R2A2U3_r2r3_g4
9_G2R2A2U3_r2r3_g5
9_G2R2A2U3_r2r3_g6r5_g3_g5
METABOLIC MODELING OF CONVERGING METABOLIC PATHWAYS - Analysis of Non-steady State Stable
Isotope-resolve Metabolism of UDP-GlcNAc and UDP-GalNAc
113

To address the issue of overfitting, we optimized
the isotopologue data for the 34-hour, 48-hour, and
72-hour time points simultaneously and calculated
an AIC for the combined optimization. The expert-
derived model had the best AIC of -428.98. The next
best model 6_G1R1A1U3_a1 was significantly
worse with an AIC of -355.87, indicating that
overall, the expert-derived model provides the best
description of the data.
4 CONCLUSIONS
We have demonstrated a novel metabolic modelling
methodology applied to FT-ICR-MS isotopologue
intensity data for UDP-GlcNAc and UDP-GalNAc.
Our implementation, GAIMS, interprets a set of
isotopologues as the flow of functional moieties
through metabolic pathways. This is represented by
a set of optimizable parameters for a given moiety
model. Figure 2 demonstrates a solid convergence of
50 individual optimizations for an expert-derived
model based on what is currently known about
UDP-GlcNAc biosynthesis. However, the standard
deviations for parameter values should not be
interpreted as a close representation of parameter
error, especially with the indication of model
overfitting in results from Table 2.
In addition, we demonstrate a robust model
selection method, which uses a form of the Akaike
information criterion (Equation 9). Our use of the
average parameter values from a set of optimizations
allows the AIC to sense smoothness of the error
surface for the target function of a given moiety
model. This application of the AIC along with the
use of isotopologues from multiple time points
enables our model selection method to overcome
issues of model overfitting for a set of isotopologues
at individual time points. We envision the coupling
of this robust model selection method with newer
non-steady-state metabolic flux analytical methods
(Selivanov et al., 2006; Wahl et al., 2008) as a
logical next step.
ACKNOWLEDGEMENTS
This work was supported in part by National Science
Foundation EPSCoR grant # EPS-0447479, NIH
NCRR Grant 5P20RR018733, 1R01CA118434-
01A2 (TWMF), 1RO1 CA101199 (TWMF)
R21CA133688-01 (ANL) from the National Cancer
Institute, DOE Grant Number DE-EM0000197
(HNBM), the Cardinal Research Cluster, the
Kentucky Challenge for Excellence, and the Brown
Foundation.
REFERENCES
Akaike, H., 1974. “A new look at the statistical model
identification”, IEEE Transactions on Automatic
Control, 19, 716–723.
Edwards, J. S., Ibarra, R. U., Palsson, B. O., 2001. “In
silico predictions of Escherichia coli metabolic
capabilities are consistent with experimental data”,
Nature Biotech, 19, 125-130.
Fell, D. A., 1984. “Fat synthesis in adipose tissue. An
examination of stoichiometric constraints”, J Biochem,
238, 781-786.
Fell, D.A., 1997. Understanding the Control of
Metabolism, London: Portland Press.
Gambetta, M. C., Oktaba, K., & Müller, J., 2009.
“Essential Role of the Glycosyltransferase Sxc/Ogt in
Polycomb Repression”, Science, 325, 93-96.
Harrigan, G. G., Goodacre, R. (Ed), 2003. Metabolic
profiling: its role in biomarker discovery and gene
function analysis, Boston: Kluwer Academic
Publishers.
Hart G. W., Housley M. P., Slawson C., 2007. "Cycling of
O-linked beta-N-acetylglucosamine on
nucleocytoplasmic proteins", Nature, 446, 1017-1022.
Hellerstein, M. K., 2003. “In vivo measurement of fluxes
through metabolic pathways: the missing link in
functional genomics and pharmaceutical research”,
Annu Rev Nutr, 23, 379-402.
Kauffman, K. J., Prakash, P., Edwards, J. S., 2003.
“Advances in flux balance analysis”, Curr Opin
Biotech, 14, 491-496.
Lane A. N., Fan T. W-M., Higashi R. M., 2008.
“Isotopomer-based metabolomic analysis by NMR and
mass spectrometry". Methods in Cell Biology,Vol 84.
Biophysical Tools for Biologists, Vol 1,ed. Correia JJ,
Detrich HW. Elsevier Science & Technology Books
Ch.18. 541-588.
Lane, A. N., Fan, T. W-M., Xie, Z., Moseley, H. N. B.,
Higashi, R. M., 2009. “Stable isotope analysis of lipid
biosynthesis by high resolution mass spectrometry and
NMR.”, Anal Chim Acta, 651, 201-208.
Moseley, H. N. B., 2010. “Correcting for the Effects of
Natural Abundance in Stable Isotope Resolved
Metabolomics Experiments Involving Ultra-High
Resolution Mass Spectrometry”, BMC Bioinformatics,
11, 139-144.
Savinell, J. M., Palsson, B. O., “Optimal selection of
metabolic fluxes for in vivo measurement. I.
Development of mathematical methods”, J Theor Biol,
155, 201-214.
Sauer, U., Lasko, D. R., Fiaux, J., Hochuli, M., Glaser, R.,
Szyperski, T., Wuthrich, K., Bailey, J. E., 1999.
“Metabolic Flux Ratio Analysis of Genetic and
Environmental Modulations of Escherichia coli
BIOINFORMATICS 2011 - International Conference on Bioinformatics Models, Methods and Algorithms
114

Central Carbon Metabolism”, J Bacteriol, 181, 6679-
6688.
Sauer, U., 2006. “Metabolic networks in motion: 13C-
based flux analysis”, Mol Syst Biol, 2, 62.
Schellenberger, J., Palsson, B. O., 2009. “Use of
Randomized Sampling for Analysis of Metabolic
Networks”, J Biol Chem, 284, 5457-5461.
Selivanov, V. A., Marin, S., Lee, P. W. N., Cascante, M.,
2006. “Software for dynamic analysis of tracer-based
metabolomics data: estimation of metabolic fluxes and
their statistical analysis”, Bioinformatics, 22, 2806-
2812.
Stephanopoulos, G., “Metabolic fluxes and metabolic
engineering”, Metab Eng, 1, 1-11.
Wahl, S. A., Nöh, K., Wiechert, W., 2008. “13C labelling
experiments at metabolic nonstationary conditions: An
exploratory study”, BMC Bioinformatics, 9, 152-169.
METABOLIC MODELING OF CONVERGING METABOLIC PATHWAYS - Analysis of Non-steady State Stable
Isotope-resolve Metabolism of UDP-GlcNAc and UDP-GalNAc
115
